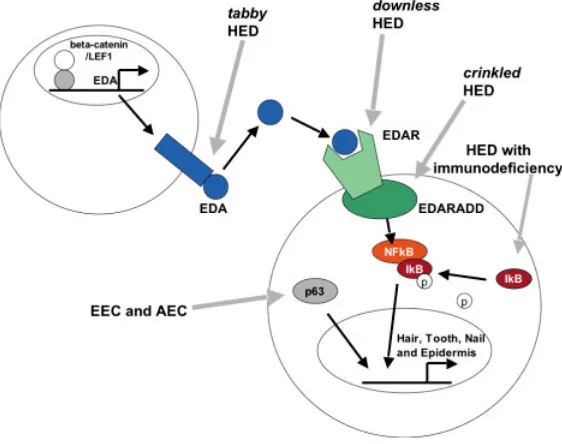
Inherited disorders of the skin in human and mouse: from development to differentiation
Full text
Figure


Related documents
Latex agglutination slide test, for screening and detec- tion of VP6 group A rotavirus antigen, was used with the Plasmatec kit (LOT: 218028) following the manufac- turer ’
We performed in vitro cleavage assays to confirm the processing of 19 putative RNase III cleavage sites selected using the following criteria: (i) top ranking based on search
Control of gdhR expression in Neisseria gonorrhoeae via autoregulation and a master repressor (MtrR) of a drug efflux pump operon.. Gilmore, Harvard
The Houston (First) Court of Appeals agreed with HBU. 59 The court noted that a promise of permanent or lifetime employment must be reduced to writing to be
With the experimentally defined orientation of HokB pores, a positive potential mimics a cell with a polarized membrane, indicating that mature HokB pores are formed in cells with a
This analysis showed that the intensity of PD-1 expression per cell was higher in specific cells from treated patients than in those of controllers, both in the MemX5 ⫺ ( P ⫽ 0.002)
increases the permeability of the alveolar-capillary mem- brane of the lung, deranges respiratory system mechanics, induces lung inflammation, and results in acute lung injury,
Reconstructed invariant mass from Z into electron events in the barrel, using the data taken at 7 TeV in 2011.. The blue line shows the uncorrected distribution, while the red line