Methodology for Evaluating the Usability of User Interfaces in Mobile Services
Pedro Concejero (1), Daniel Tapias (2), Juan José Rodríguez (1), Juan Carlos Luengo (2),
Sebastián Sánchez (2)
(1) Telefónica Investigación y Desarrollo (2) Telefónica Móviles España - Universidad de Alcalá Emilio Vargas, 6; E-28043 Ronda de la Comunicación s/n
Madrid (Spain) E-28050 - Madrid (Spain)
[email protected], [email protected]
Abstract
In this paper we present a usability measure adapted to mobile services, which is based on the well-known theoretical framework defined in the ISO 9241-11 [ISO 9241 (1988)] standard. This measure is then applied to a representative set of services of the Telefónica’s portfolio for residential customers. The user tests that we present were carried out by a total of 327 people.
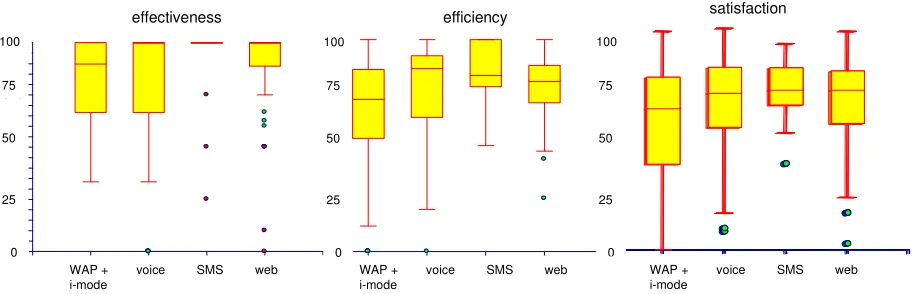
Additionally, in section 3 we describe the application of the methodology to a particular service and section 4 presents the results of the experiments. These results show highly significant differences in the three usability measures considered, though all of them have the same trend. The worst performers in all cases were the WAP and i-mode user interfaces (UI), while the best performers were the SMS and web based UIs closely followed by the voice UI.
Finally, in section 5 we analyse the results and present our conclusions.
1.
Introduction
The definition of usability as well as the development of a methodology for measuring the usability are themes that have been and continue to be widely discussed [Frokjaer, E. et al. (2000)][Hornbik, K. (2006)][Nielsen, J. (1993)]; going from definitions in which usability is related to the concept of quality [Bevan, N. (1995)] to the broad definition of usability presented in the ISO 9241-11 standard [ISO 9241 (1988)]. Authors in [Frokjaer, E. et al. (2000)] concluded that "effectiveness, efficiency, and satisfaction should be considered independent aspect of usability and all be included in usability testing."
In this paper, we focus on the second point: can usability be measured in such a way that we can compare the usability of different user interfaces or different services or just different versions of either the same user interface or the same service? We strongly believe that usability can be measured quantitatively as we show with the data obtained through the user tests that have been carried out with 327 people.
The paper is organized as follows: in section 2 we present the theoretical framework of the usability measure we have developed and tested; section 3 shows the application of the methodology to a particular service; section 4 presents the results of the user tests and in section 5 we present the conclusions and the work we are currently concluding.
2.
Theoretical framework of the Usability
Measure
The usability of services is a core attribute from the beginning of the design phase in Telefónica, with the
following objectives [Helander, M. (1998)]:
- Usability must be quantifiable and not an opinion. - Usability must be in the same level as other quality
attributes in software engineering, as reliability or performance.
- It is essential to reach early consensus on the usability definition and criteria in the design team.
- Usability objectives must be weighted and prioritised as a function of the global objectives of the system. - Objectives must be clearly separated of methods and
implementations.
Therefore, we have developed a methodology which is an adaptation of the well-known theoretical framework defined in the ISO 9241-11 [ISO 9241 (1988)] standard to services. In the particular case of mobile services, the usability of a service can be formulated (1) as a function of the usability of the mobile phones used to access the service (U(phones)) and the usability of the service itself (U(service)). i.e.:
where the usability of the service (2) is computed as the weighted sum of the service usability in each of its user interfaces (voice, DTMF, WAP, i-mode, SMS, etc.):
and the usability of the phones (3) is computed as the weighted sum of the usability of the different phones utilised by the users:
Usability = α·f[U(service), U(phones)] (1)
N
5. Customize the second specific RBT, 6. Change the RBT of the latest customization, 7. Delete the customization of the second RBT, 8. Customize the RBT for a group, and
9. To look up for the renewal date of the specified RBT.
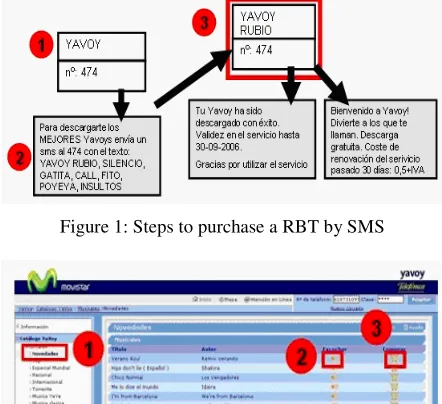
The effectiveness for a particular goal was computed as the percentage of users that were able to accomplish the proposed tasks as proposed to the participant by the experimenter. The efficiency was measured in terms of steps to achieve the goal. Figures 1 and 2 are provided as illustrations of the definition of steps for goal 2 above in two different user interfaces.
Figure 1: Steps to purchase a RBT by SMS
Figure 2: First 3 steps to purchase a RBT by web user interface
Finally, the user satisfaction was measured using a 12 questions questionnaire and three additional open questions. The efficiency and the user satisfaction were normalised to get scores ranging from 0 to 100.
4.
Results
4.1 Introduction
In this section we show the results of the usability measures we made in several services of Telefónica following the procedure illustrated in sections 1 and 2. The duration of the trials was limited to no more of 1 hour per user, during which time the user was requested to carry out different tasks as described above. All tests were carried out in the usability labs [Rodríguez J. J., et al. (2005)], and were designed, performed and controlled by the usability team.
4.2 Users and Services
All users were subscribers of Telefónica Móviles services
and products, and made the tests with their own mobile telephone. Once they signed the informed consent 1and received the instructions to make the tests, the participant’s own SIM card was changed with a SIM provided by the usability expert, so that he or she did not have to care at all about costs of using the services. In this way, we also ensured that the user knew about the use of the phone, and did not introduce strange effects when collecting the experimental data.
All available types of user interface for each one of the services were tested in the trials. In some cases, tested services had two or three types of the user interfaces. For instance, the “greetings” service (“Saludos”) was deployed only via voice and SMS, while RBT has all four different user interfaces.
A total of 327 people were recruited and participated in the tests, 205 males and 122 females. Average age for males was 29,67 years (± 8,16), and for females 28 (± 6,62). Minimum age for participants was 18 years old, and maximum age 62 years old.
We defined 3 user groups as a function of age, and its distribution is shown in table 1. This distribution is representative of the customer population of Telefónica Móviles, though it also shows that it is more difficult to recruit users beyond 35 years old.
In total, 29 combinations of service and user interface were tested in the different phases. Services are representative of the complete portfolio for residential customers, as for instance, Voicemail, Chat, Ring Back Tones, Messages, etc. Whenever possible, the trials included all the user interfaces available for each service tested. Tasks proposed to the user varied according to the requirements of the particular user interface, but with the same goals.
Table 1: Distribution of participants per age group
User interfaces as used in these analyses were: WAP and i-mode, voice (using the speech recognition technology used by the service), SMS (providing written commands to the service) and web (using a browser on a PC platform).
Each user interface was tested by a different number of users, as shown in table 2. Table 2 also shows the number of users per age groups and user interface. We can see a balanced distribution of ages per user interface, with the only exception of SMS, which was tested by a significantly smaller group. This is a condition that we have to observe when interpreting the statistical analyses results.
1
http://www.apa.org/monitor/jun04/ethics.html
5.
Conclusion
The results show highly significant differences in the three usability measures considered, with the same trend for each one of the usability measures.
Some of the distribution shapes of these measures are highly skewed, which means that the results of parametric significance tests have to be carefully interpreted [Kirk, R. E. (1995)]. The main problem arises when we have an unbalanced number of data per cell, which is very typical of this kind of experiments, in usability testing and in many other social science fields, where it is impossible to have perfectly balanced data per design cell. In these cases, having alternative significance tests is compulsory, and checking the consistency of the results by different approaches is what allows the experimenter to extract conclusions.
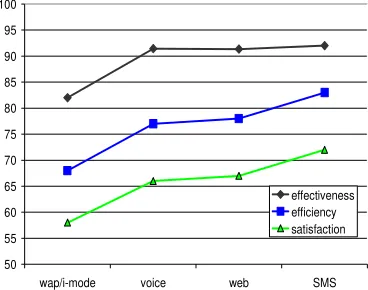
In our case, the fact that both non-parametric (Kruskal-Wallis) and parametric (ANOVA) tests provide highly significant results, allows us to conclude, with a high level of trust, that user interfaces of the Telefónica services provide different effectiveness, efficiency and satisfaction. And a very important result of all the tests is that the differences between the user interfaces in each of the usability measures follow the same trend as can be observed in Figure 4.
50 55 60 65 70 75 80 85 90 95 100
wap/i-mode voice web SMS
effectiveness efficiency satisfaction
Figure 4: Means plot of usability measures per type of user interface.
The worst performers in all cases are WAP and i-mode user interfaces. Voice recognition user interfaces are systematically and significantly better than the former. Web user interfaces are only slightly better than voice user interfaces. Finally, the best performer in all measures is the SMS user interface.
The fact that best performers are SMS and web access requires more discussion. First of all, participants in the tests received clear instructions about how to begin the test. This is critical for SMS-based interfaces, and this might not happen in real usage contexts. Another well documented fact is that users in laboratory situations are more motivated to accomplish the goals and to pay more attention to important details and explanations. From our results, it is clear that in lab situations, and once that users begin receiving clear step-by-step instructions in the SMS,
this user interface is probably the most effective and efficient.
On the other hand, the richer graphical user interfaces of web services, as used in a PC display, can provide also very good usability results, though there seems to be a trend to a smaller efficiency in comparison with SMS-based user interfaces.
Our results with voice user interfaces can also explain why users prefer this type of interaction instead of DTMF-based user interfaces.
Last, WAP and i-mode user interfaces are, at least at the moment when these tests were carried out, the least usable and satisfactory for many users.
6.
References
Bevan, N. (1995): Measuring Usability as Quality of Use. Software Quality Journal 4 (1995), pp.: 115-150.
Frokjaer, E. et al. (2000): Frokjaer, E., Hertzum, M., Hornbaek, K.: Measuring Usability: Are Effectiveness, Efficiency and Satisfaction Really Correlated?, Proceedings of SIGCHI Conference on Human Factors in Computing Systems. The Hague, The Netherlands. Pages: 345-352. 2000.
Helander, M. (1998): Handbook of Human-Computer Interaction. 2nd Ed. Amsterdam: North-Holland.
Hornbik, K. (2006): Current Practice in Measuring Usability: Challenges to Usability Studies in Research. International Journal of Human Computer Studies Archive. Volume 64, Issue 2, February 2006.
ISO 9241 (1988): Ergonomic requirements for office work with visual display terminals (VDT’s). Geneva: International Standards Organization.
Kirk, R. E. (1995): Experimental Design: Procedures for the Behavioral Sciences. Third Edition. Pacific Grove, CA: Brooks/Cole, 1995.
Nielsen, J. (1993): Usability Engineering. Academic Press, Boston, 1993.