191
4
Experiments & Results
All the experiments have been performed on a 32 GB Intel i7 processor, with a clock rate of 3.40 GHz. Since all the embedding models have been pre-trained, using a dedicated GPU doesn’t result in a significant speedup, as we have noticed an increase of only 1.5x - 2x while using a Nvidia GTX Geforce 1080 Ti, 11 GB graphics processor. The total training time for all combinations of datasets, vectorizers and classifiers is more than 3 weeks.
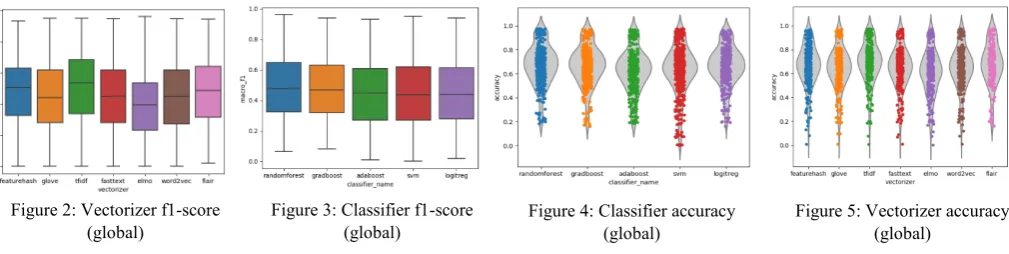
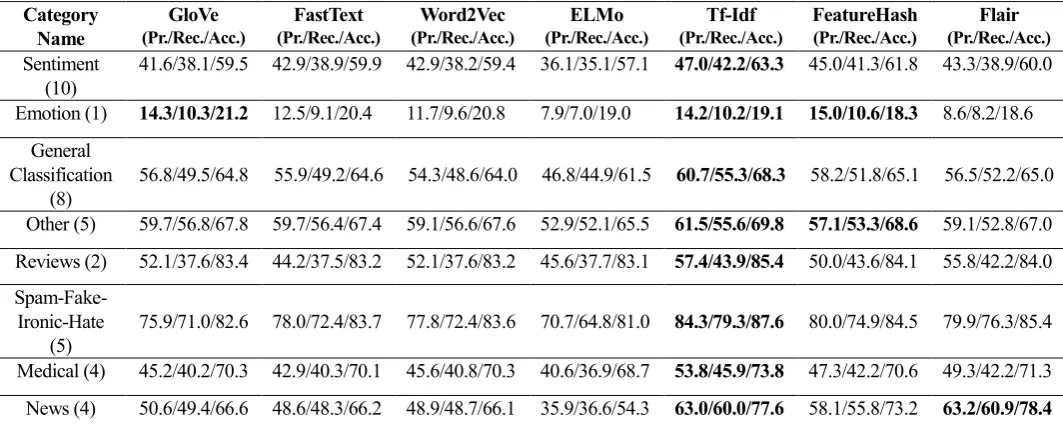
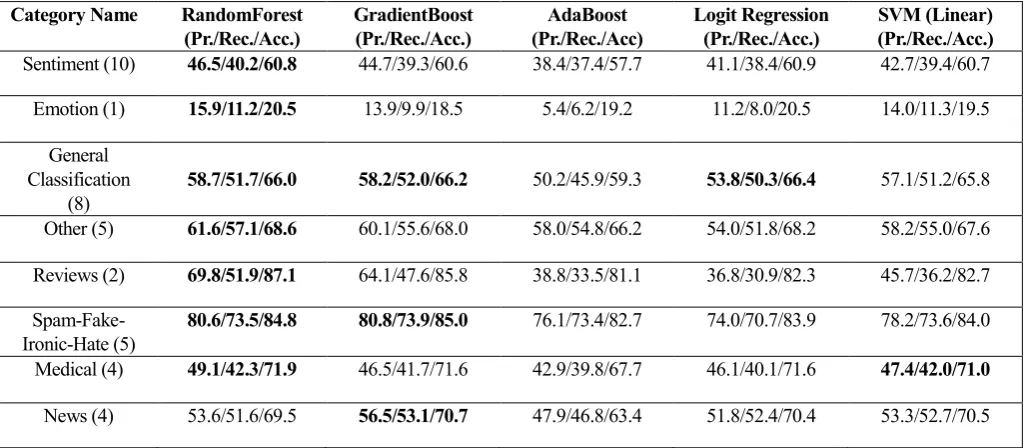
We have carried out basic pre-processing of the text data like – case normalization, stopword removal, punctuation and special character removal followed by word tokenization, though it will be interesting to see the effects of more sophisticated pre-processing like lemmatization on the results. The hyperparameter settings of all the classifiers have been set to default values as used in the scikit-learn library except for number of trees in the Random Forest model which has been set to 51. Figures 2 and 3 provide a global view of the macro f1 score of the vectorizers and classifiers averaged across all the datasets. For a given vectorizer we have calculated the mean performance metric (precision, recall, accuracy) across all classifiers and datasets. As can be inferred from figure 2, tf-idf and feature hashing consistently outperform their heavy weight neural counterparts, among the neural vectorizers flair embeddings demonstrate competitive performance on almost all datasets. The violin plots shown in figures 4 and 5 elucidate the performance of the classifiers and vectorizers (based on accuracy) under the same conditions as figures 2 and 3. We can observe the same trends in these figures as we have previously seen in figures 2, 3. With respect to classifiers, Random Forests, Gradient Boost and Logistic Regression are always among the top performing trio. Apart from this, we have also seen that our results* conform to widely established
trends like the negative correlation between the increase in number of classes and classifier performance metrics, we will expand upon this more in the section on analyzing performance metrics based on class imbalance.
4.1 For Size Less Than 10K
Tables 2 and 5, illustrate the performance of vectorizers and classifiers for all datasets whose size is less than 10K. The results have been grouped on a per category basis, in the category column the number inside the brackets denotes the number of datasets which fall into that category for the given dataset size range. The mean values of Precision Recall and Accuracy have been juxtaposed by following the notation Pr./Rec./Acc. We notice a wide variance in the performance metrics across the categories especially for reviews and emotion. The reason for this is that the emotion category has a dataset which has 18 classes while only containing 2524 samples, same is the case for reviews which has a dataset containing 41 classes. It is this small sample size and sparse data problem which reflects in the suboptimal performance of the vectorizers and classifiers. The number of class labels for all the other datasets in this size range lies between 2-5. Again, we observe that, tf-idf and feature hash come out on top consistently beating the neural counterparts (except for Flair) by a margin of 10% (in terms of accuracy). On the classifier front again Random Forests, Gradient Boost and Logistic Regression edge out SVMs and AdaBoost. In context of the vectorizers we would like to make a case for feature hashing, extolling its many virtues which include – low computational footprint, the absence of a fixed vocabulary, theoretical error bounds and competitive performance, which serve to make it an ideal candidate for establishing strong baselines.
Figure 2: Vectorizer f1-score
(global) Figure 3: Classifier f1-score (global) Figure 4: Classifier accuracy (global) Figure 5: Vectorizer accuracy (global)
* All result files can be accessed from -
192 Category
Name (Pr./Rec./Acc.)GloVe (Pr./Rec./Acc.)FastText (Pr./Rec./Acc.)Word2Vec (Pr./Rec./Acc.)ELMo (Pr./Rec./Acc.)Tf-Idf FeatureHash (Pr./Rec./Acc.) (Pr./Rec./Acc.)Flair Sentiment
(10) 41.6/38.1/59.5 42.9/38.9/59.9 42.9/38.2/59.4 36.1/35.1/57.1 47.0/42.2/63.3 45.0/41.3/61.8 43.3/38.9/60.0 Emotion (1) 14.3/10.3/21.2 12.5/9.1/20.4 11.7/9.6/20.8 7.9/7.0/19.0 14.2/10.2/19.1 15.0/10.6/18.3 8.6/8.2/18.6
General Classification
(8) 56.8/49.5/64.8 55.9/49.2/64.6 54.3/48.6/64.0 46.8/44.9/61.5 60.7/55.3/68.3 58.2/51.8/65.1 56.5/52.2/65.0 Other (5) 59.7/56.8/67.8 59.7/56.4/67.4 59.1/56.6/67.6 52.9/52.1/65.5 61.5/55.6/69.8 57.1/53.3/68.6 59.1/52.8/67.0 Reviews (2) 52.1/37.6/83.4 44.2/37.5/83.2 52.1/37.6/83.2 45.6/37.7/83.1 57.4/43.9/85.4 50.0/43.6/84.1 55.8/42.2/84.0
Spam-Fake-Ironic-Hate
(5) 75.9/71.0/82.6 78.0/72.4/83.7 77.8/72.4/83.6 70.7/64.8/81.0 84.3/79.3/87.6 80.0/74.9/84.5 79.9/76.3/85.4 Medical (4) 45.2/40.2/70.3 42.9/40.3/70.1 45.6/40.8/70.3 40.6/36.9/68.7 53.8/45.9/73.8 47.3/42.2/70.6 49.3/42.2/71.3 News (4) 50.6/49.4/66.6 48.6/48.3/66.2 48.9/48.7/66.1 35.9/36.6/54.3 63.0/60.0/77.6 58.1/55.8/73.2 63.2/60.9/78.4
Category
Name (Pr./Rec./Acc.) GloVe (Pr./Rec./Acc.) FastText (Pr./Rec./Acc.) Word2Vec (Pr./Rec./Acc.) ELMo (Pr./Rec./Acc.) Tf-Idf FeatureHash (Pr./Rec./Acc.) (Pr./Rec./Acc.) Flair Sentiment (4) 54.5/45.5/60.8 55.8/46.7/61.7 55.5/46.4/61.5 52.9/42.2/59.2 64.0/57.0/68.6 60.1/52.7/65.2 57.6/49.9/63.0 Emotion (1) 14.9/11.9/27.5 13.9/12.4/28.3 14.2/12.3/28.0 13.7/10.7/25.7 23.1/16.0/31.5 15.8/13.8/28.4 14.8/12.6/28.6
General Classification
(6) 47.4/41.9/58.9 48.5/43.1/59.9 48.8/42.9/59.6 41.8/37.6/54.7 60.4/56.7/68.5 57.4/52.0/65.1 52.3/46.1/63.1 Reviews (1) 35.9/24.3/56.6 33.9/24.3/56.6 34.7/24.4/56.6 30.9/23.1/54.9 44.1/33.2/60.9 43.4/29.6/58.7 36.1/25.2/55.4
Spam-Fake-
Ironic-Hate(4) 61.4/51.8/76.7 63.4/53.2/77.6 63.5/53.0/77.4 58.5/47.4/74.8 61.5/54.5/79.0 60.7/51.4/76.9 67.0/54.2/78.3 News (1) 15.9/9.2/50.5 15.7/9.0/49.8 16.2/9.5/51.7 14.8/9.0/46.6 37.1/29.3/75.4 44.9/36.7/74.6 23.3/16.7/59.2
Category
Name (Pr./Rec./Acc.) GloVe (Pr./Rec./Acc.) FastText (Pr./Rec./Acc.) Word2Vec (Pr./Rec./Acc.) ELMo (Pr./Rec./Acc.) Tf-Idf FeatureHash (Pr./Rec./Acc.) (Pr./Rec./Acc.) Flair Sentiment (2) 58.5/52.0/61.7 57.3/50.7/62.2 55.6/50.5/61.9 54.0/46.1/56.6 56.0/48.6/59.3 54.6/49.2/59.3 64.1/55.2/62.0
General Classification
(3) 34.5/29.3/45.4 34.9/30.6/45.6 34.1/29.0/44.3 29.0/26.7/42.6 34.6/31.7/46.0 35.1/29.7/44.9 34.4/29.8/44.5 Other (2) 53.7/48.2/59.6 55.2/49.2/60.5 54.9/49.2/60.5 48.3/46.7/57.8 48.3/44.4/54.0 49.7/46.9/55.9 54.3/47.2/57.6 Reviews (4) 33.7/22.0/44.0 37.0/25.0/48.1 34.8/24.2/45.8 30.6/21.8/46.1 38.0/28.4/54.0 38.5/28.4/54.3 37.2/27.4/52.2
Spam-Fake-
Ironic-Hate(1) 89.2/63.4/92.5 90.5/65.9/93.0 90.8/64.8/92.5 76.1/55.2/91.3 82.1/62.6/92.3 80.9/58.4/90.3 83.0/63.5/91.7 Medical (2) 64.4/61.7/68.5 64.5/62.0/69.7 62.0/59.9/69.5 60.9/56.8/65.0 67.3/65.5/70.1 64.7/62.9/70.2 65.4/63.6/68.5
News (3) 40.0/35.3/42.8 42.2/38.1/44.4 42.1/38.2/45.3 36.8/29.3/34.0 42.4/40.7/47.7 42.0/39.4/46.1 41.7/37.7/47.6
Table 2. Mean Performance Metrics on a category basis for all Vectorizers (dataset size less than 10K)
Table 3. Mean Performance Metrics on a category basis for all Vectorizers (dataset size between 10K and 50K)
193 Category Name RandomForest
(Pr./Rec./Acc.) GradientBoost (Pr./Rec./Acc.) (Pr./Rec./Acc) AdaBoost Logit Regression (Pr./Rec./Acc.) SVM (Linear) (Pr./Rec./Acc.)
Sentiment (10) 46.5/40.2/60.8 44.7/39.3/60.6 38.4/37.4/57.7 41.1/38.4/60.9 42.7/39.4/60.7
Emotion (1) 15.9/11.2/20.5 13.9/9.9/18.5 5.4/6.2/19.2 11.2/8.0/20.5 14.0/11.3/19.5
General Classification
(8) 58.7/51.7/66.0 58.2/52.0/66.2 50.2/45.9/59.3 53.8/50.3/66.4 57.1/51.2/65.8 Other (5) 61.6/57.1/68.6 60.1/55.6/68.0 58.0/54.8/66.2 54.0/51.8/68.2 58.2/55.0/67.6
Reviews (2) 69.8/51.9/87.1 64.1/47.6/85.8 38.8/33.5/81.1 36.8/30.9/82.3 45.7/36.2/82.7
Spam-Fake-Ironic-Hate (5) 80.6/73.5/84.8 80.8/73.9/85.0 76.1/73.4/82.7 74.0/70.7/83.9 78.2/73.6/84.0 Medical (4) 49.1/42.3/71.9 46.5/41.7/71.6 42.9/39.8/67.7 46.1/40.1/71.6 47.4/42.0/71.0
News (4) 53.6/51.6/69.5 56.5/53.1/70.7 47.9/46.8/63.4 51.8/52.4/70.4 53.3/52.7/70.5
Category Name RandomForest
(Pr./Rec./Acc.) GradientBoost (Pr./Rec./Acc.) (Pr./Rec./Acc)AdaBoost Logit Regression (Pr./Rec./Acc.) SVM (Linear) (Pr./Rec./Acc.)
Sentiment (4) 58.7/48.3/62.8 59.1/47.5/63.0 52.6/46.8/60.5 50.0/46.2/62.1 57.6/48.5/63.1
Emotion (1) 15.5/12.7/27.3 16.9/13.6/29.1 12.9/10.6/24.9 18.1/13.5/29.8 16.4/13.9/30.2
General Classification
(6) 54.9/46.3/61.9 51.6/46.8/62.1 43.8/41.7/56.6 49.9/46.2/62.1 53.0/47.5/63.0 Reviews (1) 39.5/25.8/56.9 36.9/25.7/57.2 35.2/26.8/56.6 35.4/26.7/58.0 38.8/27.4/58.1
Spam-Fake-Ironic-Hate (4) 76.9/60.1/82.9 65.1/52.2/76.6 51.2/48.4/73.9 55.7/48.6/75.8 58.6/50.2/76.2 News (1) 41.5/22.8/64.9 27.5/21.6/59.8 1.7/2.3/41.5 21.6/17.2/60.8 28.1/21.7/63.6
Category Name RandomForest
(Pr./Rec./Acc.) GradientBoost (Pr./Rec./Acc.) (Pr./Rec./Acc)AdaBoost Logit Regression (Pr./Rec./Acc.) (Pr./Rec./Acc.)SVM (Linear)
Sentiment (2) 57.1/52.3/61.4 58.0/46.8/60.1 55.9/44.1/61.2 62.4/62.5/62.4 53.3/47.0/58.8 General
Classification
(3) 41.5/34.2/51.3 39.5/32.8/51.9 38.5/31.4/45.9 37.0/33.5/50.9 23.2/22.2/32.5 Other (2) 55.0/52.0/61.3 53.9/47.4/58.8 48.8/45.2/54.7 46.2/43.7/53.6 48.4/44.4/55.6 Reviews (4) 47.7/30.4/53.0 45.1/27.7/61.4 28.6/22.4/44.1 36.0/27.1/53.2 25.7/20.2/43.3
Spam-Fake-Ironic-Hate (1) 89.7/62.1/92.3 88.8/63.7/92.5 84.0/64.5/92.0 75.6/56.0/90.7 79.1/62.4/91.4 Medical (2) 69.3/67.7/73.8 63.1/61.0/70.0 33.7/36.3/46.7 59.7/57.0/65.4 63.1/59.5/65.5 News (3) 48.8/43.1/50.8 47.8/46.1/52.5 46.2/45.0/51.4 53.3/51.6/55.8 33.0/27.9//34.6
Table 5. Mean Performance Metrics on a category basis for all Classifiers (dataset size less than 10K)
Table 6. Mean Performance Metrics on a category basis for all Classifiers (dataset size between 10K and 50K)
194 Category
Name (Pr./Rec./Acc.)GloVe (Pr./Rec./Acc.)FastText (Pr./Rec./Acc.)Word2Vec (Pr./Rec./Acc.)ELMo (Pr./Rec./Acc.)Tf-Idf FeatureHash (Pr./Rec./Acc.) (Pr./Rec./Acc.)Flair Sentiment (4) 69.0/69.0/69.0 69.7/69.7/69.7 69.4/69.3/69.3 62.1/61.7/61.6 74.9/74.1/74.1 71.7/71.4/71.4 69.0/68.2/68.2
General Classification
(7) 59.4/57.1/65.0 60.5/58.5/66.1 59.6/57.9/65.6 51.4/52.0/60.8 63.4/60.9/67.3 59.2/56.5/63.7 61.2/61.2/67.5 Other (5) 65.1/61.0/71.7 65.5/61.1/71.7 64.8/61.2/71.8 57.6/56.4/69.8 65.2/58.4/71.8 62.2/57.3/71.5 64.1/57.9/72.6
Reviews (1) 80.3/54.8/91.9 64.9/54.2/91.4 79.2/54.3/91.6 69.0/54.5/91.7 82.6/58.1/92.0 73.8/63.1/91.5 84.4/59.5/92.1
Spam-Fake-Ironic-Hate
(8) 75.3/69.1/80.2 76.7/70.7/80.9 76.5/70.4/80.8 69.6/63.2/77.7 80.8/75.0/83.9 76.2/70.8/80.9 77.2/72.8/81.7 Medical (2) 72.2/65.9/84.6 69.1/65.3/87.0 72.5/65.6/86.9 63.4/62.0/85.9 69.4/64.4/83.3 71.1/64.0/85.4 64.5/58.9/93.7
News (3) 64.4/64.1/64.5 62.9/62.6/63.2 63.5/63.3/63.7 43.3/41.6/42.4 80.9/80.1/80.3 71.7/71.5/71.6 83.8/83.6/83.8
Category
Name (Pr./Rec./Acc.)GloVe (Pr./Rec./Acc.)FastText (Pr./Rec./Acc.)Word2Vec (Pr./Rec./Acc.)ELMo (Pr./Rec./Acc.)Tf-Idf FeatureHash (Pr./Rec./Acc.) (Pr./Rec./Acc.)Flair Sentiment (8) 44.8/35.9/58.5 46.9/36.9/59.2 47.2/36.7/58.9 41.5/33.7/58.1 49.7/42.0/62.0 48.5/40.3/60.1 49.4/39.5/60.4
General Classification
(6) 51.1/42.9/60.9 49.6/42.5/60.6 48.0/41.8/60.1 42.4/38.9/57.7 53.9/48.7/65.6 52.2/45.8/62.2 52.8/47.3/63.2 Other (2) 40.0/38.0/50.1 39.5/37.7/49.9 39.6/38.1/50.4 36.0/35.6/47.6 39.9/38.2/50.4 37.0/37.1/49.4 44.3/37.5/50.2
Reviews (2) 36.0/24.2/37.5 36.2/25.9/35.9 37.9/25.7/34.2 29.4/22.2/36.2 35.9/31.6/41.2 37.9/31.7/42.0 36.3/30.2/39.6
Spam-Fake-Ironic-Hate
(1) 62.0/42.6/79.2 61.9/44.6/79.8 63.2/44.1/79.9 63.4/38.5/77.7 70.5/63.8/88.0 67.2/55.0/84.7 67.9/43.4/79.5 Medical (1) 54.2/54.0/57.8 55.8/55.8/55.7 56.4/56.3/56.4 52.7/48.0/52.6 67.7/64.8/65.8 61.7/61.9/62.0 59.5/59.5/59.6 News (2) 38.9/37.0/70.8 36.6/36.4/71.4 36.8/36.5/70.7 32.7/34.3/68.7 43.9/39.1/73.9 42.3/37.8/72.6 43.1/38.7/73.5
Category
Name (Pr./Rec./Acc.) GloVe (Pr./Rec./Acc.)FastText (Pr./Rec./Acc.)Word2Vec (Pr./Rec./Acc.)ELMo (Pr./Rec./Acc.)Tf-Idf FeatureHash (Pr./Rec./Acc.) (Pr./Rec./Acc.)Flair Sentiment (4) 26.5/24.1/54.1 26.1/25.2/54.3 25.0/23.4/53.8 22.6/23.1/52.6 33.8/27.9/59.2 29.6/27.3/58.1 23.8/22.6/54.0
Emotion (2) 14.6/11.1/24.4 13.2/10.7/24.3 13.1/11.0/24.4 10.8/8.9/22.3 18.7/13.1/25.3 15.4/12.3/23.3 12.1/10.5/22.9 General
Classification
(3) 32.4/19.4/52.1 32.8/19.7/51.8 35.9/20.6/53.1 27.8/17.8/50.8 55.7/47.5/67.7 52.6/40.4/63.5 40.7/23.4/53.8 Reviews (4) 30.0/19.3/56.2 29.3/21.0/60.3 27.6/20.8/60.1 24.5/20.3/59.6 36.4/27.8/65.8 33.7/24.7/63.3 31.7/25.0/61.4
Spam-Fake-Ironic-Hate
(1) 47.1/31.7/89.3 53.0/32.5/90.2 52.6/33.4/90.1 41.0/28.0/90.6 32.5/16.5/85.6 41.0/19.8/87.0 58.8/34.9/91.1 Medical (3) 35.6/31.0/64.5 34.2/31.3/65.4 34.6/30.5/65.4 33.4/28.4/62.7 46.5/38.4/68.5 36.8/33.1/63.9 36.6/25.3/66.0 News (3) 15.9/8.4/35.8 15.8/8.3/36.3 15.7/8.4/38.2 14.6/7.0/34.6 25.4/20.1/49.5 30.8/24.2/49.8 25.0/17.0/54.8
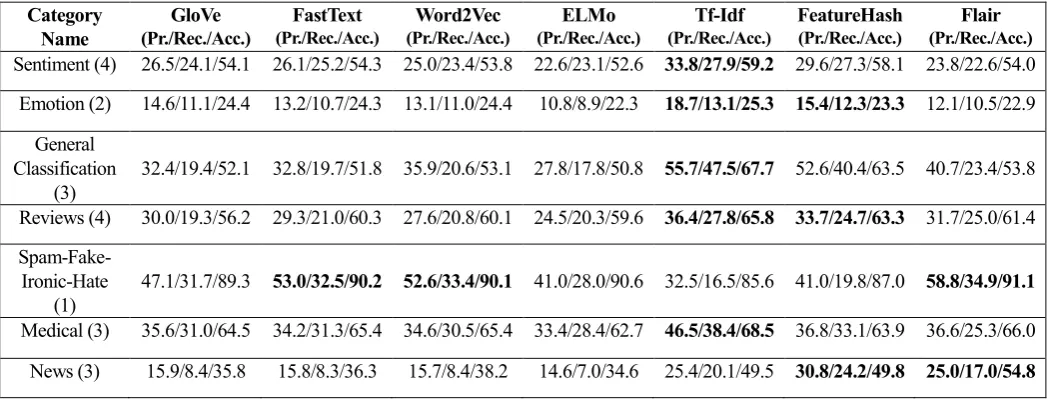
Table 8. Mean Performance Metrics on a category basis for all Vectorizers (for imbalance measure between 0.0 and 1.03)
Table 9. Mean Performance Metrics on a category basis for all Vectorizers (for imbalance measure between 1.03 and 4.46)
197
Austin Appleby. Murmurhash3 64-bit finalizer. Version 19/02/15. https://code. google. com/p/smhasher/wiki/MurmurHash3.
Jeremy Howard and Sebastian Ruder. "Universal Language Model Fine-tuning for Text Classification." In Proceedings of the 56th Annual Meeting of the Association for Computational Linguistics (Volume 1: Long Papers), vol. 1, pp. 328-339. 2018.
Jacob Devlin, Ming-Wei Chang, Kenton Lee, and Kristina Toutanova. "Bert: Pre-training of deep bidirectional transformers for language understanding." arXivpreprint
arXiv:1810.04805 (2018).
Bryan McCann, James Bradbury, Caiming Xiong, and Richard Socher. "Learned in translation: Contextualized word vectors." In Advances in Neural Information Processing Systems, pp. 6294-6305. 2017.