Fit for future
A benchmark based master plan for reducing the logistics
costs of P&G Pet Care
Non-Confidential
This is the non-confidential thesis of the final
internship of Agnes Boonstra. Confidential
information was left out the confidential thesis,
which resulted in this non-confidential thesis.
To simplify the reading, in some cases original
Fit for future
Fit for future
A benchmark based master plan for reducing the logistics
costs of P&G Pet Care
Non-Confidential
Author:
Agnes Boonstra
University of Twente: Dr. P.C. Schuur
Prof. Dr. Ir. M.J.F. Wouters
Management Summary
This thesis constitutes the completion of the studies Industrial Engineering & Management at the University of Twente of Agnes Boonstra. From March till November 2006 she did an internship at Iams, the business unit Pet Care of Procter & Gamble in Coevorden.
Background & objective
@@@
Approach
@@@
Results internal benchmark
@@@
Results external benchmark
@@@
Analysis
@@@
Master plan
@@@
Recommendations
Preface
Here it is! After having had the great opportunity to ‘work’ at Procter & Gamble for several months, I am proud to present my master thesis. This is an important step because this thesis is the completion of my studies Industrial Engineering & Management at the University of Twente in Enschede.
I want to thank Procter & Gamble for the opportunity to introduce me in their professional and inspiring environment. They invested a lot to make my internship to a success. Besides the nice trips I made to among others Geneva (sleeping in the mountains!) especially the involvement of colleagues in my project was very valuable. I had the opportunity to form a team with people who I could consult for questions, a board with people providing good ideas and to contact a lot of other people for questions and discussions. Especially the presentations and discussions I had several times with the team and board were great learning experiences for me. I owe special thanks to Astrid Sonneville-Dings, an inspiring person from whom I learned a lot. I respect her approach and way of managing. I want to thank Sjoerd Ribberink for his day to day coaching. He was always willing to answer my questions, to discuss and to review my work! Finally I thank the board and team and especially Frans Geenen and Ross Nutter for the good discussions I had with them. From University I was supervised by Peter Schuur and Marc Wouters. I thank them for their input during several meetings and discussions! It was good to get valuable input from people from outside the Procter &G amble world.
Last but not least I thank my family and friends for supporting me during the last months. I thank my parents for their endless support and confidence, not only the last months but during my whole study period. Thanks to my friends, some of them were always interested in what and how I was doing. Finally I thank my boyfriend, for his patience and never ending support!
Enjoy reading my thesis!
Content
2.3 Pet Care: Iams worldwide ... 24
2.3.1 Introduction ... 24
2.3.2 History... 25
2.3.3 Purpose... 25
2.3.4 Products... 25
2.4 Pet Care: Iams Europe, Middle-East and Africa... 25
2.4.1 Introduction ... 25
2.4.2 Product Market Combinations Pet Care EMEA ... 25
2.4.3 Pet Care EMEA: Iams Coevorden... 26
2.4.4 Strategy of Pet Care Product Supply ... 26
2.4.5 The Pet Care EMEA supply chain ... 26
2.4.6 Third-Party Logistics ... 26
3.3 Finished Product Logistics Costs ... 27
4 Theory about benchmarking... 29
4.1 Introduction... 29
4.2 History of benchmarking... 29
4.3 Definition of benchmarking... 29
4.4 Reasons for benchmarking ... 31
4.5 Relationship between benchmarking and performance improvement ... 31
4.6 Different types of benchmarks ... 32
4.7 Keys to successful benchmarking and pitfalls for benchmarking... 34
4.8 The process of benchmarking... 34
4.9 Logistics benchmarking ... 37
4.10 Benchmarking: the ultimate way?... 38
4.11 Summary and conclusion ... 39
5 Internal benchmark... 41
5.1 Introduction... 41
5.2 Objective of the benchmark ... 41
5.3 Subject of the benchmark... 41
5.4 Benchmarkees... 42
5.5 Research methodology data collection internal benchmark... 43
5.6 Data collection and analysis ... 44
5.6.1 Introduction ... 44
5.6.2 Global Analysis on FPLC ... 44
5.6.3 Questionnaire and more data ... 44
5.7 Gap analysis... 45
5.8 Conclusion data collection and analysis... 45
5.9 Best practices and applicability ... 45
5.10 Summary and conclusion ... 45
6 External benchmark ... 47
6.1 Introduction and objective of the benchmark... 47
6.2 The pet food market ... 47
6.3 Subject of the benchmark... 47
6.4 Benchmarkees... 48
6.5 Research methodology data collection external benchmark ... 48
6.6 Data collection and analysis ... 49
6.7 Netherlands ... 50
6.8 Best practices and applicability ... 50
6.9 In-depth comparison between @@@ and P&G Pet Care ... 50
7 Best practices for the master plan... 51
7.1 Introduction... 51
7.2 @@@ ... 51
7.2.1 Introduction and description ... 51
7.2.2 Methodology and assumptions ... 51
7.2.3 Expected savings... 51
7.2.4 Conclusion and recommendations ... 51
7.3 @@@ ... 51
7.3.1 Introduction and description ... 51
7.3.2 Methodology and assumptions ... 51
7.3.3 Expected savings... 51
7.3.4 Conclusion and recommendations ... 51
7.4 @@@ ... 51
7.4.1 Introduction and description ... 51
7.4.2 Methodology and assumptions ... 51
7.4.3 Conclusion and recommendations ... 51
7.5 @@@ ... 52
7.5.1 Introduction and description ... 52
7.5.2 Methodology and assumptions ... 52
7.5.3 Why @@@ is not (yet) an option ... 52
7.5.4 Expected savings... 52
7.5.5 Conclusion and recommendations ... 52
7.6 Best practices not expressible in money... 52
7.7 Summary and conclusion ... 52
8 Master plan and recommendations ... 53
8.1 Introduction... 53
8.2 Current identified savings FY 06/07... 53
8.3 Current identified savings FY 07/08 and FY 08/09 ... 53
8.4 Savings best practices... 53
8.5 Master plan ... 53
8.6 Reflection and recommendations... 53
8.7 Summary and conclusion ... 53
9 Conclusion ... 55
9.1 Introduction... 55
9.2 Answers on the research questions... 55
Acronyms... 57
Introduction
This thesis is the closing report for our studies Industrial Engineering & Management at the University of Twente in Enschede. The thesis is based on an internship we did at Procter & Gamble from March till November 2006. We were located in Coevorden at the business unit Pet Care called Pet Care or Iams Europe, Middle-East and Africa (EMEA). P&G Pet Care EMEA is operating in a highly competitive environment. Sales have stagnated over the past two years. @@@. Objective of the internship was to define a plan for how the logistics costs of Pet Care can be reduced in three years. In order to generate input for this master plan we performed two benchmark studies. In an internal benchmark we compared the logistics costs of Pet Care with those of other business units and we investigated best practices for reducing those logistics costs of finished products. In an external benchmark we investigated what competition is doing in order to minimize logistics costs.
In several chapters we describe the steps towards the plan for reducing logistics costs. Chapter 1 starts with a description of the approach of the internship. In Chapter 2 we describe P&G and more specifically the business unit Pet Care. Chapter 3 describes the logistics costs which are within P&G called Finished Product Logistics Costs. In Chapter 4 a theoretical background of benchmarking is presented. Chapter 5 and 6 describe respectively the internal and external benchmark. In Chapter 7 the collected best practices are worked out in more detail. This results in Chapter 8 in a master plan. In Chapter 9 we reflect on the research questions.
1
Project description
1.1 Introduction
In this chapter we describe the approach of our internship at Procter & Gamble (P&G) in Coevorden. This internship is the final phase of our studies Industrial Engineering & Management at the University of Twente. In Coevorden the plant for the business unit Pet Care of P&G is located. In the plant around @@@ % of dog and cat food volume for the region Europe, Middle-East & Africa (EMEA) is produced. The business unit Pet Care for this region is called Pet Care EMEA or Iams EMEA.
1.2 Background
Pet Care EMEA is operating in a highly competitive environment. @@@
1.3 Objective
Given previous information, the objective of the research had been stated as follows:
Develop a three-year target, glide path and master plan for reducing the Finished Product Logistics Costs of the division Pet Care Europe, Middle-East & Africa of Procter & Gamble
A target should be set for the Finished Product Logistics Costs (FPLC) to be achieved the next three years. In the master plan it should be defined how this target can be achieved in time. All these steps together would form the glide path which has to be followed to reach the three-year target. In the master plan we would do recommendations for improving the logistics processes that influence FPLC.
1.4 Scope
The research focused on reduction of FPLC of Pet Care EMEA. The elements of the master plan should relate to the cost elements and cost influencers of FPLC and logistics processes that impact FPLC. Already planned reductions of FPLC could be taken into account. @@@. These expected savings could be taken into account in our master plan. The master plan runs from Fiscal Year 06/07 till Fiscal Year 08/09.
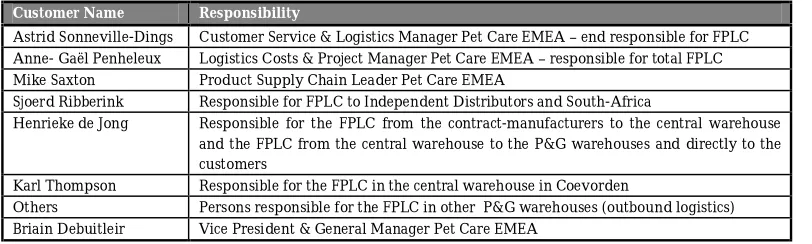
1.5 Customers
Table 1.1 Customers research project
1.6 Research approach
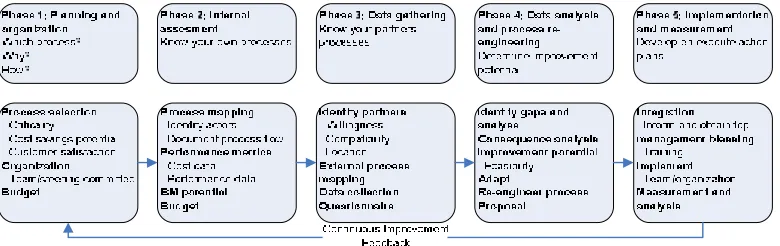
In this paragraph we describe the research model and related research questions. In Figure 1.1 we present a schematic reflection of the steps that had to be taken to reach the objective [Verschuren en Doorewaard, 2003]. The objective (master plan) can be found in the rightmost part of the figure. Object of research were the FPLC of Pet Care. In order to get input for this master plan, target and glide path, we performed benchmarks. This was done by comparing the FPLC and related processes of Pet Care with those of other divisions or Global Business Units (GBU) and those of competitors. Before this respectively internal and external benchmark could be done, we studied the background of FPLC in general, the FPLC of Pet Care and the current projects that are being executed on FPLC in Pet Care. Also theory about benchmarking and logistics costs needed to be consulted. We divided the different steps of the research in parts, which we describe below. We remark here that our research was limited to the region EMEA. If we speak in the report about the GBU Pet Care, we mean Pet Care EMEA. The benchmarks were also limited to this region.
Figure 1.1 Research approach
Customer Name Responsibility
Astrid Sonneville-Dings Customer Service & Logistics Manager Pet Care EMEA – end responsible for FPLC Anne- Gaël Penheleux Logistics Costs & Project Manager Pet Care EMEA – responsible for total FPLC Mike Saxton Product Supply Chain Leader Pet Care EMEA
Sjoerd Ribberink Responsible for FPLC to Independent Distributors and South-Africa
Henrieke de Jong Responsible for the FPLC from the contract-manufacturers to the central warehouse and the FPLC from the central warehouse to the P&G warehouses and directly to the customers
Karl Thompson Responsible for the FPLC in the central warehouse in Coevorden
Part 1 FPLC in general
In this part of the research the FPLC in general was studied as well as its cost influencers. Also current FPLC projects and issues in Pet Care needed to be identified. Meanwhile theory needed to be found on benchmarking.
Part 2 Benchmark
The benchmarks were done to get an idea about how Pet Care EMEA is performing on FPLC and its cost influencers compared to others. For the internal benchmark TOPAS (system where all the transport costs are stored) and the FPLC-information system (where for all Global Business Units the FPLC are tracked) were a starting point. A questionnaire was performed as well as interviews with the FPLC budget-owners and FPLC finance people located in Brussels. For the external benchmark we collected data about things that influence FPLC (@@@) by visiting customers and searching on the internet.
Part 3 Master plan
We translated the data collected from the benchmarks in best practices which could be applicable to the situation of Pet Care. After that we investigated what the savings would be if these best practices are applied on the situation of Pet Care. These savings were combined with already planned savings. From here a master plan, target and steps to be taken within three year to decrease FPLC were formed.
1.7 Research questions
Part 1 FPLC in general
1. How are the logistics processes of Pet Care organized? 2. What are Finished Product Logistics Costs?
2.1. What are the elements of FPLC? 2.2. What are the cost influencers of FPLC?
2.3. What are the characteristics of FPLC for Pet Care?
2.4. What are the main cost influencers of the FPLC of Pet Care? 3. What projects are currently being worked on to reduce FPLC of Pet Care? 4. Which theory can be used to perform the internal and external benchmark?
Part 2 Benchmark on FPLC
5. How do Pet Care’s FPLC and its cost influencers score in comparison with 5.1. Other Global Business Units?
5.1.1. Which GBUs are realistic to take?
5.1.2. On which elements and cost influencers will be benchmarked? 5.1.3. How do GBUs differ in elements of FPLC?
5.1.4. How do the GBUs differ in cost influencers of FPLC? 5.1.5. What are the reasons for these differences?
5.1.6. What best practices for reducing FPLC can be applied by Pet Care?
5.2. Competitors?
5.2.1. Which competitors are realistic to take?
5.2.2. On which elements and cost influencers will be benchmarked? 5.2.3. How do competitors differ in elements of FPLC?
5.2.4. How do the competitors differ in cost influencers of FPLC? 5.2.5. What are the reasons for these differences?
5.2.6. What best practices for reducing FPCL can be applied by Pet Care?
Part 3 Master plan
6. Given the information gathered in preceding steps in the research, how can the best practices be translated into savings for Pet Care?
6.1. Are the best practices really applicable to the situation of Pet Care? 6.2. What are the related savings?
7. How can the savings be realized and combined with already identified savings? 7.1. Which step results in which saving?
7.2. In which order do the steps need to be taken?
7.3. Which already identified savings can be taken into account in the master plan and in which order?
7.4. What will be main barriers to take this step, what are threats which will impede the results?
8. What is the three-year end target based on the answers on preceding questions? 9. What recommendations for the future can be done?
Approach for the research questions
did a literature review to answer question 4. For research question 5.1 we used data from the FPLC-system as input. Besides, we sent a questionnaire to persons responsible for FPLC in the different GBUs and we held several interviews. For getting an answer on question 5.2 we visited some customers and used information from the internet and from P&G. For the last research questions we collected input from internal stakeholders from Pet Care. In Table 1.2 we present an overview of which questions are answered in which chapter.
Research Question Chapter
1. How are the logistics processes of Pet Care organized? Chapter 2
2. What are Finished Product Logistics Costs (FPLC)? Chapter 3
3. What projects are currently being worked on to reduce FPLC of Pet Care? Chapter 3 4. Which theory can be used to perform the internal and external benchmark? Chapter 4 5. 1) How do Pet Care’s FPLC and its cost influencers score in comparison with other GBUs?
2) How do Pet Care’s FPLC and its cost influencers score in comparison with competitors? Chapter 5 Chapter 6 6. Given the information gathered in the preceding steps in the research, how can the best
practices be translated into savings for Pet Care?
Chapter 7
7. How can the savings be realized and combined with already identified savings? Chapter 8 8. What is the three-year end target based on the answers on preceding questions? Chapter 8
9. What recommendations for the future can be done? Chapter 9
Table 1.2 Research questions and the chapters in which they are described
1.8 Summary and conclusion
2
Company description
2.1 Introduction
In this chapter we describe the company Procter & Gamble (P&G). First we describe P&G in general, next the division Pet Care and after that Pet Care Europe, Africa & Middle-East. In this way we answer research question 1: How are the logistics processes of Pet Care organized? We end the chapter with the definition of some terms which we use throughout the report.
2.2 Procter & Gamble
2.2.1 History
P&G was founded in 1837 by William Procter, a candle maker from England and James Gamble, a soap maker from Ireland. Procter and Gamble emigrated to Cincinnati in the USA and created what is now one of the leading manufacturers of consumer goods. In 1930 operations started in Europe. In 1957 the first P&G brand was sold in The Netherlands: Dreft. In 1964 the P&G Benelux office was opened in Rotterdam. The company Iams was acquired in 1999. This company produced two brands: Iams and Eukanuba. These brands are today produced in the P&G’s GBU Pet Care. Latest acquisition has been in 2005, when P&G acquired Gillette. Today P&G employs worldwide almost 140,000 people in over 80 countries.
2.2.2 Purpose
The purpose of P&G is stated as follows: ‘We will provide branded products and services of superior quality and value that improve the lives of the world's consumers. As a result, consumers will reward us with leadership sales, profit, and value creation, allowing our people, our shareholders, and the communities in which we live and work to prosper’.
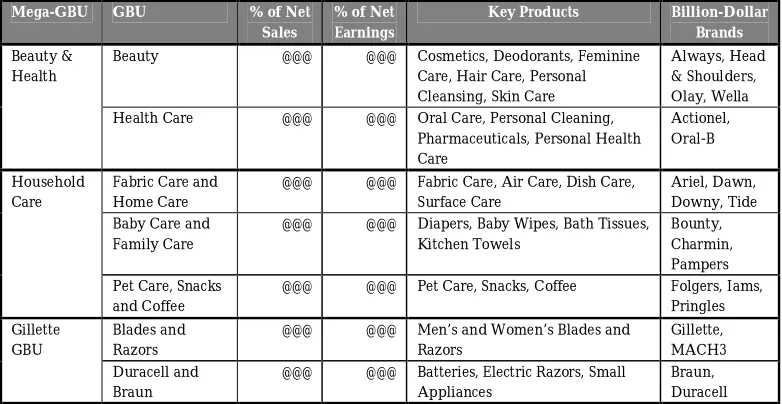
2.2.3 Products
Mega-GBU GBU % of Net
Beauty @@@ @@@ Cosmetics, Deodorants, Feminine Care, Hair Care, Personal
Table 2.1 Mega-GBUs, GBUs, key products and most important brands – Source: Annual Report P&G 2006
The information in the table above is most recent and by the time we did the internal benchmark, the GBUs were divided slightly different. In Chapter 5 we use this older division of GBUs.
2.2.4 Organizational structure
As we mentioned above, three Mega-GBUs cover all the products. The primary responsibility of GBUs is to provide the overall strategy for the brands. Production also happens within the GBU. The Market Development Organization (MDO) is responsible for the go-to-market plans on a local level, it is among others responsible for sales. It is organized along seven geographic regions. Global Business Services is responsible for technology, processes and standard data tools to enable the GBUs
2.3.2 History
Iams was founded in 1946 by Paul Iams, a pet nutrition expert. His aim was to Europe were imported from North-America. Since 1998 products for Europe are for the largest part produced in the new-built plant in Coevorden, The Netherlands.
2.3.3 Purpose
The mission of Iams is to enhance the well being of dogs and cats by providing world-class quality foods and pet care products, that delight the consumer and strengthen the human-pet bond.
Figure 2.2 Iams at a pet’s store Fresnapf in Germany
2.3.4 Products
The business unit Pet Care produces two brands: Eukanuba and Iams. The first brand is a super premium brand especially aimed to be sold in specialty shops and via vets. Iams is a premium brand, also of good quality but also focused on groceries. About 500 different products or stock keeping units (SKUs) are produced and sold. Roughly spoken products differ in brand, species, form, flavor and size (see Table 2.3).
Table 2.3 Product differentiation Pet Care
2.4 Pet Care: Iams Europe, Middle-East and Africa
2.4.1 Introduction
grocery market, groceries are the customers. @@@. In the specialty market there are two different kinds of customers: Independent Distributors (DSRs) and Other Specialty Customers. @@@
2.4.3 Pet Care EMEA: Iams Coevorden
As we mentioned before Pet Care Product Supply is responsible for producing and delivering the goods to the customers. Since in Coevorden products are produced, Iams Coevorden is part of Pet Care Product Supply. In Coevorden about @@@ till in the future @@@ % of all the Iams and Eukanuba products for Pet Care EMEA are produced. @@@. Besides Operations there are Quality, Human Resources, Finance and Maintenance departments. Finally the department Site Logistics is responsible for planning and logistics. Planning is done for the production, raw materials and warehouses of the MDOs. Contact with the central warehouse managed by third party logistics of Penske is also kept from this department. Initiatives for new products and other ways of working are as well coordinated from Site Logistics. As we can see at the upper right part of Appendix 2 a part of Product Supply is falling under the responsibility of Geneva. Among others this is Customer Service & Logistics, which is responsible for taking orders, bringing the products to the customers, billing and making sure that customers pay. The end customer of our project is the Customer Service & Logistics Manager. Part of Customer Service & Logistics is Total Order Management, responsible for contact with the DSRs. Physically we were located in Coevorden at the Total Order Management’s office. In Appendix 2 an organization chart of Iams Coevorden can be found. The production process of producing the pet food is summarized in Figure 2.4.
2.4.4 Strategy of Pet Care Product Supply
@@@
2.4.5 The Pet Care EMEA supply chain
@@@
3
Finished Product Logistics Costs
3.1 Introduction
In this chapter we describe the concept Finished Product Logistics Costs (FPLC) its elements and its cost influencers. In this way we get an answer on research question 2: What are FPLC? Because FPLC are part of Total Delivery Costs, we describe this topic first. The chapter ends with the description of FPLC-characteristics of Pet Care EMEA. Research question 3: What projects are currently being worked on to reduce FPLC of Pet Care is answered.
3.2 Total Delivery Costs
3.3 Finished Product Logistics Costs
Finished Product Logistics Costs are all costs involved to get a finished product from a plant to the customer. FPLC are therefore divided in three categories: Transportation, Warehousing and General Logistics Charges (GLC). @@@
3.4 Influencers of FPLC
@@@
3.5 FPLC of Pet Care EMEA
@@@
3.6 FPLC developments and projects
@@@
3.7 Summary and conclusion
4
Theory about benchmarking
4.1 Introduction
In Chapter 1 we described that we would use the output of two benchmarks as input for the master plan. In this chapter we discuss in more detail theory about benchmarking and answer research question 4: Which theory can be used to perform the internal and external benchmark? This theory has therefore been the guidance for the benchmarks which we performed and which we will describe in the next chapters. We start with the history and definitions of benchmarking. We continue with reasons for benchmarking and the different types of benchmarking. We derive a model from literature we used for our benchmarks and we talk shortly about logistics benchmarking.
4.2 History of benchmarking
The concept benchmarking finds its origin in the land survey, where a benchmark is used as a standard level which serves as a point of reference for all other measurements [Van Vliet, 1998]. Dictionary Van Dale states that a benchmark is ‘a standard against which performance of produced goods is compared’ and ‘a comparison with companies from the same sector’.
In the business the original idea of benchmarking is still the same. One of the key aims is comparing yourself with others. Xerox Corporation was the first company to use benchmarking as a management tool in gaining competitive advantage [Christopher, 1993]. Benchmarking became more important when it was included as a component in the Malcolm Baldrige National Quality Award [Elnathan et al., 1996]. In 1990 the Strategic Planning Institute in Cambridge (Massachusetts) founded the SPI Councel of Benchmarking. Besides, the American Productivity and Quality Center in Houston founded the International Benchmarking Clearinghouse [Elanathan, 1996]. This shows the growing importance of and interest in benchmarking. Also other countries put more focus on benchmarking. In Europe for example benchmarking is a prerequisite for quality certification for the ISO 9000 Standard.
4.3 Definition of benchmarking
Benchmarking is a widely used concept in business and we found a lot of definitions in literature. Below we give some examples:
of any benchmarking process is to set realistic targets that can be achieved through improved process performance’.
• Benchmarking is a systematic process that helps managers to search and monitor the best practices/and or processes [Bagchi, 1996].
• Benchmarking offers a way ‘to set operating norms, make comparisons against perceived ‘better’ ways of doing thing and to set a basis for comparing future performance’ [Rogers, 1995].
• Benchmarking is a process used by companies to target key areas for improvement within their operations so they can increase their productivity, competitiveness and quality [Murray et al., 1997].
• Benchmarking is a process for measuring your performance against best-in-class companies, then using the analysis to meet and surpass the best in class. Two things are important: benchmarking is a well structured process and the strategic use of the analysis. In this way the knowledge from the benchmark can really be used for setting changes in the organization [Pryor, 1993].
• Competitive benchmarking is the continuous measurement of the company’s products, services, processes and practices against the standards of the best competitors and other companies who are recognized as leaders [Van Vliet, 1998, after a definition of Xerox Company].
Also for logistics benchmarking several definitions can be found. In a publication of Crawfield University [1993] Christopher states:
Logistics benchmarking is the systematic comparison of logistics processes & performance between businesses or business units with the aim of determining for one’s own business:
• Scale of improvement possibilities;
• Areas of action to enhance performance;
• Competitive standing.
Van Vliet [1998] simply states that logistics benchmarking is the benchmarking of the logistics processes of an organization. He also states that two important elements of benchmarking are measuring and comparing and improving performance.
Benchmarking is the search for industry best practices that lead to superior performance
4.4 Reasons for benchmarking
Van Vliet [1998] gives four reasons why benchmarking is a useful instrument (after Camp)
• Benchmarking helps in effectively determining firm’s objectives based on external market-requirements;
• Benchmarking helps in better answering on the requirements of the customer;
• Benchmarking helps in acquiring a competitive market position;
• Benchmarking helps in becoming aware of and finding most successful ways of working (best practices).
Elnathan et al. [1996] give the following reasons why companies are doing benchmarks:
• For continuous improvement of internal operations;
• To become more externally competitive;
• For organizational survival.
He states that especially the external orientation of benchmarking is different from other standard setting tools. Besides stated reasons and advantages, benchmarking can also provide motivation and stimulation to the professionals whose creativity is required to perform and implement benchmark findings.
Fernandez et al. [2001] describe among others following benefits of benchmarking:
• It helps to change internal paradigms and ‘see out of the box’ (after Spendolini, 1992);
• It establishes pragmatic goals based on a concerted view of external conditions (after Spendolini, 1992).
4.5 Relationship between benchmarking and performance improvement
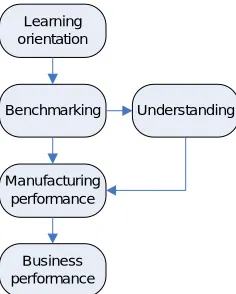
Voss et al. [1997] describe a research about the relationship between the use of benchmarking and the performance of companies. From this research they conclude that if companies have a learning orientation, benchmarking is essential and they stated the following conclusions:
• Benchmarking is a vital part if a company has a learning orientation on performance improvements. Learning organizations will be more likely to use benchmarking;
• Benchmarking is influencing performance directly since it helps a company to identify practices and set challenging performance goals;
Learning
Figure 4.1 Relationship benchmarking and performance – Voss et al.
Voss et al. conclude that that empirical research has shown that benchmarking the right things can really lead to improved performance (see Figure 4.1). This might be an extra reason to start a benchmark.
4.6 Different types of benchmarks
Different types of benchmarks are mentioned in literature, and also different types of classifications of different benchmarks.
A first classification is mentioned by Van der Bij et al. [2004] as well as by Murray et al. [1997]. This classification is based on the relationship with the entities with whom is benchmarked. A benchmark can be an:
• Internal benchmark
• External benchmark
§ Competitive benchmark;
§ Competency benchmark (or co-operative benchmarking, [Bagchi, 1996]).
in your own sector. On the other hand it is not always sure if best practices found will also work in your environment [Murray et al., 1997].
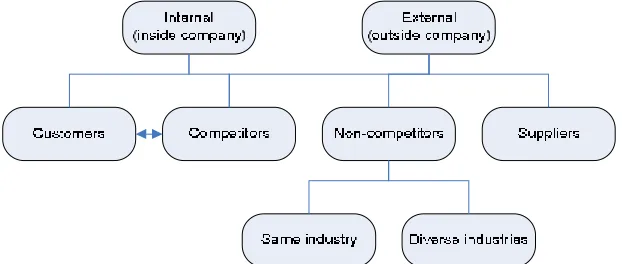
A similar distinction of the differentiation of benchmark is used by Hanman [1997] (see Figure 4.2). If a firm is vertically integrated, internal benchmarking of for example customers is also possible since parties work more closely together. Hanman also states that it is rare to be able to go directly to competitors to ask for information. He suggests therefore to look for example internally to other entities of an organization or to ask customers for information.
Figure 4.2 Different types of benchmarks - Hanman
Another distinction that can be made in different kinds of benchmarking is the level in the organization on which the benchmark can take place [Van der Bij, 2004]:
• Product and process benchmarking: product benchmarking aims at looking at the product. This is also called reverse engineering, products are broken down in order to find out how they are working. This happens for example in the automotive industry. Process benchmarking aims at finding out the way the product or service is created.
• Business benchmarking is aimed at comparing management processes like planning and budgeting. Since these kinds of processes can be similar across different industries, benchmarking with firms outside the sector is also possible.
• Strategic benchmarking is used when a firm wants to positions itself in a different way, for example in the market.
Fernandez et al. [2001] distinct four different kinds of benchmarking: Internal benchmarking, Competitive benchmarking, Functional/Generic benchmarking and Strategic benchmarking. Kyrö [2003] states that performance, processes and strategy can be benchmarked internal, against competitors, functional and generic. This same distinction is made by Luiz et al. [2002]. They claim moreover that alignment between strategic planning and benchmarking projects is an important issue.
Finally Rushton et al. [1989] state that logistics benchmarking can take place on four different levels of management scope:
• Single-task benchmarking where only a part of the logistics processes are studied;
• Function-wide benchmarking where all tasks in a distribution function are reviewed, the aim is there to improve overall performance (e.g. in a depot);
• Management process benchmarking covers broader cross-functional studies like information systems, quality systems and payments systems;
• Total operations (logistics) benchmarking, where the complete logistics chain is considered, from procurement sourcing to end user delivery.
4.7 Keys to successful benchmarking and pitfalls for benchmarking
Pryor et al. [1993] state several requirements for bringing a valuable benchmark result:
• Top management support;
• Appropriate and well-trained personnel;
• Team members who are able to understand and follow the process completely;
• Constant communication across the company;
• Commitment to change;
• Proper improvement targets;
• Carefully detailed action plans.
Pryor states as well that it is difficult to really do something with the results of the benchmarks and to put these results into real improvements and profit benefits. It can happen that a lot of data is collected but the art is to stimulate the management with key insights from this data that action is necessary. He states that the biggest problem for benefiting from benchmarks is that the results are not translated into a detailed actionable plan. Besides this also benchmarks can result in what the best-in-class companies are doing but not how they are doing this, which makes improvement difficult.
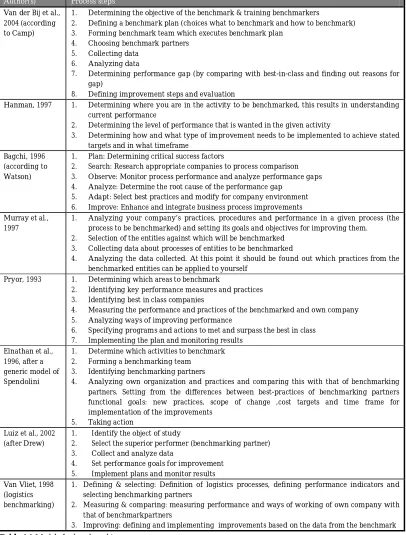
4.8 The process of benchmarking
Author(s) Process steps
Van der Bij et al., 2004 (according to Camp)
1. Determining the objective of the benchmark & training benchmarkers
2. Defining a benchmark plan (choices what to benchmark and how to benchmark) 3. Forming benchmark team which executes benchmark plan
4. Choosing benchmark partners 5. Collecting data
6. Analyzing data
7. Determining performance gap (by comparing with best-in-class and finding out reasons for gap)
8. Defining improvement steps and evaluation
Hanman, 1997 1. Determining where you are in the activity to be benchmarked, this results in understanding current performance
2. Determining the level of performance that is wanted in the given activity
3. Determining how and what type of improvement needs to be implemented to achieve stated targets and in what timeframe
Bagchi, 1996 (according to Watson)
1. Plan: Determining critical success factors
2. Search: Research appropriate companies to process comparison 3. Observe: Monitor process performance and analyze performance gaps 4. Analyze: Determine the root cause of the performance gap
5. Adapt: Select best practices and modify for company environment 6. Improve: Enhance and integrate business process improvements Murray et al.,
1997 1. Analyzing your company’s practices, procedures and performance in a given process (the process to be benchmarked) and setting its goals and objectives for improving them. 2. Selection of the entities against which will be benchmarked
3. Collecting data about processes of entities to be benchmarked
4. Analyzing the data collected. At this point it should be found out which practices from the benchmarked entities can be applied to yourself
Pryor, 1993 1. Determining which areas to benchmark
2. Identifying key performance measures and practices 3. Identifying best in class companies
4. Measuring the performance and practices of the benchmarked and own company 5. Analyzing ways of improving performance
6. Specifying programs and actions to met and surpass the best in class 7. Implementing the plan and monitoring results
Elnathan et al., 1996, after a generic model of Spendolini
1. Determine which activities to benchmark 2. Forming a benchmarking team
3. Identifying benchmarking partners
4. Analyzing own organization and practices and comparing this with that of benchmarking partners. Setting from the differences between best-practices of benchmarking partners functional goals: new practices, scope of change ,cost targets and time frame for implementation of the improvements
5. Taking action Luiz et al., 2002
(after Drew) 1.2. Identify the object of study Select the superior performer (benchmarking partner) 3. Collect and analyze data
4. Set performance goals for improvement 5. Implement plans and monitor results Van Vliet, 1998
(logistics benchmarking)
1. Defining & selecting: Definition of logistics processes, defining performance indicators and selecting benchmarking partners
2. Measuring & comparing: measuring performance and ways of working of own company with that of benchmarkpartners
3. Improving: defining and implementing improvements based on the data from the benchmark
Table 4.1 Models for benchmarking
Figure 4.3 Model for benchmarking - Bagchi
As we can see above a lot of different models are stated in literature with different steps to follow in performing a benchmark. If we look in more detail we see that there is a lot of overlap in the different models and steps. Some authors make more extensive and other authors less extensive descriptions of steps and split steps where others combine them. In our opinion for example the fourth step of Elnathan et al. [1996] is quite big and time consuming compared to the other steps, the same holds for the fourth step of Murray et al. [1997]. Also Hanman [1997] uses very few steps in describing a benchmark. Murray et al. [1997] start with setting goals and objectives for the subject to be benchmarked in the first phase. We would say that this is something what should follow from the benchmark.
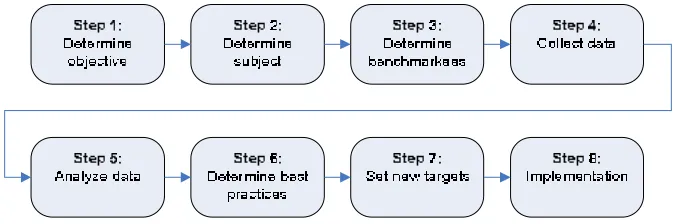
We chose a model which combines the best from all models above especially tailored to our situation. This resulted in the following steps (see Figure 4.4):
1. Determine the objective of the benchmark;
2. Determine the subject of the benchmark and how this will be benchmarked; 3. Determine which will be the entities to be benchmarked (from now on called
benchmarkees);
4. Collect data on the performance of the selected subjects for the benchmarkor (benchmarking company) and the benchmarkees;
5. Analyze the data and if possible the gap between performance of the benchmarkor and the benchmarkees;
6. Determine best practices and the degree to which they can be applied to the benchmarkor;
7. Set new targets for the subject of benchmark of the benchmarkor and define ways to reach this targets;
Figure 4.4 Benchmarking steps
As can be seen, several steps in the benchmark model overlap with the research questions defined in Chapter 1 (question 5):
1. Which benchmarkees (GBUs/competitors) are realistic to take? 2. On which elements and cost influencers will be benchmarked? 3. How do GBUs/competitors differ in elements of FPLC?
4. How do GBUs/competitors differ in cost influencers of FPLC? 5. What are the reasons for these differences?
6. What best practices can be applied by Pet Care?
We used this model for our own benchmarks. The last step however was not performed by us.
4.9 Logistics benchmarking
We make some short remarks about what we have found in literature regarding logistics benchmarking:
• Van Vliet [1998] states that logistics processes are quite broad: procurement, receiving goods, warehousing, logistics handling for production, physical distribution and logistics management processes like inventory management, production planning, procurement planning etcetera. For our benchmark especially the physical distribution part is interesting.
• Logistics performance indicators should include the dimensions time, costs, quality and flexibility [Van Vliet, 1998]. Van Landeghem et al. [2001] use these four concepts also as objectives of measuring. They state that for benchmarking logistics operations the four concepts can be measured according certain metrics or performance indicators. For the costs metrics they propose among others total supply-chain management costs.
• Zeng [2003] states that costs associated with logistics activities contain transportation, warehousing, order processing/customer service/ administration and inventory holding.
planning procedures, control & accounting procedures and organizational structures. Besides benchmarking logistics output and processes also measuring logistics inputs is possible, which can be presented in resources like inventories, time, assets and people.
Most of the theory about logistics benchmarking and measuring performance of logistical operations deal with logistics in the broad sense of the word, like Van Vliet [1998], who states that also logistical control and procurement are included in logistics processes. Theory about benchmarking on logistics costs purely is rare to find. This is explainable, if you want to measure performance, costs are of course not the only indicator which can be measured and also things like time and service are important.
If we look only to benchmarking of costs we see that Zeng [2003] for example sees logistics costs as very broad, inventory holding costs are also in there, which is for FPLC not the case.
However, we can state that we will do a logistics benchmark because our benchmark will also focus on performance of several logistics processes [Christopher (1992) and Van Vliet (1998)].
4.10 Benchmarking: the ultimate way?
A lot of literature is written about benchmarking. From Voss [1997] and some other earlier mentioned scientist we can conclude that benchmarking has positive effects. However, benchmarking is not the only and ultimate key to success. Bagchi [1996] states that benchmarking is most of the time used as a method to catch up with than to surpass competitors. He mentioned here the reactive character of benchmarking. To become and to stay a leader a company must continuously look for ways of improvement. Benchmarking can help here to keep track of changes in the environment but it is not the ultimate
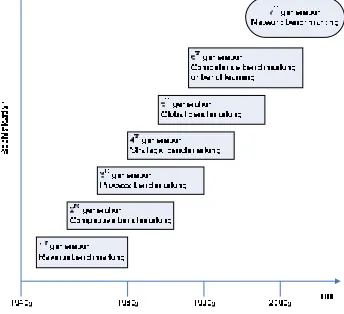
answer on all questions. However, the co-operative benchmarking is already far less reactive than the benchmarking studies from the beginning, like Xerox performed. At Xerox benchmarking has developed in the last years from a quite isolated activity to a strategically instrument. This is also the general trend, benchmarking has started as a more reactive instrument but it can be used as a more proactive tool as well. Kyrö [2003] is even claiming the 7th generation of benchmarking has come (see Figure 4.5).
Overall we think that benchmarking can definitely contribute to an organizations performance, unless the right things are benchmarked and plans for action follow from a benchmark.
4.11 Summary and conclusion
In this chapter answered research question 4. We gave an overview of benchmarking in general and logistics benchmarking specifically. A lot of different definitions for benchmarking have been found in literature, from which we chose the definition: benchmarking is the search for industry best practices that lead to superior performance. According Voss et al. [1997] benchmarking can lead to improved performance. Different types of benchmarks can be performed, of which the distinction between an internal and external benchmark is an example. In literature we found different models for performing a benchmark.
We learned from theory that doing an internal benchmark is probably relatively easy. People are probably willing to share information and used concepts and principles are internally often similar. However, when we do an internal benchmark and compare for example different business units, we have to be aware of the fact that the performance of different business units is not always exactly comparable. Different business units can have different products and markets in where they operate which can result in different performance. We had to keep this in mind when we chose benchmarkees and when we interpret results. Hanman [1997] states that in benchmarking with competition it can be difficult to go directly to customers and ask for information. Therefore going to joint customers is an option. We included this way of collecting data in our external benchmark. Getting insight in logistics costs of competitors would probably be difficult. This stresses even more that we had to focus on collecting best practices of competitors. We had to try to find out what smart things they are doing that probably result in lower logistics costs than Pet Care has.
5
Internal benchmark
5.1 Introduction
To be able to create a master plan for the FPLC of Pet Care it was necessary to thoroughly study current FPLC and to find improvement possibilities for reducing FPLC. As we stated in Chapter 1, we performed both an internal and external benchmark to generate input and ideas for this master plan. To perform the benchmark, we used the benchmarking model from Figure 5.1, which we derived in the previous chapter from literature. In this chapter we describe the approach for and results of the internal benchmark. Steps one up till and included six are described in this chapter, step seven will be described in Chapter 7 and 8, where we also make a short comment on the final step: implementation. At the end of this chapter we have answered research question 5.1: How do Pet Care’s FPLC and cost influencers score in comparison with other GBUs?
Figure 5.1 Benchmarking steps
5.2 Objective of the benchmark
The objective of our benchmark was related to the definition of benchmarking: the search for industry best practices that lead to superior performance. We assumed that superior performance can be reflected in delivering required logistic demands at the lowest possible costs. Therefore we wanted to find best ways of working from the benchmarkees, so what they have done and are doing in order to come to low logistics costs. Objectives of the benchmark were therefore:
• To find out what other GBUs spend on FPLC and its components;
• To investigate best practices from other GBUs which Pet Care can apply in order to reduce FPLC.
5.3 Subject of the benchmark
which we compared the FPLC of Pet Care with those of other GBUs. Each GBU has the same FPLC structure (warehousing, transportation, GLC) and concepts that are used are the same (pallet fit, statistical units etcetera). Doing an internal benchmark would give for each element of FPLC an impression how Pet Care is doing on these FPLC compared to other GBUs. We would be able to find out easily what other GBUs did in order to decrease their FPLC.
A disadvantage of internal benchmarking is that the benchmarkees are operating in different markets and have different products. This can result in differences in FPLC. Therefore we did after the internal benchmark an external benchmark to get an impression about how Pet Care is performing compared to competitors and what we could learn from them.
Subjects of the internal benchmark were all the sub-category cost elements of FPLC like given in Table 3.2, second column. Because data was available in systems at this level of detail, we started with a comparison on this level. The idea was than to work out striking differences in more detail.
5.4 Benchmarkees
In Table 5.1 we present all the GBUs which we could choose as benchmarkees. We remark here that the division of GBUs differs from the one shown in Table 2.1. By the time we did the internal benchmark this division of GBUs was still slightly different. We left Gillette totally out of the comparison. Main reason for this is that Gillette was acquired by P&G last year, and it is not yet integrated enough to be compared to other GBUs. Besides, data of this GBU was not yet available.
Mega-GBU GBU Suitable?
Beauty & Health Oral Care No: product features
Hair Care No: product features and value/m3
Personal Beauty Care No: product features and value/m3
Feminine Care Yes: product features
Household Care Health Care No: value/m3
Baby Care Yes: product features Family Care Yes: product features
Pet Care Object of benchmark
Fabric Care Yes: product features, mature SC Home Care Yes: product features, mature SC
Snacks Yes: 1 central warehouse, similar chain set-up P&G Gillette Gillette No: totally different products, not integrated
within P&G yet
Table 5.1 GBUs and suitability for using in internal benchmark
5.5 Research methodology data collection internal benchmark
In order to perform the internal benchmark we collected data via different ways. In Table 5.2 we present an overview of the different sources we consulted. For each consulted source we can find what the aim of the data collection was, what the result was and how the data collection was realized. Finally we reflect shortly on the way we performed the benchmark.
Brussels Different forms of quantitative
practices More insight in best practices and requirements but estimations of savings
returned to some FPLC-owners to talk in more detail about their realized best practices. The results of the questionnaire including our conclusions were sent to all FPLC-owners.
Successes
We believe that the order of data collection was roughly spoken the right one. First we needed some quantitative data to get into the FPLC topic and see differences between Pet Care and other GBUs. The questionnaire was good to get input about topics other GBUs are currently working on. From these results we found out which striking points we wanted to focus on in more detail. From that point on, we only spoke with FPLC-owners of a selection of most interesting GBUs. In this way we got much more insight in best practices to reduce FPLC. This top-down approach, in where we focused more and more, was therefore valuable.
Constraints
One of the main constraints in data collection we faced is the fact that a lot of data is stored in many different databases at P&G. It happened that one database or pivot table showed information which was conflicting with other data. This could be the case because data was collected on different ways. Sometimes we got the advice to leave out some data because it was not reliable, but this of course distorts total reality. For example the pivot table with pallet heights differed from our own data.
Learnings
From the data collection we learned the following things:
• Approach your source not more than necessary.
• If we look back we would have chosen the help of our resources even more carefully. The other FPLC-owners did not have a direct advantage of our project and therefore we could not approach them more than one or two times.
• Select your source very precisely.
In combination with the previous point, afterwards seen, we would not have posed FPLC-owners all questions. We could have acquired some data via another way (e.g. via a database) and some questions seemed less relevant. Though it is normal that some questions show up to be not relevant, because the direction of your research is not set totally yet when you start a benchmark.
5.7 Gap analysis
@@@
5.8 Conclusion data collection and analysis
From the data collected so far we made a ranking of the different GBUs. Focus was on the following GBUs: Family Care, Baby Care, Feminine Care, Snacks, Fabric and Home Care. In Table 5.8 we present which GBU scored first and second on all the measures and we find the ranking of Pet Care. @@@.
5.9 Best practices and applicability
@@@
5.10 Summary and conclusion
In this chapter we described the internal benchmark we performed on FPLC. The benchmark started with some general FPLC data comparisons, followed by data collection via a questionnaire. @@@. In more detailed interviews we collected best practices of other GBUs regarding these fields. In this way we got an answer on the question: How do Pet Care’s FPLC and its cost influencers score in comparison with other GBUs?
6
External benchmark
6.1 Introduction and objective of the benchmark
In the previous chapters we stated that the advantage of an internal benchmark, compared to an external benchmark, is that the likelihood to easily collect the required data is quite high. Disadvantage is unfortunately that the entities, with whom is benchmarked, are not always comparable because they operate in different markets and have different products. Therefore we also performed a competitive external benchmark. From the external benchmark we wanted to:
• Estimate how much competitors spend on FPLC and what the explanations are for the differences;
• Find out which best practices of competitors P&G can use in order to reduce FPLC.
By doing a benchmark we wanted to get an impression of the FPLC of the competition and ideas for best practices they use which can reduce FPLC. For the external benchmark we also used the model from Figure 6.1. In this chapter we describe steps one until and included six. In this chapter we therefore answer research question 5.2: How do Pet Care’s FPLC and cost influencers score in comparison with competitors? Before we go on with the external benchmark we describe the main competitors of P&G Pet Care.
Figure 6.1 Benchmarking steps
6.2 The pet food market
@@@
6.3 Subject of the benchmark
data from competition and how realistic it would be to gather these data. From here we decided to focus especially on the first three cost influencers of Table 6.3. Those influencers are impacting FPLC a lot and we thought we could collect this data relatively easily.
@@@
In paragraph 6.6 we describe in more detail the data we asked for. Since it was impossible to find out details for all the countries for all competitors we decided to focus our research on several countries and one product. In this case we could get a specific focus and search for specific information about competition. In this way we were able to make a detailed and therefore more reliable estimation of FPLC of competition. @@@.
6.4 Benchmarkees
@@@
6.5 Research methodology data collection external benchmark
In order to perform the external benchmark we collected data via different ways. First we did some data collection via internet and P&G sources to get a global impression about competition. After that we spoke with customers, which was very useful. In Table 6.4 we present an overview of the different sources we consulted, the aim of the consult, the result and the realization of the data collection. After that we discuss our successes, constraints and learnings from the external benchmark.
Source Aim Result Realized
Internet Impression about
competition Strategies, locations, products Surfing on competition’s websites Data currently
available at P&G Impression about competition Products, locations, market shares Consulting team members in Geneva SourceOne:
Competitive Intelligence Articles
Impression about
competition Better impression about strategies, market shares, but not so much logistics information
Surfing in the P&G database
@@@ Customer Getting insight in logistics ways of
Store visits General feeling for
competition in practice Origin of product, expiry dates, impression of bags Together with colleague @@@
Customer Getting insight in logistics ways of working of competition
customers Getting insight in logistics ways of working of competition
Contacts Insight in competition in Germany Verification of data. Difficult to get all information due to no face to face contact
German logistics colleagues verified several data
Success
First the focus was only on Germany. However after a while we realized that collecting data about a country where P&G is acting via a DSR could add value and would give a better total picture on competition. The discussion with the DSR of The Netherlands gave new insights. The decision to visit the Dutch End Customer @@@ (which was not our first intension) was for sure a very good one. This customer receives products from all important competitors and in this way it gave us a complementary view on our collected data so far.
Constraints
• Data verification difficult. Doing a competitive benchmark and asking customers questions about competitors of P&G Pet Care is not easy. We had to be careful in posing questions and sometimes we wanted to verify data and assumptions better (e.g. the results of the interviews of the German contacts). This was not always possible, since we could not approach our customers too many times and put them in a dedicated situation. Therefore our data has not been checked for 100 % and some data are still conflicting.
• Limited sources & robustness of data. We could not approach as many customers as we wanted, since asking questions about competition is, as we mentioned, not easy. We were dependent on the willingness of sales people to go with us to customers and they of course only wanted to go to customers with whom they have a good relationship. So the data is not that robust since we could not ask as many customers as we wanted.
• Limited objectivity. We never know to what extent the data given by customers is totally reliable and objective. Since customers are dependent on P&G Pet Care and other competitors they could give answers which please themselves the most and are the most favorable for them. They might e.g. say that P&G Pet Care is not performing well to challenge P&G Pet Care to become even better, while they think P&G Pet Care is performing quite well.
• Second hand information. As we said before, we were partly dependent of the willingness of other people. In Germany a person spoke with some customers, and the results of the data are coming therefore not directly from a customer but ‘second hand’. This can distort the data.
Learnings
• Approach your source not more than necessary.
• As we said before we had people in Germany collecting data for us. We could have approached them maybe fewer times if we had dosed the questions better.
• Select your source very precisely.
• Afterwards we found out that some data could have been acquired on a different way, we could have tried this maybe more before we went to our source.
6.7 Netherlands
@@@
6.8 Best practices and applicability
@@@
6.9 In-depth comparison between @@@ and P&G Pet Care
@@@
6.10 Summary and conclusion
In this chapter we described the external benchmark we performed. Main objective was to find best practices for reducing logistics costs and to get an insight of FPLC of competitors. Our main focus has been on competitors @@@. By means of visiting customers, talking with them and collecting data via the internet we acquired data about competition in Germany and The Netherlands. We tried to answer the question: How do Pet Care’s FPLC and its cost influencers score in comparison with competitors? We saw that competitors differ in the number of plants they have and they are located, in the way they go to market (direct or via a wholesaler), in whether they use double or single stacked pallets, the inventories they keep etcetera. Altogether this results in differences in FPLC. However, it was impossible to estimate and calculate FPLC for all competitors. Especially @@@’s business model was very striking. Therefore we made a comparison on logistics costs between @@@ and P&G. @@@
7
Best practices for the master plan
7.1 Introduction
@@@
7.2 @@@
7.2.1 Introduction and description
@@@
7.2.2 Methodology and assumptions
@@@
7.2.3 Expected savings
@@@
7.2.4 Conclusion and recommendations
@@@
7.3 @@@
7.3.1 Introduction and description
@@@
7.3.2 Methodology and assumptions
@@@
7.3.3 Expected savings
@@@
7.3.4 Conclusion and recommendations
@@@
7.4 @@@
7.4.1 Introduction and description
@@@
7.4.2 Methodology and assumptions
7.5 @@@
7.5.1 Introduction and description
@@@
7.5.2 Methodology and assumptions
@@@
7.5.3 Why @@@ is not (yet) an option
@@@
7.5.4 Expected savings
@@@
7.5.5 Conclusion and recommendations
@@@
7.6 Best practices not expressible in money
@@@
7.7 Summary and conclusion
8
Master plan and recommendations
8.1 Introduction
@@@
8.2 Current identified savings FY 06/07
@@@
8.3 Current identified savings FY 07/08 and FY 08/09
@@@
8.4 Savings best practices
@@@
8.5 Master plan
@@@
8.6 Reflection and recommendations
@@@
8.7 Summary and conclusion
9
Conclusion
9.1 Introduction
@@@
9.2 Answers on the research questions
Acronyms
In the list below all acronyms used in this report are given, together with a short explanation. The number behind the explanation indicates the chapter and paragraph in where the acronym is used first and/or explained.
• 3PL: Third-Party Logistics: Parties which perform logistics services (2.4.6)
• BPE: Financial term, an adjustment made to the original year budget (Firm) (2.8)
• DC: Distribution Center (2.4.5)
• DOH: Days on hand, the number of days for which there is inventory in the warehouse (5.6.3)
• @@@
• DSR: Independent Distributor, @@@ (2.4.2)
• EMEA: Europe, Middle-East and Africa (1.1)
• Firm: Financial term, original year budget (2.8)
• FPLC: Finished Product Logistics Costs, all the costs involved in transporting products from a plant to the customer (transportation, warehousing, general logistics charges) (1.3 and 3.3)
• FY: Fiscal Year, @@@ (2.8)
• GBU: Global Business Unit, the three Mega-GBUs are subdivided in several Business Units (1.6)
• GLC: General Logistics Charges, part of Finished Product Logistics Costs (3.3)
• GWA: General Warehouse Activities, @@@
• Mega-GBU: Mega-Global Business Unit, P&G has three different GBUS or divisions: Beauty & Health, Household Care and Gillette (2.2.3)
• MDO: Market Development Organization, @@@ (2.2.4)
• NPI: Non-Performing Inventory, @@@ (2.5)
• P&G: Procter & Gamble (1.1)
• PS: Product Supply, Part of a GBU which is responsible for producing and delivering goods to customers (2.2.4)
• @@@
• SKU: Stock Keeping Unit (2.3.4)
• SU: Statistical Unit, this unit is used to easily compare different products with different features with each other. @@@ (2.5)
• TDC: Total Delivery, @@@ (2.4.4 and 3.2)
• TSO: Technical Service Organization, @@@ (7.2.2)