ABSTRACT
AGHDASHI, SEYEDBEHZAD. Traffic Flow Optimization in a Freeway with Stochastic Segments Capacity. (Under the direction of committee Dr. Yahya Fathi and Dr. Nagui M. Rouphail).
In this dissertation, a linear mathematical model is developed to model the traffic flow across
a freeway facility. This mathematical model is capable of addressing the optimization of any
strategy that has some effects on the facility demand or capacity such as ramp metering. In
this research, the mathematical model is configured and used to optimize ramp metering
operations across a freeway facility, which is one of the Active Traffic Demand Management
(ATDM) strategies that is utilized to optimize demand across a freeway facility to avoid
congestion. However, with appropriate changes, the proposed model can optimize other
facility demand or capacity strategies such as hard shoulder running. The model is a
planning-level method for analyzing and determining the time varying metering rates
appropriate to be used and implemented on freeway facilities. The stochastic nature of the
freeway segments capacity has been incorporated in the proposed mathematical model,
which leads to reliability evaluations. The linkage between time and space enables the
proposed mathematical model to account for vehicle travel time on the facility that leads to
adjust the start and end time of the metering operation. Feasibility studies on the proposed
mathematical model lead to evaluation of applicability of ramp metering in the freeway
facilities and estimation of freeway reliability. West bound Highway I-580 in California is
used to implement the optimal ramp metering rates as a case study. The results of the
proposed algorithm are compared to the results of ALINEA, a widely used ramp metering
algorithm in the literature. The comparison of the two approaches indicates that the proposed
method can perform at least as well as ALINEA. Thus, not only the proposed mathematical
model gives optimal ramp metering rates compared to ALINEA, but it also can provide the
© Copyright 2013 by Seyedbehzad Aghdashi
Traffic Flow Optimization in a Freeway with Stochastic Segments Capacity
by
Seyedbehzad Aghdashi
A dissertation submitted to the Graduate Faculty of North Carolina State University
in partial fulfillment of the requirements for the degree of
Doctor of Philosophy
Operations Research
Raleigh, North Carolina
2013
APPROVED BY:
_______________________________ ______________________________
Dr. Yahya Fathi Dr. Nagui M. Rouphail
Co-Chair of Advisory Committee Co-Chair of Advisory Committee
________________________________ ________________________________
DEDICATION
This thesis is dedicated to my Family and Friends who have supported me all the way, and
have been a great source of motivation and inspiration. Finally, this thesis is dedicated to all
BIOGRAPHY
Seyed Behzad Aghdashi received his B.S. and M.S. degrees in Industrial Engineering from
the Sharif University of Technology in 2006 and 2008, respectively.
While studying at North Carolina State University, Behzad has been an active member of
several student associations. He served as the president, vice-president, and secretary of
INFORMS student chapter at North Carolina State University. In 2012 Behzad won the
Elmaghraby distinguished student award for his contributions in the Field of Operations
Research. He is a member of ITE (Institute for Transportation Engineers) and INFORMS.
Currently, Behzad is working as a graduate research assistant at the Institute for
ACKNOWLEDGMENTS
I offer my sincerest gratitude to my advisors Dr. Yahya Fathi and Dr. Nagui M. Rouphail for
their supervision, advice, and their continued support and encouragement. Their invaluable
advice toward becoming a capable professional in my field of study is one of my greatest
assets that will carry throughout my life. I also thank Dr. Russell King, Dr. George List, and
Dr. Bastian Schroeder for participating in my doctoral committee.
Last and most, I express my deepest affection for my parents, Taha and Afsaneh, to whom I
dedicate this work, and for my brother, Farzad, who has always supported me. It has not been
easy living so far away from them. But, their love and unwavering support have made my
TABLE OF CONTENTS
LIST OF TABLES ... vii
LIST OF FIGURES ... viii
1. INTRODUCTION ... 1
1.1. Problem Statement and Motivation ... 1
1.2. Related Works ... 6
1.3. Contributions... 14
1.4. Dissertation Outline ... 15
2. PRELIMINARIES ... 16
1.5. Definitions ... 16
1.6. Non-Linear Behavior of Speed as a Function of Flow Rate ... 21
1.7. Capacity Drop on the Freeway Segments ... 22
1.8. Over-Saturated Modeling ... 23
1.9. Stochastic Nature of Capacity ... 25
3. THE PROPOSED MATHEMATICAL MODEL ... 27
1.10. Simplifications, Assumptions and Justifications: ... 29
1.11. Parameters of the Mathematical Model ... 31
1.12. Linking Time and Space ... 32
1.13. Defining Artificial Segments and Time Steps ... 37
1.14. Relaxation of Non-Linearity between Speed and Flow ... 41
1.15. Modeling Stochasticity of the Segment’s Capacity: ... 42
1.16. The Proposed Mathematical Model ... 45
3.7.1. Objective Function: ... 45
3.7.2. Constraints ... 47
3.7.3. Mathematical Model Formulation ... 51
3.7.4. Feasibility of the Model ... 52
4. CASE STUDY AND NUMERICAL RESULTS: ... 53
4.1. I-580 Case Study ... 53
4.2. Artificial Segmentation and Time Steps ... 56
4.3. The Upper bound on the Probability of Breakdown: ... 61
4.4. Some Insights on Congestion of the I-580 Case Study ... 65
4.5. Model Implementation ... 66
The Optimal Solution and Its Interpretation: ... 68
4.6. Sensitivity Analysis ... 74
4.6.1. Sensitivity to Demand ... 74
4.6.2. Sensitivity to Upper Bound of Breakdown Probability... 76
5. SIMULATION ANALYSIS AND RESULTS ... 78
5.1. Modeling I-580 in HCM 2010 FREEVAL ... 78
5.3. Ramp Metering using ALINEA Algorithm ... 82
5.4. Evaluation of Proposed Model’s Performance ... 87
5.5. Modeling More Congested Freeways and Evaluation of Ramp Metering ... 93
5.6. Sensitivity to Capacity Drop and Demand Increase ... 94
5.7. Increasing the Reliability of Metering Rates: ... 95
5.8. Conversion of Metering Rates into Red/Green Traffic Lights ... 98
LIST OF TABLES
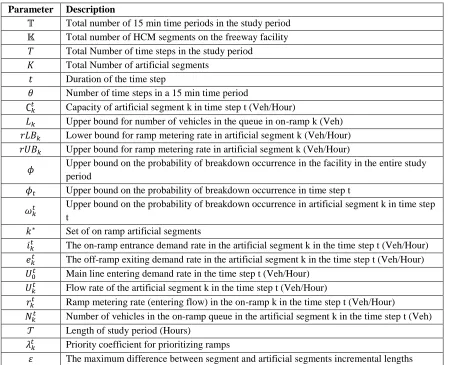
Table 1: Parameters of the Proposed Mathematical Model ... 32
Table 2 - Demand Data for I-580 Case Study (Veh/Hour) ... 56
Table 3: Artificial Segments Proposed for I-580 Case Study ... 59
Table 4: Demand to Capacity Ratio for All Artificial Segments in All Time Periods ... 65
Table 5 – Optimal Solution from Time step 3700 to 3729 ... 69
Table 6 – Aggregated Ramp Metering Rates for I-580 Case Study (Vehicles per Hour) ... 70
Table 7 – Average Number of Vehicles behind Metered On-Ramp (Vehicles) ... 71
Table 8 – Start and End Time Step for Operation of Metered On-Ramps ... 72
Table 9: Demand Sensitivity Analysis ... 75
Table 10: Sensitivity Analysis by Varying Upper Bound of Probability of Breakdown ... 77
Table 11 – FREEVAL Ramp Metering Rates (Vehicles per Hour) ... 81
Table 12 – Metering Rates based on ALINEA algorithm (Vehicles per Hour) ... 86
Table 13 – Probability of Breakdown across I-580 Facility in a 5 Minute Time Interval ... 88
Table 14 – Probability of Breakdown (In a 5 minute time interval) for each HCM Segment and 15 Minute Analysis Period Using Proposed Model’s Ramp Metering Algorithm ... 89
Table 15– Probability of Breakdown (In a 5 minute time interval) for each HCM Segment and 15 Minute Analysis Period Using ALINEA Ramp Metering Algorithm ... 89
Table 16 – Comparison of Performance of Ramp Metering Algorithms ... 91
Table 17 – Queue Length of On-Ramps using Proposed Mathematical Model (feet) ... 92
Table 18 – Queue Length on the On-Ramp Using ALINEA Algorithm (feet) ... 92
Table 19 – Percent Decrease in Average Travel Time ... 94
Table 20 – Ramp Metering Rated and Pattern for different Upper Bound of Probability of Breakdown (Veh/Hour) ... 97
Table 21 – Performance Comparison for Different Reliability Level ... 98
LIST OF FIGURES
Figure 1: Ramp Metering In M6, Birmingham, UK [2] ... 2
Figure 2: Standard Segments based on Highway Capacity Manual (2010)... 18
Figure 3: Speed as a function of flow rate [4] ... 21
Figure 4: Capacity Drop due to congestion ... 23
Figure 5: Flow rate as a function of density ... 24
Figure 6: Scale parameter of the capacity distribution as a function of nominal capacity [31] ... 26
Figure 7: Schematic of a Typical Freeway Facility ... 27
Figure 8: Domain and Scope of Feasibility of the Proposed Mathematical Model ... 29
Figure 9 – Flow of Traffic In Time and Space Domain (Artificial Segments and Time Steps) ... 34
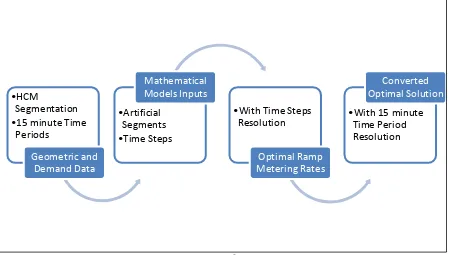
Figure 10 : Data Conversion Process Flow for Using Proposed Mathematical Model ... 36
Figure 11 – Errors Caused by Artificial Segmentation ... 38
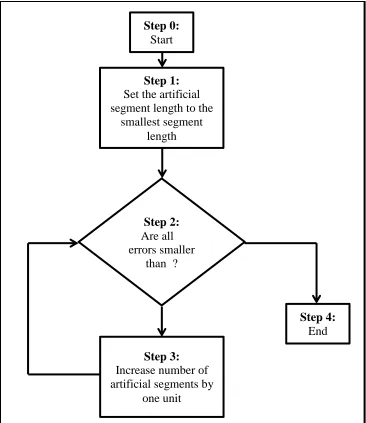
Figure 12 – Process Flow for Generating Artificial Segments ... 40
Figure 13: Two cases of freeway sections under investigation for measuring the reliability [23] ... 42
Figure 14: I-580 Interstate in California [34] ... 54
Figure 15: Geometry and HCM segmentation of I-580 West Bound in California ... 55
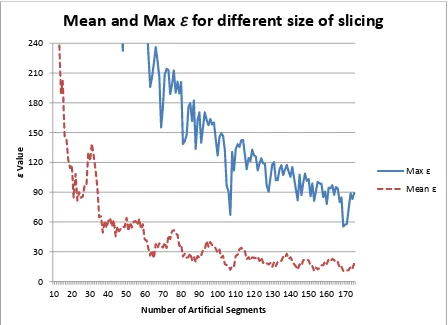
Figure 16 – Mean and Max Value for Different Number of Artificial Segments ... 58
Figure 17 – Relationship between the scale parameter and nominal capacity ... 63
Figure 18: Distribution of Capacity in a Four Lane Freeway Segment ... 64
Figure 19: Metering Rate vs On-Ramp Demand ... 73
Figure 20: Difference between Demand and Metering Rates ... 73
Figure 21: Demand Sensitivity Analysis ... 76
Figure 22: Sensitivity Analysis by Varying Upper Bound of Probability of Congestion ... 77
Figure 23 – HCM Segment 4 Ramp Metering Rates (Veh/Hour) ... 84
Figure 24 – HCM Segment 9 Ramp Metering Rates (Veh/Hour) ... 85
Figure 25 – Probability of Breakdown across I-580 Freeway Facility ... 90
Figure 26 – Percent Decrease in Average Travel Time for Different Demand Levels ... 95
1.
INTRODUCTION
1.1.
Problem Statement and Motivation
Ramp metering is a strategy for regulating entry traffic flow to freeway facilities. A
traffic light is installed at the very end of the merging ramp. The traffic light typically
consists of two lights, red and green. A breakdown can be prevented by metering the entry
traffic from upstream on-ramps. Ramp metering is one of the main tools for Ramp
Management. The Federal Highway Administration (FHWA) defines Ramp Management as
“application of control devices, such as traffic signals, signing, and gates to regulate the number of vehicles entering or leaving the freeway, in order to achieve operational objectives” [1]. Ramp metering performs best in cases where demand is not significantly higher than the freeway capacity. Specifically, it applies to situations where the ratio of
mainline demand to capacity is slightly higher than 1. In severe congestions however, ramp
metering is not effective in prevention of freeway breakdowns.
Figure 1: Ramp Metering In M6, Birmingham, UK [2]
Ramp metering is proven to be one of the efficient and viable ramp control techniques for
managing freeway operations [3]. In the United States, ramp metering facilities have been in
place since 1960s in Chicago, Detroit, and Los Angeles [3]. By the 1990s more than twenty
metropolitan areas were utilizing ramp metering [3]. Nowadays ramp metering falls under
the umbrella of Advanced Traffic Management Systems (ATMS), and Active Traffic
Demand Management (ATDM). The use of ramp metering allows freeway mainline delays to
migrate to the on-ramps thus allowing traffic flow in the freeway system to operate more
optimally.
The primary goal of this dissertation is to determine optimal ramp metering rates. Ramp
Different ramp metering policies and rates can impact traffic on the freeway mainline thus
resulting in variations in the average travel time.
The challenge of this research is to present an optimal ramp metering policy to optimize a
desired criterion. Various objective criteria have been investigated along with different
dynamics of traffic on freeway facilities. By imposing some simplifications a linear
mathematical model has been developed and utilized to identify the optimal policy.
This dissertation defines and employs necessary inputs in the framework of the Highway
Capacity Manual (HCM) 2010 [4]. Which will enable analysts to use solutions and apply
methods readily in practice. Moreover this leads to the results being implemented in HCM
transportation macro simulation packages such as FREEVAL1 [5]. This research also
proposes methods for accounting and addressing more complex traffic dynamics such as
incorporating time lag between freeway segments along with and the stochastic nature of
segment capacity.
Although the model provided in this dissertation is specifically applicable to determining
optimal ramp metering policies under fixed capacity condition, it also incorporates the
concept of stochastic segment capacity evaluation of the reliability of freeway facilities.
While the main use of the proposed mathematical model is to estimate the optimal ramp
metering policies on the freeway facilities, there are other ATDM strategies such as Hard Shoulder Running, or Dynamic Tolling that could be modeled and optimized using similar
mathematical models. The mathematical model, provided here, is designed in a flexible
framework such that, given minor revisions, they can be formulated and analyzed.
In the context of ramp metering, it is necessary to evaluate and investigate the appropriate
objective functions for the defined problems. Minimizing system delay, including delays on
the mainline and on-ramps, is an appropriate objective function. Minimizing system delay is
equivalent to minimizing total travel time in the system.
Total travel time is another viable candidate to be considered as an objective function. In
ramp-metered freeway facilities, a mathematical approach can be utilized to model waiting
times behind the traffic signal on the on-ramps. This model can then perform simulations
with the objective of minimizing system delay comprising of mainline and on-ramp delays.
The delays could be weighted by the number of vehicles traveling on different paths on the
freeway facilities.
Moreover, traffic breakdown has a significant impact on the mainline delay which this
objective function addresses. Due to complex dynamics of the traffic on a freeway facility
(such as oversaturated flow conditions), this objective function might not be possible to
model. Thus, beside the mentioned objective functions that are ideal for the purpose of
optimizing ramp metering, other objective functions could be employed for generating more
simplified models.
Predefined coefficients could be employed for ramp metering rates to specify a weighted
average of ramp flows [6] [7]. Then, high priority ramps will have higher weights in the
mathematical model. Another objective function could be the minimization of total ramp
queue lengths in the study period.
Minimization of the breakdown probability across the facility could also be considered as
objective function. This objective function will result in a Non-Linear model. It could be
used simultaneously along with one of the discussed objective functions resulting in multi
criteria mathematical optimization model. An easy way to incorporate two objective
functions could be adding one of them in the constraint set. By changing the right hand side
1.2.
Related Works
The earliest versions of ramp metering algorithms utilize historic traffic data to update
their policies based on the demand variation. These are called “Pre-Timed Ramp Metering Algorithms” [8]. Other algorithms use sensor data to evaluate traffic conditions in specified
segments of freeway facility named “Traffic Responsive Ramp Metering Algorithms” [8].
Some algorithms use their previous output rate to compute the next iteration rate, and are
called ‘Closed Loop Algorithms’. Otherwise they are called ‘Open Loop Algorithms’.
Moreover, some ramp metering algorithms which are focused on a single ramp called
“Local Ramp Metering Algorithms”. They do not consider the traffic conditions on the
other parts of the freeway facility. On the other hand, another set of algorithms consider a
multi-section of a freeway facility, and are “Area-Wide Ramp Metering Algorithms”.
Area-Wide ramp metering algorithms are divided into three main categories which are
‘Cooperative or Incremental’, ‘Bottleneck or Competitive’, and ‘Integral’ [9]. The Cooperative or Incremental algorithms are similar to local algorithms. However, they get
assistance from metering of upstream on-ramps to avoid congestion or breakdown. In other
words the metered on-ramps are cooperating with each other to manage and control the flow
in the desired sections of a freeway which makes them more efficient [10]. On the other hand
Bottleneck or Competitive algorithms focus on local and bottlenecks metering rates. They try
to maintain the flow below the capacity of the bottleneck. Eventually the more restrictive
on-ramp queue up behind the metering signal. The third class of coordinated ramp metering
algorithms is integral algorithms which optimizes a well-defined objective function. These
algorithms are more theoretical and complex to calibrate and operate [11].
Demand-Capacity Algorithm:
Demand-Capacity is an open loop local traffic responsive ramp metering algorithm [12].
It measures the occupancy in the downstream section of an on-ramp and if it is higher than a
critical occupancy, then it tries to set the ramp metering rate to a predefined minimum
metering rate value. Otherwise, this algorithm sets the metering rate to be the difference
between the downstream capacity and upstream occupancy. A modified version of this
algorithm was developed [12] to avoid using the capacity calculations, which is called
“Percent-Occupancy Algorithm”.
Simplicity of this algorithm limits its usage to be only on one on-ramp, and it cannot
benefit from the multi on-ramp metering advantage in cases where breakdown is not possible
to be avoided by one on-ramp. This algorithm does not account for on-ramp queue up behind
the metering signal.
These algorithms use occupancy as its measure for ramp metering rate control, which is
tight to use of sensors on the freeway facility. Thus, it cannot be used in planning level
Asservissement Linéaire d’Entrée Autoroutière (ALINEA)
The most widely used closed-loop local ramp metering algorithm is known as ALINEA
[13] introduced by Papageorgiou in 1991. A linear feedback law is used to calculate the ramp
metering rate. The following equation demonstrates the law used by this algorithm to
compute the metering rates.
( ) ( ) ( ( ))
Where ( ) is the metering rate in iteration k. is the target occupancy, and is the
measured occupancy at a certain point downstream of an on-ramp on the freeway facility.
is the regulatory parameter. Since the metering rate is a function of previous metering rate,
ALINEA is a closed-loop algorithm
This algorithm does not account for the congestion in the upstream of the metered
on-ramps, Also the determination of the optimal detector location is difficult. Based on ALINEA
equation, when increases, then ( ( )) decreases, which results in
reduction of metering rate ( ). This algorithm does not account for on-ramp queue up
behind the metering signal. Moreover, since it uses occupancy, there is no chance to use this
Modified ALINEA (MALINEA)
MALINEA is an enhanced version of ALINEA algorithm. Basically it addresses the
disadvantages of the ALINEA algorithm [14]. MALINEA measures the upstream occupancy,
and considers the time-lag between upstream and downstream occupancy of the on-ramp.
Two other versions of ALINEA algorithms are ALINEA, and UP-ALINEA.
FL-ALINEA measures the flow in the downstream section rather than the occupancy.
UP-ALINEA measures the upstream occupancy, and estimates the downstream occupancy.
These algorithms are local, they do not account for entire length of freeway, and they
cannot take advantage of the multi on-ramp metering capacity to avoid breakdown. This
algorithm does not account for on-ramp queue up behind the metering signal.
Although this algorithm is widely used for metering on-ramps, it does not have a flexible
objective to achieve. In cases where ramp metering should be adjusted for certain purposes,
such as prioritizing on-ramps, this algorithm doesn’t provide much flexibility rather than
changing the regulatory factor which adjusts the speed of metering to its desired metering
rates.
METALINE:
METALINE is an integral coordinated algorithm version of ALINEA [15] [16]. The
equation which METALINE uses is a vectored format of the one that ALINEA uses. Thus, it
can account for a set of on-ramps in certain segments of the freeway. The Equation which
( ) ( ) ( ) ( ) ( ) ( )
Where, r = [r1 . . . rm]T is the vector of ‘m’ controllable on-ramp volumes. o = [o1 . . . on]T
is the vector of ‘n’ measured occupancies along the motorway. O = [O1 . . . Om]T is the vector
of ‘m’ measured occupancies, typically measured immediately downstream of the controlled
ramps. Ô = [Ô1 . . . Ôm] is the vector of m corresponding set values. Note that O is a subset of
o. and are called gain matrices.
Based on a research in Paris [15] [13] following conclusion is made: “Coordinated
on-ramp control (METALINE) is superior to local feedback control (ALINEA) in case of
unexpected incidents. Both feedback control strategies lead to roughly the same results under
normal conditions”
This algorithm does not account for time lag between on-ramps, and the bottleneck. Also,
it does not account for ramp’s storage size, where vehicles will queue up behind the on-ramp
metering signal. This algorithm uses occupancy, and is applicable in operational mode rather
than a planning level analysis tool.
Zone Algorithm:
This algorithm was first used in 1970 along I-35 in Minneapolis Minnesota. It controls
the traffic over defined zones of freeway which are between 3 to 6 miles. The upstream of the
first zone is a free flow speed not subject to incident. The downstream of the zone is usually
The basic concept of the algorithm is to balance the volume of traffic entering and
leaving each zone. The equation used in this algorithm is expressed as:
‘A’ represents the upstream mainline, and ‘U’ is the sum of unmetered on-ramps volume.
‘M’ is the sum of metered on-ramps volume, and ‘F’ is the freeway to freeway on-ramp entry
volume. ‘X’ represents the exit ramp volumes, and ‘B’ is downstream bottleneck capacity.
‘S’ is the space available between the zones. Overall use of this algorithm showed
improvement in the freeway traffic operations [17]. This algorithm does not account for time
lag inside the zones, and the ramps capacity limit.
Linear Programming Algorithms:
First linear programming algorithm used for ramp metering is by Wattleworth in 1965
[18]. The goal was to minimize the travel time by changing the on-ramps flow. He uses an
OD matrix and assigned traffic flow for different points. In this study travel time is
minimized by maximizing off-ramp flow. His mathematical model has following form:
∑
∑
Where, i and j are set of on-ramps, and bottlenecks respectively. is the proportion of
flow of bottleneck j through on-ramp i. is the capacity of bottleneck j. is the decision
variable, and shows the flow of vehicles in the i-th on-ramp.
There are some improvements to the Wattleworth’s model by changing the objective
function to minimize the squared difference of metered rates, and demand. This yields to a
non-linear mathematical model [19].
Linear Programming algorithm was also used in Hanshin expressway in Japan, and
evaluations showed improvement in the performance of the expressway [6] [7]. This
algorithm is based on a linear programming (LP) formulation, and it requires a very
comprehensive data collection system with detectors closely spaced on the mainline and
ramps. The LP formulation used by this algorithm is expressed as:
∑( )
( ) ∑( )
Where is the i-th ramp flow and is its priority. is maximum allowable queue
lengths for each ramp. is ramp detection determines queue length. is pre-define ramp
demand. is the real time capacity. is tuneable influence factor. This factor is a weight
that scales the amount of traffic from ramp (i) remaining on the mainline at a downstream
segment (h). The roadway is divided into segments (h) between ramps (i). This linear
programming model is used in FREQ traffic analysis tool [20].
Detection of speed for each section is used to calculate the real-time capacity reduction
due to congestion, and thus to find the real-time capacity (Ch) for each roadway section. This
LP equation is solved simultaneously for all metered locations within an area of influence.
None of above LP algorithms account for time lag between the metered on-ramps and the
bottleneck. But the advantage of this algorithm is its objective function comparing to
ALINEA and other ramp metering algorithms.
Summary
There are several algorithms developed for metering on-ramps. Each of them has its own
pros and cons. All of them assume the freeway segments capacities are deterministic values.
In reality, the stochasticity of the capacity may decrease the performance of freeway facilities
metered by above algorithms. Some of them like “Demand-Capacity” are simple to be
implemented, but they lack of following a predefined objective function. The effort of this
1.3.
Contributions
The main contribution of this dissertation is the development of a mathematical model to
optimize ramp metering rates for different reliability performance levels. Previous algorithms
and models do not account for the probability of breakdown in the facility. The optimal ramp
metering rates are associated with certain value of probability of breakdown in the facility.
For a certain condition, the proposed mathematical model gives different optimal ramp
metering rates for different probability of breakdown in the facility. The model gets desired
reliability level as an input and generates the optimal ramp metering rates.
The second contribution of this dissertation is the flexibility and generality of the
proposed linear mathematical model that is capable to model any other strategy used for
controlling demand or capacity across freeways. This generalized and flexible mathematical
model could be used to optimize most demand and capacity management strategies such as
‘Hard Shoulder Running’ or ‘Managed Lanes’ to optimize freeways performance.
The third contribution is the use of stochastic nature of freeway segments capacity. Since
in reality the capacity is stochastic, it is expected to have better ramp metering outcome by
modeling this stochasticity in the algorithms and models. Moreover, it enables the capability
to evaluate the reliability of the freeway facility or the effect of ramp metering on the
reliability. Most planning level algorithms such as previous linear programming algorithms
assume the freeway capacity is a deterministic value in which they assume breakdown even
The deterministic capacity assumption avoids the mathematical algorithms to be close to
the reality. In reality slight over-capacity occurs without resulting in breakdown. This
characteristic is incorporated in the proposed mathematical model using Weibull Distribution
of the capacity based on recent literature.
The fourth contribution is the link between time and space. This is based on the fact that
vehicles are moving on the freeway facility and the flow and demand variation in one point
has impact on other downstream freeway points with certain time lag or delay. Using this
relationship, appropriate strategies should start earlier or later to become more effective in
downstream segments. In the proposed mathematical model in this research this relationship
enables the ramps to meter their entry more realistic, and be effective in the appropriate time
at the bottlenecks.
1.4.
Dissertation Outline
In chapter 2, some preliminary concepts of traffic dynamics on freeway facilities along
with definitions are provided. Chapter 3 covers the proposed mathematical model with
detailed discussion on assumptions, and the forming of the objective function and constraints.
Chapter 4 provides an example of implementing the proposed mathematical model to a real
freeway facility along with description of results and outcomes of the optimal solutions. In
chapter 5, simulations of the results are discussed. Chapter 6 reviews the conclusion and
2.
PRELIMINARIES
In this chapter, terms and definitions along with four traffic dynamics and concepts are
discussed. These are taken from HCM 2010 and most recent literature. This dissertation tries
to be consistent with these dynamics and concepts. Although some of concepts are not easy
(or possible) to model, but appropriate approximations, and simplifications are considered.
1.5.
Definitions
Highway Capacity Manual (HCM):
The purpose of the HCM is to provide a set of methodologies, and associated
application procedures, for evaluating the multimodal performance of highway and
street facilities in terms of operational measures and one or more quality of service
indicators. The objectives of the HCM are to:
1. Define performance measures and describe survey methods for key traffic
characteristics
2. Provide methodologies for estimating and predicting performance measures
3. Explain methodologies at a level of detail that readers can understand the factors
that have an effect on multimodal operation.
The Highway Capacity Manual’s last edition is published in 2010. HCM analysis and
Freeway Segments:
A segment is the length of roadway between two points. Traffic volumes and physical
characteristics generally remain the same over the length of the segments, although
small variations may occur. For freeway facilities three types of segments are
defined:
1. Basic Freeway Segments: All segments that are not merge, diverge, or weaving segments.
2. Freeway Merge and Diverge Segments: Segments where two or more traffic streams combine to form a single traffic stream (merge), or where a single traffic
stream divides to form two or more separate traffic streams (diverge).
3. Freeway Weaving Segments: Segments in which two or more traffic streams traveling in the same general direction cross paths along a significant length of
freeway without the aid of traffic control devices. Weaving segments are formed
when a diverge segment closely follows a merge segment, or when a one‐lane off‐
ramp closely follows a one‐lane on‐ramp and the two are connected by a
continuous auxiliary lane.
Figure 2: Standard Segments based on Highway Capacity Manual (2010)
Undersaturated Traffic Flow:
Traffic flow during the analysis period is specified as “undersaturated” when the
following conditions are satisfied: (1) the arrival flow rate is lower than the capacity
of a segment, (2) no residual queue remains from a prior breakdown of the facility,
and (3) traffic flow is unaffected by downstream conditions.
Oversaturated Traffic Flow:
Traffic flow during an analysis period is characterized as “oversaturated” when the
following conditions are satisfied: (1) the arrival flow rate exceeds the capacity of a
point or segment, or (2) a queue created from a prior breakdown of a facility has not
Volume:
The total number of vehicles that pass over a given point or section of a lane or
roadway during a given time interval; any time interval can be used, but volumes are
typically expressed in terms of annual, daily, hourly, or sub‐hourly periods.
Flow rate:
The equivalent hourly rate at which vehicles pass over a given point or section of a
lane or roadway during a given time interval of less than 1 hour (usually 15 minutes).
Capacity:
Vehicle capacity is the maximum number of vehicles that can pass a given point
during a specified period under prevailing roadway, traffic, and control conditions.
This assumes that there is no influence from downstream traffic operation, such as
queues backing into the analysis point.
15 min Time Periods:
All freeway analysis based on the HCM is done in 15 min time period intervals. In
this dissertation, this resolution is considered in order to be compatible with HCM
and simulation software packages. Also, data available for the case study in this
dissertation is in 15 min time periods.
Macro Simulation:
Macro simulation models evaluate traffic flow as a whole without consideration of
FREEVAL:
The computational engine, FREEVAL (FREeway EVALuation) 2010 is a
computerized, worksheet‐based environment designed to faithfully implement the
operational analysis computations for undersaturated and oversaturated directional
freeway facilities. FREEVAL‐2010 is executed in Microsoft Excel, with most
computations embedded in Visual Basic modules. The environment allows the user to
analyze a freeway facility of up to 70 analysis segments (to be defined) and for up to
twenty‐four 15‐min time intervals (6 hours).
In addition to characterizing oversaturated conditions, the most significant difference
from the segment‐based chapters is that FREEVAL carries out all calculations using
15 min flow rates
Free Flow Speed
Free Flow Speed is the average speed of traffic measured under conditions of low
volume, when vehicles can move freely at their desired speed.
Density
Traffic density is defined as the number of vehicles occupying a length of roadway
[21].
Occupancy
1.6.
Non-Linear Behavior of Speed as a Function of Flow Rate
The speed of vehicles in each HCM segment is a function of its flow rate. Figure 3
presents the speed of vehicles as a function of flow rate in Basic segments. Other segment
types have their own speed-flow curves, which are not just a function of flow rate of the main
line. These segments have more complex functions for mainline speed, in other words they
are not just a function of flow rate. For instance, in Merge segments, the amount of entry
traffic has effect on the speed of vehicles in freeway’s mainline due to vehicle’s frictional
effect. As a simplification in this dissertation we will not use those complex functions, and
we will assume the speed-flow curves for other segments are similar to Basic segments.
The speed-flow curve in Figure 3 shows the undersaturated situation in the freeways.
However if demand exceeds capacity this relationship will be estimated based on other
appropriate methodologies. Oversaturated situation on freeway facilities is difficult to model
mathematically. When there is breakdown, there will be some queue formed behind the
bottleneck. So mathematical model should consider queues on the freeway as well.
Sensor data are available in most of freeways in US. These data give the speed and
volume of the vehicles passing at certain points in the freeways. The optimal policy for ramp
metering can be updated at each period based on the realized sensor data.
1.7.
Capacity Drop on the Freeway Segments
Freeway facilities are similar to production systems. One direction of a freeway facility is
similar to a linear assembly line in manufacturing systems. Each segment could be equal to
each working or production station. On the other hand, there are some differences between
these two. On the freeway segments, there is some reduction in capacity (called Capacity
Drop) when breakdown occurs [25] [23]. This dynamic is shown in Figure 4.
In the regular production systems, when a machine reaches its capacity the output rate of
the machine will be equal to its capacity. This situation remains until the demand level of the
machine become lower than the capacity. The interesting fact about freeways is that they
behave differently. When demand exceeds capacity, there will be some reduction in the
capacity of the freeway segments. This reduction normally is between %3 to %10 [27] [25]
become lower than the capacity, capacity will not switch back immediately to its original
value. Queues formed from congestion needs to be cleared in order to go back to
undersaturated situation.
Figure 4: Capacity Drop due to congestion
The existence of the capacity drop is one difference between freeway facilities, and
production systems. From an Operations Research and Industrial Engineering point of view
this problem become interesting since it follows the mentioned capacity dynamics.
1.8.
Over-Saturated Modeling
Basically there are two states of operation on freeway facilities, undersaturated, and
oversaturated. Undersaturated is the state where all demands in the freeway’s different
segments are lower than their individual capacity. Then, there will not be any breakdown in
the freeway. Dynamics of the freeway in this environment are easy to model mathematically.
in an oversaturated state. Traffic equations are not linear, and basically the dynamic is
difficult to model. Figure 5 presents flow as a function of vehicle’s density on the freeway.
This relationship between flow and density is the base of calculation in FREEVAL
macro-simulation software. In reality this relationship could be different. The right side of Figure 5
presents the oversaturated, and left side is undersaturated state. Based on the density of the
vehicles in the freeway, we can pick a point in the presented curve. The slope of the line
connecting origin to this point shows the speed of the vehicles on the freeways segment.
Figure 5: Flow rate as a function of density
Another challenge regarding oversaturated state is that we need to keep track of the
vehicle’s queues formed upstream of the facility bottleneck, where demand is higher than
capacity. Once the demand become lower than the capacity, freeway facility will not return
1.9.
Stochastic Nature of Capacity
All HCM calculations and analysis are based on the assumption that the capacity of
different segments on the freeway facilities is a deterministic value. Recent studies showed
the capacities of the freeway segments follow a probabilistic nature [23] [30] [31]. Moreover
the nominal capacity of freeway segments usually follows a Weibull distribution [23]. The
parameters of Weibull distribution are determined by geometry of the segments on the
freeway such as number of lanes, etc.
A study in Germany showed when a flow passing a freeway section is equal to the capacity
of that segment; there is a 3% chance of breakdown at that point on the freeway in a 5-minute
time interval. In other words, on average the nominal capacity corresponds to the 3rd
percentile of the capacity distribution function in a 5-minute intervals [31]. CDF of the
Weibull Distribution is:
( ) ( )
In spite of the fact that this research has been done in Germany, and nominal capacity of
the freeway could be different than HCM, but in the studies [31] it is assumed that it is equal
to the nominal capacity of the freeway in HCM.
To estimate the parameters of the Weibull capacity distribution, the following procedures
nominal capacity of the freeway facility. More specifically, using the nominal capacity that
we have, we can estimate the scale parameter according to regressed curve.
Figure 6: Scale parameter of the capacity distribution as a function of nominal capacity [31]
After finding from Figure 6, should be determined in a way that the nominal capacity of
the freeway represents 3% probability of traffic breakdown in a 5-minute interval. In chapter
3 more detailed discussion is provided for estimating the parameters of Weibull distribution.
The mean and variance of the Weibull distribution is calculated based on following
questions:
( )
3.
THE PROPOSED MATHEMATICAL MODEL
Figure 7 shows an example of a freeway facility with its HCM segmentation. This facility
consists of two on-ramps, two off-ramps and nine HCM segments. Later in this dissertation,
the artificial segmentation is proposed to increase the accuracy, and precision of
mathematical model. Clearly, if total flow in any segment exceeds its capacity, breakdown
and congestion occur.
Figure 7: Schematic of a Typical Freeway Facility
As shown later in this dissertation, the original problem due to number of complexities
such as non-Linear equations and stochasticity is difficult to model and solve. The
mathematical model considers some simplifications and assumptions. Having these
simplifications the proposed mathematical model is developed. It is a linear programming
mathematical model, which optimizes the ramp metering rates across a freeway facility. This
mathematical model, assumes an upper bound for probability of breakdown in each artificial
segment and time step. The mathematical model is based on the concept of cell transmission
Essentially the proposed mathematical model characterizes the traffic flow on a freeway
facility based on HCM 2010. There are several assumptions, and simplifications that are
applied to problem of interest, so that it could be modeled in the context of Linear
Programming (LP). The target of this mathematical model is to come up with the optimal
ramp metering rates for freeway facilities that are not highly congested. In later parts of this
dissertation maximum limits of congestion where this model maintains its feasibility are
discussed.
The model assumes there is no breakdown in the freeway system, so the model becomes
feasible and gives optimal solution for ramp metering rates. The link to breakdown in this
model is made in a way that it tries to avoid breakdown with certain probability. Basically,
breakdown occurs when demand to capacity ratio exceeds 1. Figure 8 shows the scope of the
mathematical model. As shown in Figure 8, the model can sustain its feasibility where the
demand to capacity ratio is not a large number. In this situation, with the aid of ramp
metering, demand can be decreased on the bottleneck segments. Clearly, ramp metering is
not able to decrease very high demand levels to desired capacity. In other words, if this
model becomes infeasible it means that there is no opportunity to avoid breakdown through
Figure 8: Domain and Scope of Feasibility of the Proposed Mathematical Model
The assumption of inserting an equal lower bound on the probability of breakdown in
each artificial segment and time step results in a linear programming (LP) model. This
assumption may increase the difference between the breakdown probability and its lower
bound, but its transformation into a LP model makes it possible to solve.
1.10.
Simplifications, Assumptions and Justifications:
I. The mathematical model considers only one direction of a freeway facility. Since
most of the HCM based analysis on the freeway facilities are done in one direction of
the freeways, in this research focus is to model traffic flow in one direction of the
freeway facility.
II. Capacities of the segments are considered to be stochastic with Weibull distribution.
Parameters of the distribution are function of geometric properties in the segments
such as number of lanes [26].
III. Having the assumption of stochastic capacity this model uses percentile capacities
according to Weibull distribution to come up with an upper bound on probability of
Feasible
Demand/Capacity Ratio
0 1 2
breakdown in the freeway segments. In spite of the fact that the capacity percentile
will be employed in the mathematical model, it fits and lies in the Linear
Programming (LP) context.
IV. All on-ramp and off-ramp variables and parameters have value of zero if they are
defined in the other segment types. For instance entry and exit demand values for
Basic segments are assumed to be zero.
V. Segments should be divided into “artificial segments”. The size of artificial segments
could vary based on accuracy and resolution of the solution. The artificial
segmentation imposes smaller analysis time units which is called “time steps” for
operational evaluation of the freeway. Later in this section these two concepts are
defined and the method for generating them is discussed.
VI. It is assumed that the probability of breakdown is independent of time periods (or
time steps), and segments (or artificial segments) [23].
VII. For the purpose of defining distances between two segments, the distance between
middle points of each segment is measured. Moreover, by dividing the freeway into
equal sized artificial segments, the distance between each artificial segments, is
defined by artificial segment length times number of artificial segments between the
two points.
VIII. Stochastic capacities are defined for each HCM segment. Since the Weibull
distribution is sensitive to segment’s lengths; the probability of breakdown could vary
probability of breakdown for artificial segments based on the probability of
breakdown for HCM segments.
IX. It is assumed that capacities and upper bounds on breakdown probability of each
segment could vary in different time steps. This enables the model to analyze freeway
facilities’ performance according to demand variation and prioritize the peak periods
in the analysis.
X. It is assumed that the number of vehicles and the flow rates are real numbers. In fact
they are integers, but since the values of these variables are large enough, it is
reasonable and justifiable for this assumption. Giving this assumption, the proposed
mathematical model simplifies from Integer Programming (IP) into Linear
Programming (LP) model.
1.11.
Parameters of the Mathematical Model
The parameters of the mathematical model are presented in Table 1. These parameters are
used in the remaining discussion of the proposed mathematical model and its application in
Table 1: Parameters of the Proposed Mathematical Model
1.12.
Linking Time and Space
All vehicle flows across the freeway should be balanced. Based on HCM 2010 most of
the freeway analysis calculations are done independently in 15 minutes time periods.
Therefore demands in different 15 minute time periods should theoretically be independent
of each other. This fact imposes a limitation on the length of facility for analysis. All vehicles
entering the facility should exit the facility within 15 minute. If not then, the correlation Parameter Description
Total number of 15 min time periods in the study period Total number of HCM segments on the freeway facility Total Number of time steps in the study period
Total Number of artificial segments Duration of the time step
Number of time steps in a 15 min time period
Capacity of artificial segment k in time step t (Veh/Hour)
Upper bound for number of vehicles in the queue in on-ramp k (Veh)
Lower bound for ramp metering rate in artificial segment k (Veh/Hour)
Upper bound for ramp metering rate in artificial segment k (Veh/Hour)
Upper bound on the probability of breakdown occurrence in the facility in the entire study period
Upper bound on the probability of breakdown occurrence in time step t
Upper bound on the probability of breakdown occurrence in artificial segment k in time step t
Set of on ramp artificial segments
The on-ramp entrance demand rate in the artificial segment k in the time step t (Veh/Hour)
The off-ramp exiting demand rate in the artificial segment k in the time step t (Veh/Hour) Main line entering demand rate in the time step t (Veh/Hour)
Flow rate of the artificial segment k in the time step t (Veh/Hour)
Ramp metering rate (entering flow) in the on-ramp k in the time step t (Veh/Hour)
Number of vehicles in the on-ramp queue in the artificial segment k in the time step t (Veh) Length of study period (Hours)
Priority coefficient for prioritizing ramps
between demand levels between two consecutive 15 minute time period should be
established.
On the other hand, in this dissertation another correlation between flows of vehicles is
investigated. Assume that on the freeway facility there is a breakdown at a certain location
and time. There will be a time difference between the upstream on-ramps entry flow and
volume in the specified segment. For example if there is a breakdown in segment 14 at 5:00
pm, then ramp metering rate should meter entering traffic in segment 3 earlier than 5:00 pm
in order to effect breakdown occurrence.
At the on-ramp located far upstream of breakdown point, there will be larger time lag for
operation of on-ramp considering the breakdown point. Thus there should be a connection,
and relation between the time and the distance. This relation is a function of speed of
vehicles in the freeway. Assuming the distance between a metered on-ramp and a bottleneck
is 5 miles. If the average speed of vehicles between these two points is 60 mph, then the time
lag will be 5 minutes. So, the metering in the on-ramp will affect the bottleneck 5 minutes
Figure 9 – Flow of Traffic In Time and Space Domain (Artificial Segments and Time Steps)
Figure 9 shows time and space domain for a section of freeway facility. The freeway
facility is divided into seven artificial segments with equal lengths. The size of time step is
defined in a way that vehicles can go from one artificial segment to another within each time
step. The circles in the Figure 9 demonstrate a traffic stream which is in artificial segment 1
at time step 1. Clearly they move from one artificial segment to another within one time step.
Consider, there will be an expectation of a breakdown in artificial segment 6 at time step 6,
and there is an on-ramp in artificial segment 1. Then, to avoid breakdown in artificial
segment 6 at time step 6, the ramp metering system on artificial segment 1 should start the
operation in time step 1.
4 5 6 7
1
3 2 1
Artificial Segment
Time St
ep
2
3
4
5
6
Based on the discussion, apparently the linking between time and space is valid by
considering a constant speed for vehicles moving in the freeway system. As it is discussed in
more detail in next section, the length of artificial segments are usually smaller comparing to
HCM segmentation. This results in smaller time steps. The data exists for freeway facilities
are usually in larger resolution, which requires appropriate conversion.
Figure 10, shows the data conversion process flow required for agencies that use HCM
2010 format for geometric and demand information. As discussed, according to the 15
minute analysis, based on HCM 2010 the length of the facility is usually shorter than 15
miles. This is due to the fact that all vehicles that are entering the facility, should exit within
15 minutes time interval. This 15 minute time interval is larger than the time unit needed for
mathematical modeling to connect time and space together. Since usually the distance
between on-ramps and bottlenecks are shorter than 15 miles, in the HCM 2010, there is no
Figure 10 : Data Conversion Process Flow for Using Proposed Mathematical Model
Therefore smaller units of time and length should be defined for freeway analysis. The
“Time Step” is the time unit in the proposed mathematical model. The HCM 2010 segments
should be subdivided into smaller ones called “Artificial Segments”. Existence of “Artificial
Segment” justifies with similar clue used for justifying limitation of facility length for each
15 minutes time periods of HCM analysis.
The proposed mathematical model is based on the time steps resolution, and the artificial
segments. This will impose certain procedures for employing the artificial segments, and the
time steps. Prior to develop the model, artificial segments for the case study are defined.
Eventually there might be some conversion needed for optimal solutions to present it back in
the HCM framework.
•HCM
Segmentation •15 minute Time
Periods Geometric and Demand Data •Artificial Segments •Time Steps Mathematical Models Inputs
•With Time Steps Resolution
Optimal Ramp Metering Rates
•With 15 minute Time Period Resolution
1.13.
Defining Artificial Segments and Time Steps
Based on the cell transmission theory, freeway segments could be divided into smaller
sections. Due to the need for defining capacity for each segment, all geometric characteristics
should remain the same across each segment. More specifically, as discussed in the
stochastic capacity section of this dissertation, the distribution of capacity is a function of
geometric characteristic of freeway. In order to define the capacity for each segment, the
geometric characteristics such as the number of lanes should not change within each
segment.
As discussed, in order to model the time lag between ramp metering operation, and
occurrence of breakdown downstream of the ramp, smaller segmentation and time steps are
required. HCM uses 15 minute time periods to analyze the freeway, this resolution can
account for the delay between two points which are located more than 10 miles in the
freeways (Considering 60 to 75 mph speed). In order to account for the delay between
nearest on-ramp to the bottleneck smaller time steps are needed. For example if the upstream
on-ramp is located within a half a mile from the bottleneck, then the time step required for
analysis should be less than 30 seconds (assuming 60mph traveling speed).
The 30 seconds travelling speed, imposes half mile segmentation for the freeway.
Considering the fact that geometric characteristics should remain equal across each segment,
and the HCM segmentation for a real freeway, it could be challenging to come up with
Figure 11 – Errors Caused by Artificial Segmentation
Figure 11 shows the HCM and artificial segmentation of a freeway section. The dashed
lines show the artificial segmentation. Although by picking very small length for artificial
segmentation the error decreases the dimensions of the problem increases dramatically, this
results in larger required computational time.
Following procedure is proposed for finding a desirable length for artificial segments.
Let’s assume is the highest error between HCM and artificial segmentation which is
affordable to take. Then, for any resolution for artificial segmentation, all errors should be
less than . The objective is to minimize total number of artificial segments to improve
computation time. The mathematical scheme of the artificial segmentation has following
( )
To reduce complexity, following procedure is proposed to find the optimal solution for
the artificial segment lengths. Following are the steps of the algorithm:
Step 0: Start
Step 1: Slice the freeway by equal sized artificial segments with the length of smallest sized segment in the facility.
Step 2: Check if the errors are less than value. If they are larger proceed to step 3, otherwise proceed to step 4.
Step 3: Increase number of artificial segments by one unit, and then go to step 2.
Figure 12 – Process Flow for Generating Artificial Segments
Figure 12 shows the flow chart of proposed procedure for generating artificial segments.
This procedure is used for creating the artificial segments in this dissertation. More optimized
methods could be employed to address this slicing.
Step 1:
Set the artificial segment length to the
smallest segment length
Step 3:
Increase number of artificial segments by
one unit
Step 2:
Are all errors smaller
than ?
Step 4:
End
Step 0:
1.14.
Relaxation of Non-Linearity between Speed and Flow
Relaxation of Non-Linear relationship between the traveling speed of vehicles and the
flow rate of vehicles in the segments is the main simplification. According to Figure 3, the
relationship is closer to be linear in smaller Free Flow Speeds (FFS). Usually ramp metering
strategy is used in metropolitan and congested areas. This means the vehicle’s speeds are
usually low. Moreover, the Speed Limits in metropolitan areas are lower comparing to rural
freeways. These two facts justify the low FFS expectation in freeways that are operating
under ramp metering. As presented in Figure 3, consideration of low FFSs, justifies
approximating the speed of vehicles in the segments by their FFSs.
Therefore, all speeds are assumed to be approximately 55 mph in the proposed
mathematical model in this dissertation. Reason for this speed approximation is to link the
space (length) and the time together. Thus if two points have 1 mile distance, the traveling
time between these two points will be 1.1 minute. Consider is the speed of the vehicles in
the freeway, is the distance between two points and is the travel time between these two
points. Then following equations demonstrates the relationships between the traveling time
and the distance.
The result implies, whatever happens in the upstream point, the effect exposes 1.1 minute
later in downstream point. In the mathematical model, ramp metering should be scheduled in
a way to account for this delay.
1.15.
Modeling Stochasticity of the Segment’s Capacity:
The way stochastic capacity has been defined and measured [23] imposes a limitation in
its implementation. For measuring the capacity of the freeways, previous studies in Germany
have been done in only one critical segments of freeway [23], which is called freeway
section.
Figure 13: Two cases of freeway sections under investigation for measuring the reliability [23]
There is not any sign of segments’ definition in the stochastic capacity studies [23] [25].
A reasonable approach to employ stochastic capacity is to define it in every HCM segment.
Another approach could be to define it in the critical segment. Another challenge is that the
literature [23] [23] has not provide any information on the length of sections. Eventually as
an assumption in this research the concept of stochastic capacity are implemented on the
Stochastic nature of capacity is incorporated in the proposed model as a chance constraint
set. More specifically, with the aid of capacity probability percentiles, capacity chance
constraints become deterministic and linear. In another word although capacity of each
segment is stochastic in all time steps, the proposed mathematical model uses upper bound
on the probability of breakdowns which translates into capacity percentile probabilities. Use
of upper bound is due to long run evaluation of the freeway. On the other hand if simulation
is considered to be used, then randomly generated capacities of each segment should be
determined for analysis, and long run simulation of the freeway system yields similar
performance measures.
Based on the studies on freeways in Germany, the capacity of each freeway segment
follows Weibull distribution with parameters and . The Weibull distribution parameters
are function of the geometry of the freeway’s segments [23]. So:
( )
CDF of the Weibull Distribution is:
( ) ( )
So, the appropriate constraint for limiting probability of breakdown is:
{ }
( )
( ) ( )
√ ( )
( ) √ ( )
The last term is a deterministic linear function that is embedded in the proposed
mathematical model. Note that, although or depend on t, but it does not mean that they
could necessarily vary by time. Since, it is assumed is stochastic with Weibull
distribution, it does not imply that they have different values in different time steps. The
rational beyond using t is to generalize the model, and make it capable of modeling time
1.16.
The Proposed Mathematical Model
3.7.1. Objective Function:
Several objective functions could be incorporated to optimize ramp metering rates, and
use of them could vary the optimal ramp metering solutions. Applicable objective functions
could be:
1. Minimizing ∑ :
This objective function minimizes total number of vehicles that are queued in the
metered on-ramp. Since blocking the on-ramp avoids entry traffic, this number is
associated with the on-ramp delay. Considering, proposed mathematical model does
not model traffic congestion in the freeway facility, and fairly stabilized mainline
traffic speed, the only contributor to the travel time delay is on-ramp delay. This
linear objective function makes the model simple, and very quick to solve. This
functionality enables the proposed model to be incorporated in the online system wide
ramp metering optimization using traffic sensors in the freeway facilities easily.
Incorporating priority coefficients ( ) in the objective function, some important
ramps could get more priority in the freeway system. The proposed mathematical
model could shift the delay behind the ramp into other on-ramps if desired by analyst.
2. Maximizing total traffic flow on the On-Ramps (∑ )
This objective is easy to model. In previous studies, each has a coefficient which
![Figure 1: Ramp Metering In M6, Birmingham, UK [2]](https://thumb-us.123doks.com/thumbv2/123dok_us/1765177.1227006/12.612.150.484.70.323/figure-ramp-metering-in-m-birmingham-uk.webp)
![Figure 3: Speed as a function of flow rate [4]](https://thumb-us.123doks.com/thumbv2/123dok_us/1765177.1227006/31.612.153.477.387.599/figure-speed-function-flow-rate.webp)