Why Do Different Charge Demand Tests Give Different Endpoints?
Martin A. Hubbe
NC State University, Dept. of Wood & Paper Science Box 8005
Raleigh, NC 27695-8005 USA http://www4.ncsu.edu/~hubbe
Abstract
Have you ever encountered situations where two people, both measuring the same samples taken from a paper machine system, have reported sharply different results for cationic demand tests? Such situations actually are quite common. A lot of needless energy can be spent trying to figure out which of the two sets of data is “correct.” Fortunately, there are some understandable
reasons to expect variations in the details of charge titration tests to yield significantly different results. By keeping these issues in mind, it is possible to get beyond questions of the correctness of different procedures. The end goal should be to improve the reproducibility of the results of charge demand titrations and to interpret the results with greater confidence.
Introduction
Technical people who are concerned about the efficiency of papermaking
operations have a variety of tools that can be used for monitoring or control of the electrical charge at the surfaces of fibers and other suspended matter [1]. For example, streaming current titrations have become very widely used for
determining the cationic demand of process water collected at various points in papermaking processes [2-6]. Alternatively, it is possible to perform similar measurements in a more direct way with a pad-forming streaming potential device [7-10]. Issues related to selecting the most appropriate test equipment and procedure for a given situation were considered in paper presented at a Pira conference in 2000 [1].
Key motivations for carrying out cationic demand determinations in a paper mill often can be summarized by the words “troubleshooting,” “optimization,” and “control.” Just like pH and temperature, cationic demand data sometimes can help in finding the root causes of problems like foam, cycles of poor drainage, and deposit problems. By paying attention to charge, it is often possible to improve the efficiency of, say, retention aids. Since retention aids affect the efficiency of other wet-end additives, e.g. sizing agents, such adjustments are likely to affect the mill’s bottom line.
evaluation of the charge demand characteristics of different filtrate and
whitewater samples collected at paper mills, often give conflicting information?
Contrasting Test Methods and Procedures
The first issue to face is the proliferation of various contrasting test methods, all related in some way to the electrical charged nature of papermaking fibers and the aqueous medium in which they are suspended. As explained in more detail elsewhere [1], some test procedures, such as microelectrophoresis [11-16] have mainly been employed for measurement of an intensive property. The zeta potential is an example of an intensive property because its value does not depend on the size of the sample. Rather, zeta potential is something like a voltage, which ought to be independent of sample size, as long as the samples are representative and enough measurements are taken.
While zeta potential and related intensive variables clearly play key roles,
governing the interactions between different wet-end additives, fibers, and fillers [1], papermakers often need to answer questions that include the words “how much.” Answers to that type of question usually involve extensive variables. For instance, it is important to know how much of a highly charged additive such as poly-ethylenimine (PEI) or poly-aluminum chloride (PAC) ought to be added to a specified amount of furnish to achieve the most efficient performance of a
retention aid and various functional additives. The answers to such questions usually involve some sort of titration. In addition to the work involving streaming current titrations, which already was cited [2-6], papermakers also have used charge titration methods with colorimetric endpoints [17-19] or conductometric endpoints [20]. Micro-electrophoresis has been used occasionally as a means of finding how much of a cationic additive is needed to achieve a zero zeta potential [21]. More recently, fiber-pad streaming potential has been found to be an
effective means of evaluating cationic demand, by means of titrations [10, 22-24].
The properties of the titrant also can affect on the results of charge titrations. According to Laine and Lindström [25], the relative charge density of the titrant vs.
that of the polyelectrolytes in the sample can become increasingly important as the salt concentration of the sample increases. Other potentially important
variables include the molecular mass and structural details of the polyelectrolytes.
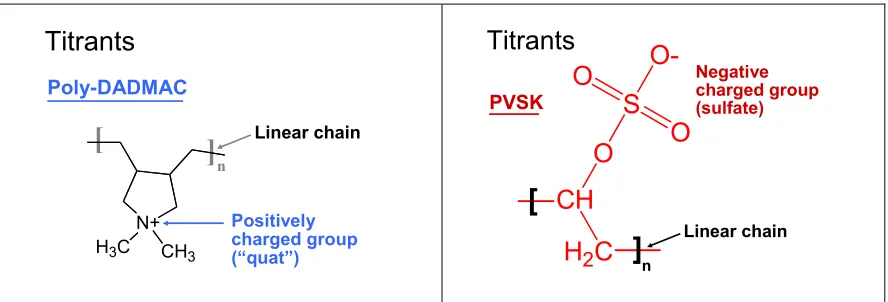
Two of the most widely used titrants for charge evaluations are shown in Fig. 1. Both of these titrants are 100% charged, i.e. they have one ionic charge per repeating unit. Such high charge density generally has proven to be
Titrants
Poly-DADMAC
[
]
N+ H3C CH3
Linear chain Positively charged group (“quat”) n Titrants PVSK
H2C CH O S O O
O-[
]
Linear chain Negative charged group (sulfate)n
Fig. 1. Titrants often used for charge demand titrations: (a) Poly(diallyldimethyl- ammonium chloride; (b) potassium salt of poly(vinylsulfate)
Reasons why the nature of the titrating polymer can affect titration results can be understood by considering the kinds of interactions illustrated in Fig. 3. As shown, it makes sense to envision two main types of contribution to the cationic demand of an aqueous sample from a paper mill system. Part of the charge can be classed as “soluble,” in the sense that it will pass through a filter paper. That part may include anionic polyelectrolytes, such as breakdown products of
hemicellulose and lignin, as well as size-press starch. Colloidal materials, such as wood pitch, also might be able to pass through the filter paper, at least partly. The other main type of contribution to cationic demand can be called “surface charge.” In other words, fiber fines, filler, and other filterable matter in the sample can take up a certain amount of cationic titrant.
In Theory ….
Titrant
+
+ + + + + + + + + - -- -Soluble anionics-Colloids & particles
+ + + + + + + + -+ + + + + + +- + + -+ + + + + + + + Fig. 2. Schematic diagram indicating how cationic demand may involve a summation of effects due to non-filterable and non-filterable materials
hypothesis is seldom strictly true, it comes close enough to being true in order to achieve useful information. Some issues concerning charge stoichiometry have been considered elsewhere [1,26].
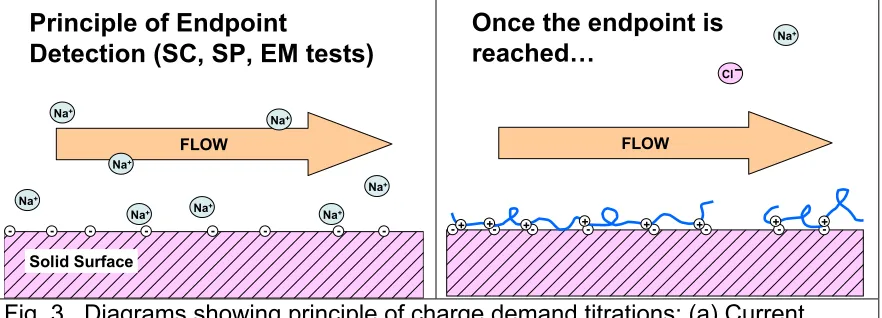
The principle by which several of the commonly used charge titration methods work is illustrated in Fig. 3. Imagine a flat substrate having a net negative charge (indicated in the figure as little minus signs in circles). As shown in the left-hand frame of the figure, counter-ions, such as sodium ions, can be expected to be present in excess adjacent to the surface, since the total charge of the system needs to be zero. Because of the thermal energy of molecules and ions, all of the dissolved ions will continually move in semi-random directions. What results from these effects is a distribution of ions at various distances from the charged surface. The average positions of counter-ions can be predicted based on the sum of the attractive electrostatic forces between the counterions and the surface, plus the random motions due to thermal energy. As shown in the diagram, flow past such a charged surface will tend to move some of the counter-ions,
especially those that happen to be relatively far from the charged surface. The resulting current can be measured by various tests, some of which will be illustrated in examples to be considered later in this article.
FLOW
Principle of Endpoint
Detection (SC, SP, EM tests)
-
-- - - - -
-Na+
Na+ Na+
Na+
Na+
Na+
Na+
Na+
Solid Surface
FLOW
Once the endpoint is reached…
-
-- - - - -
-Na+
Cl
+ + + + + + + +
Fig. 3. Diagrams showing principle of charge demand titrations: (a) Current arising due to flow moving counter-ions adjacent to a charged surface; (b) Endpoint condition in which the net surface charge is matched by that of a polyelectrolyte, and the net counter-ion concentration charge is zero
It might be said that the foregoing brief introduction to the subject of charge demand titrations provides almost enough information to be dangerous. One of the biggest dangers is overconfidence. For instance, how many people do you know who have gone back and rechecked their charge analysis numbers by using a second, reference method? Probably none. So, with an eye to encouraging caution, let’s continue by considering a series of horror stories. Each of the case studies considered in the subsections that follow is based on a real experience.
Case One: Parallel Streaming Current Tests Get Different Results
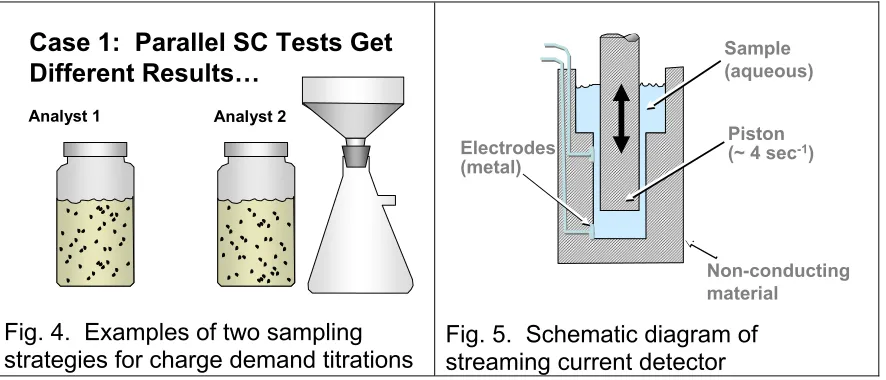
The first case study involves a paper machine trial at an alkaline fine paper mill. Various adjustments to wet-end additives were being made during that study in order to meet the specifications of a new paper grade under development. Naturally, representatives of various chemical suppliers were on the scene. For instance, the supplier of cationic starch had made sure that their representative had an assistant assigned to carrying out cationic demand titrations. Let’s just call this assistant “Analyst 1.” As shown in Fig. 1, Analyst 1’s procedure involved simply collecting whitewater samples and running the titrations.
A representative from the supplier of calcium carbonate filler also was on the scene. As shown in Fig. 1, her procedure involved exactly the same kind of whitewater samples, collected at approximately the same times. However she passed the samples through filter paper as soon as they were collected and did subsequent analysis on the filtrates.
Case 1: Parallel SC Tests Get Different Results…
Analyst 1 Analyst 2
Fig. 4. Examples of two sampling strategies for charge demand titrations
Electrodes (metal)
Piston
(~ 4 sec-1)
Sample (aqueous)
Non-conducting material
Fig. 5. Schematic diagram of streaming current detector
Just to review how streaming current tests work, imagine a plastic piston moving up and down repeatedly by about 0.5 cm with a frequency of approximately four Hertz. The piston fits inside of a plastic cylinder housing, with an annular space of about 0.5 mm. The aqueous sample is placed in a reservoir so that it flows down and fills the annulus. The reciprocating motion of the piston causes liquid to rush back and forth past the plastic walls of the piston and cylinder. Based on the principles shown earlier in Fig. 3, the movement of aqueous solution relative to the plastic surfaces can give rise to a measurable current. However, such a current exists only if there is a net charge on the plastic surfaces. Whenever this kind of device is used for charge titrations, there is an implicit assumption that colloidal matter from the sample can adsorb efficiently onto the plastic.
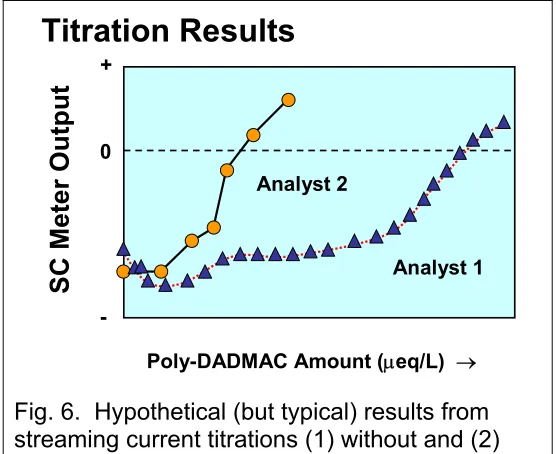
Figure 6 shows the results of the titrations carried out by the two analysts. Notice that in each case it was possible to determine a clearly identifiable endpoint of the titration, i.e. the point at which the curve crosses zero streaming current meter output. Both analysts were pleased that their titration curves were relatively steep and linear at the point where the meter output changed from negative to positive, since those characteristics tend to be an indication of precision of the method. Also, each of them was able to get approximately the same endpoint when the same procedure was repeated.
But members of the technical team at the paper mill were not so pleased. Why, they wanted to know, were the two sets of results giving different answers by more than a factor of two?
Titration Results
SC Meter
Output 0
+
-Poly-DADMAC Amount (µeq/L) →
Analyst 1 Analyst 2
Fig. 6. Hypothetical (but typical) results from streaming current titrations (1) without and (2) with filtration to remove solids before the test
Gotcha! You thought that I wasn’t looking, when you turned that page without figuring out the explanation. Congratulations to those who did!
As illustrated in Fig. 7, the explanation almost certainly lies in the fact that one of the samples was filtered, and the other was not. Remember that cationic
demand often can be treated as a sum of two terms – a demand due to “soluble” matter such as anionic polyelectrolytes, plus a demand due to the negative surfaces of various filterable solids. If one filters calcium carbonate filler from white water, it is likely that one is filtering out a major part of the charge demand present in the original sample.
P
is
to
n
C
yl
in
d
e
r
w
al
l
M. Hubbe Analyst 1’s Sample
P
is
to
n
C
yl
in
d
e
r
w
a
ll
M. Hubbe Analyst 2’s Sample
Fig. 7. Schematic representation of annular region within a streaming current apparatus either (a) without, or (b) with filtration to remove solids before the titration
Before leaving this case it is worth mentioning one very important implication. That is, in cases where charge titrations are carried out with unfiltered white water, one can expect to find a high correlation between the charge titration results and first-pass retention. When first-pass retention is low, the amount of solids in the white water are likely to be higher, and vice versa. Paper machines where online charge and consistency tests are both carried out with the same unfiltered whitewater samples may find such a high correlation between the two. In fact, the two kinds of measurements may tend to be redundant. In such cases it can make sense to install an automatic filtering system. For instance headbox stock can be filtered through a screen. Even in the absence of filter paper, the fiber mat on the screen tends to do a very good job of filtering out fine particles, making it possible to attribute charge titration data just to the soluble (or colloidal) portion of overall cationic demand.
Case Two: Parallel Tests from the Same Beaker
about a case in which two different types of titration curves were obtained by taking a series of samples from the same beaker, to which incremental amounts of titrant had been added?
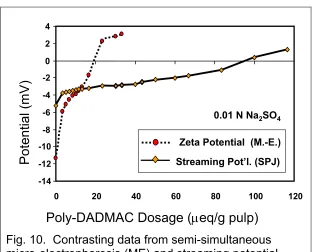
As depicted in Fig. 8, one of the methods of determining the titration endpoint involved a pad-forming streaming potential device [7-10]. The figure illustrates one of the ways in which this type of device can work. As shown, the guts of the apparatus involve a screen, toward which a stock suspension is pulled by means of vacuum. Filtrate passes through the screen, and a mat of fibers builds up, creating a resistance to flow. Metal probes on either side of the mat sense the change in electrical potential that results from flow through the fiber pad. The principle by which the signal arises is essentially the same as that shown in Fig. 3, except that the fibers themselves are now substituting for the “wall” surface shown in that figure. Because of various factors affecting the condition of metal probes, the measured signals during the application of flow are always compared to a reference measurement at zero (or other) pressure.
Figure 9 depicts the other type of device that was used in Case Two. Micro-electrophoresis involves the microscopic observation of tiny particles within a capillary tube. A known voltage is applied between two cell chambers at the ends of the capillary tube, and the small particles migrate in response to the applied field. In the case described, the samples for micro-electrophoresis were periodically withdrawn from the filtered side of the streaming potential apparatus, right during the titration. Then, after completing the micro-electrophoresis test, the streaming potential test was continued with the next higher increment of poly-DADMAC titrant addition.
Case 2: Parallel Tests from same beaker by “SP” vs.“EM” …
-23.05 mV Voltage Meter
Air
Vacuum Screen
Fiber slurry Filtrate
Insulated wires
Fig. 8. Schematic diagram of a pad-forming streaming potential device
Electrophoretic Mobility
• Small particulates only • Quantitative
+
-Microscope
Capillary cell
Fig. 9. Schematic diagram of an electrophoretic mobility test device
-14 -12 -10 -8 -6 -4 -2 0 2 4
0 20 40 60 80 100 120
Poly-DADMAC Dosage (µeq/g pulp)
Potential (
m
V)
Zeta Potential (M.-E.)
Streaming Pot’l. (SPJ) 0.01 N Na2SO4
Fig. 10. Contrasting data from semi-simultaneous micro-electrophoresis (ME) and streaming potential (SPJ) tests with samples from the same beaker [23]
To begin to account for the surprising results in Fig. 10, let’s start by considering one of the standard explanations [10]. We will return to this issue after one of the later case studies, where we will learn another part of the mystery, all helping to account for that remarkable factor of five.
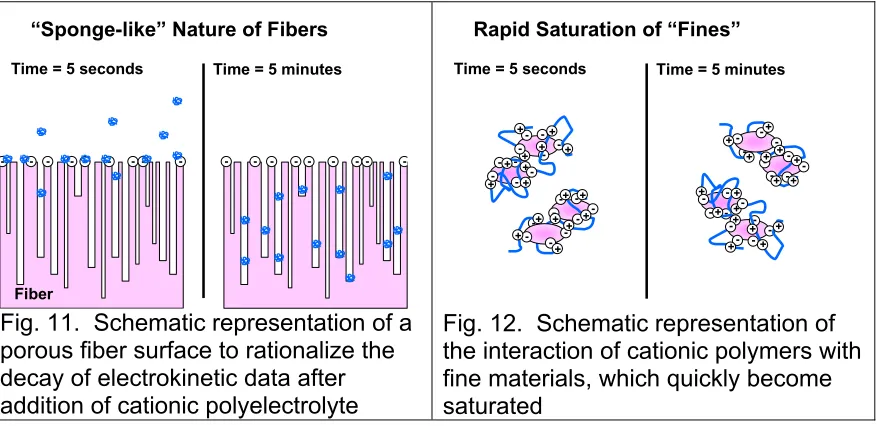
As shown in Fig. 11, you can think of a kraft fibers as being something like a sponge. The nanoporosity of kraft and sulfite fibers have been characterized in a variety of ways [27-30]. In principle, a polyelectrolyte molecule ought to be able to fit into such pores. Even if the average randomly coiled size of the
macromolecule is larger than the pore, it is still possible that the molecule could enter the pore like a worm; the technical term of this kind of polymer movement is “reptation” [31]. Alternatively, a polyelectrolyte ought to be able to gradually work itself into the tiny spaces underneath cellulosic microfibrils and nanofibrils at the fiber surface [32-33]. Either one of these mechanisms could account for the charge decay phenomena reported by various investigators [24,34-36].
But what about those semi-simultaneous measurements involving micro-electrophoresis? Since those measurements involved samples taken at the same stages of titrant addition, and at the same times, how does the charge decay mechanism help to account for these results? The key to the explanation is that micro-electrophoresis always involves tiny particles, such as fiber fines and filler particles. It does not involve full-length fibers.
words, as illustrated in Fig. 12, the adsorption of titrant molecules onto the fines reaches a steady state almost immediately, as soon as the mixing is done. Such an explanation is consistent with various facts that we know:
• The surface area per unit mass of fine particulate matter tends to be much higher than that of the fibers [37-38]; it follows that the initial amount of titrant adsorbing onto the fine material, per unit mass, will be higher by about the same ratio.
• Filler particles, which often make up a big fraction of the surface area of fine matter are generally non-porous.
• Porosity also is not an issue in the case of any dissolved polyelectrolytes that happen to be part of the cationic demand of a papermaking furnish. Such material ought to form relatively stable polyelectrolyte complexes with the added titrant within a second or so after mixing.
• Finally, we know that fine particles, by definition, are not as big as fibers. That means that added titrant molecules do not have as far to travel in order to penetrate into all of the accessible pore spaces.
“Sponge-like” Nature of Fibers
Time = 5 seconds
Fiber
Time = 5 minutes
- - - - - - - - -- - - - - - - -
-Fig. 11. Schematic representation of a porous fiber surface to rationalize the decay of electrokinetic data after addition of cationic polyelectrolyte
Rapid Saturation of “Fines”
Time = 5 seconds Time = 5 minutes
-+ + + + + + +- + + -+ + + + + + + + - -- -+ + + + + + + + + -- -+ + + + + + + +
Fig. 12. Schematic representation of the interaction of cationic polymers with fine materials, which quickly become saturated
Case Three: Today’s Re-measurement of Yesterday’s Sample
The method used to obtain the measurements, once again, was fiber-pad
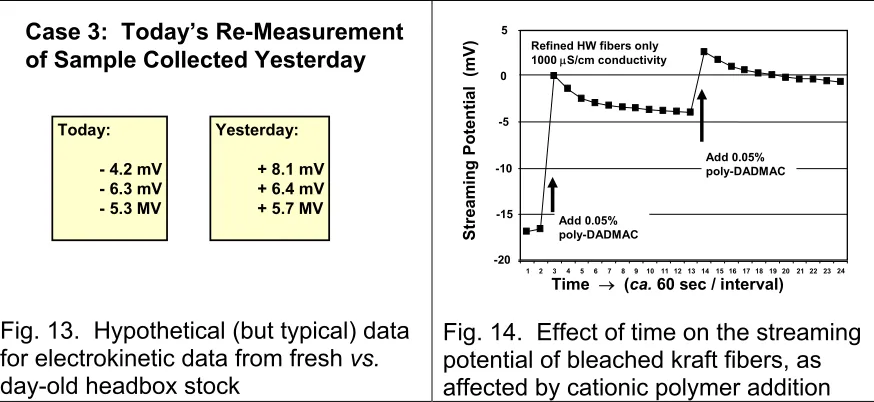
streaming potential, as was illustrated in Fig. 8. A summer intern doing the work obtained some headbox stock and obtained the data shown on the right side of Fig. 13. These positive numbers at first seemed surprising, given the generally negative nature of papermaking fibers, so the boss was skeptical. Just to be sure, the intern was asked to make additional measurements the next day. The sample was still sitting on the bench, so it was easy to obtain an additional four measurements, as shown in Fig. 13. As you can see, the results came out quite differently.
Case 3: Today’s Re-Measurement of Sample Collected Yesterday
Today:
- 4.2 mV - 6.3 mV - 5.3 MV
Yesterday:
+ 8.1 mV + 6.4 mV + 5.7 MV
Fig. 13. Hypothetical (but typical) data for electrokinetic data from fresh vs.
day-old headbox stock
-20 -15 -10 -5 0 5
Stre
am
in
g Po
te
nt
ia
l (m
V)
Time → (ca.60 sec / interval)
1 2 3 4 5 6 7 8 9 10 11 12 13 14 15 16 17 18 19 20 21 22 23 24
Refined HW fibers only 1000 µS/cm conductivity
Add 0.05% poly-DADMAC
Add 0.05% poly-DADMAC
Fig. 14. Effect of time on the streaming potential of bleached kraft fibers, as affected by cationic polymer addition
One of the ways to account for the observations shown in Fig. 13 is to assume that the highly cationic wet-strength agent, the positive multi-valent aluminum ions, and cationic polymers used in formulating the AKD size were sufficient to reverse the charge of the fibers, when the sample was freshly obtained from the paper machine. Then, over time, it is reasonable to expect the cationic materials to absorb into the fiber, as in the previous case study. In addition, the distribution of different types of aluminum species often changes with time, resulting in
formation of a lot of uncharged Al(OH)3.
Figure 14 shows some laboratory work illustrating related effects in the case of bleached kraft fibers. Note that addition of a highly charged cationic polymer was able to abruptly change the observed streaming potential, or even reverse it to a positive number if enough of the cationic polymer was added. The charge-decay effects shown in Fig. 14 have been attributed to the same factors mentioned earlier, i.e. gradual migration of charged materials into the pores spaces of the fibers, including the spaces underneath the microfibrillar fuzz at the fiber surfaces.
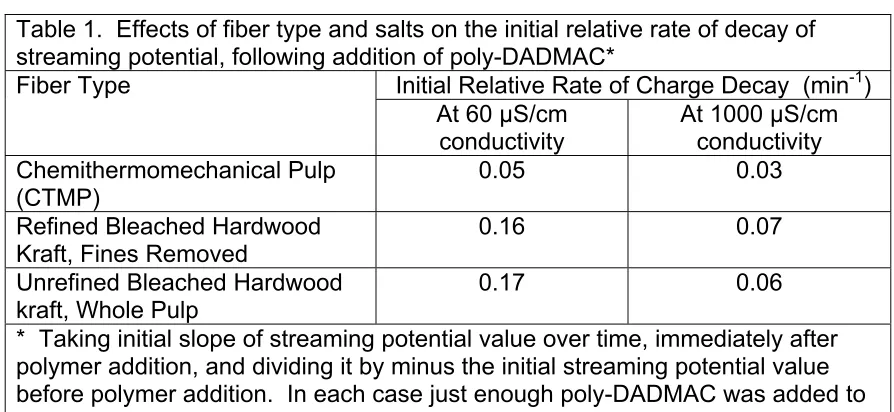
chemithermo-mechanical pulp (CTMP) fibers. Such fibers still have most of their lignin. By contrast, bleached kraft pulps have had the lignin taken out, so it makes sense that polymers could occupy sites vacated by that lignin during pulping and bleaching.
Table 1. Effects of fiber type and salts on the initial relative rate of decay of streaming potential, following addition of poly-DADMAC*
Initial Relative Rate of Charge Decay (min-1) Fiber Type
At 60 µS/cm conductivity
At 1000 µS/cm conductivity Chemithermomechanical Pulp
(CTMP)
0.05 0.03
Refined Bleached Hardwood Kraft, Fines Removed
0.16 0.07
Unrefined Bleached Hardwood
kraft, Whole Pulp 0.17 0.06
* Taking initial slope of streaming potential value over time, immediately after polymer addition, and dividing it by minus the initial streaming potential value before polymer addition. In each case just enough poly-DADMAC was added to achieve a streaming potential of about zero at time equal to zero.
The rapid rates of decay observed in the absence of added salt (60 µS/cm conductivity) are tentatively attributed to a longer range of the electrostatic interactions. At a conductivity of 60 µS/cm conductivity the Debye length (which is related to the range of electrostatic forces in aqueous solution) is about 200 nm. By contrast, at a conductivity of 1000 µS/cm the Debye length is about 1 nm. That implies that the electrostatic forces will tend to be more effective in the
absence of salt, more quickly attracting the polyelectrolyte into positions that maximize the charge interactions. This new hypothesis needs to be evaluated in the future by other kinds of experiments.
Case Four: Parallel Tests by Streaming Potential With or Without Salt
The next case involves a situation where the research facility was located in a different state from the paper mill. It just seemed to make sense to carry out the tests in a location where a full range of scientific equipment, in addition to
technical staff, were available. However, it didn’t seem to make sense to carry at lot of buckets of headbox furnish. So instead, portions of headbox furnish were poured into a handsheet device. The resulting pulp pads had a consistency of about 10%.
argument in favor of adding salt was basically to keep the system as similar as possible to the mill conditions. The argument in favor of using distilled water was mainly based on the fact that polyelectrolyte complexes tend to form more
strongly under those conditions, and it is also more likely that a 1-to-1
stoichiometry of interaction will be achieved. In the interest of being thorough, it is was decided to measure the cationic demand of the pulp under three
conditions, including a much higher electric conductivity.
Results of the tests are shown in Fig. 15. The endpoints of streaming potential titrations are shown for three different electrical conductivities, achieved by the addition of sodium sulfate. Results are plotted with a logarithmic axis.
Remarkably, there was a factor-of-ten difference, depending on the salt concentration. In other words, much more cationic polymer was required to achieve a neutral streaming potential value in the presence of added salt.
Endp
oi
n
t
(%
Pol
y-D
A
D
M
A
C
)
Electrical Conductivity (µS/cm)
0.01 0.10
60 1000 5000
0.02 0.03 0.05 0.20 0.30
Fig. 15. Results of streaming potential titrations of bleached kraft fibers, showing how the endpoint depended on conductivity, adjusted with Na2SO4
“Classic” Explanation for Salt Effect on Streaming Potential Endpoint…
Low Salt High Salt
Fiber Surface
Fig. 16. Schematic diagram showing the usual explanation for the effect of salt on the endpoints of streaming potential titrations
Figure 16 illustrates the conventional way in which the effect of salt could be explained in such a situation. It is well known that polyelectrolytes tend to have an expanded conformation of their semi-random coils, compared to uncharged soluble polymers [39-40]. The expanded conformation is often explained in terms of charge repulsion between like-charged groups. However, salt ions tend to screen those repulsive forces, so the amount of expansion tends to decrease with increasing salt. In principle, a reduced effective size of the polyelectrolyte ought to allow it is fit more easily into a small pore. In addition, as mentioned by Farley [36], salt will tend to reduce the strength of interactions between polymer segments and cellulosic surfaces; the reduced strength of interaction ought to help prevent the polyelectrolyte from getting “stuck” near the entrance to a pore, for instance.
of the measured streaming potential back and forth just by changing the concentration of salt in the water being used for testing. The experiment was carried out by first exposing the fibers to cationic polymer in the absence of salt. The cationic polymer was added until the streaming potential changed from negative to positive. Immediately, the charge started to decay back toward the negative side, so more cationic polymer was added. This was repeated until the fibers gave a strongly positive streaming potential indication in the absence of salt. Then salt was added to the system. Then the solution was replaced by salt-free solution, etc.
Results of the tests described are shown in Fig. 17. Note that it was only after adding the second dose of 0.3% poly-DADMAC, on a solids basis, that the streaming potential first became positive. A net addition of 0.9% poly-DADMAC yielded a strongly positive signal of ca. 70 mV. As shown, addition of salt
changed the sign of streaming potential from positive to negative. The situation was reversed by filtering out the fibers and redispersing them in salt-free solution having the same pH (indicated by “60 µS/cm”). As shown, the gradual addition of salt made the signal go back to negative. Then the same cycle was repeated for a third time at the right-most section of the plot.
-150 -100 -50 0 50 100
1 2 3 4 5 6 7 8 9 10 11 12 13 14 15 16 17 18 19 20 21 22
Str
ea
m
in
g
P
o
te
n
ti
al
(
m
V)
Time → (ca.80 sec / interval)
Add 0.3% poly-DADMAC Add 0.3% poly-DADMAC
Add 0.3% poly-DADMAC
Add salt Adding salt Adding salt
60 µS/cm 60 µS/cm
But what about observed reversibility?
Fig. 17. Effect of alternating low and high salt on the streaming potential of kraft fibers exposed to cationic polymer
Where the “SP” Signal Comes From
Typical Salt
Fiber Surface Very Low
FLOW FLOW
FLOW
Fig. 18. Schematic representation of how salt appears to affect results of streaming potential test results
Our current hypothesis to explain the effect of salt on the sign of streaming potential, following addition of cationic titrant to fibers, is shown in Fig. 18. First, we assume that the cationic polymer adsorbs mainly on the outside of a porous layer of microfibrils and nanofibrils at a fiber surface. At very low salt
concentration we assume that the streaming potential signal is almost completely due to the charged nature of the outer-most layers of the fibers. Because those outer-most layers have a high concentration of cationic polymer, a positive streaming potential is observed. Then, after addition of salt, the observed streaming potential appears to involve a summation of two component signals – one originating at the fiber surface, and another component involving flow among and through pore spaces near to the fiber surface. Since the accessible surfaces between and under cellulosic fibrils and nanofibrils at the fiber surface are
expected to have less of the cationic polymer adsorbed on their surface, this mechanism can explain why the second component signal will tend to be negative, and why the observed streaming potential switched back and forth in sign with changes in salt concentration.
Due to the surprising and subtle nature of the effects just described, a study has been initiated to discover its implications for the papermaking process. For instance, preliminary tests suggest that dewatering rates of fiber pads are highly correlated to the streaming potential, but only when those measurements are made in salt-free solution. Does that observation imply that drainage
characteristics are most directly affected by the charge characteristics on the outermost surfaces of the fibers, as would be measured in salt-free solution? Some of our ongoing research efforts are aimed at finding answers to questions of that nature.
Case Five: Some Samples that Give Poor Endpoints
The next case to be considered involves the kind of samples that often seem to be particularly challenging for streaming current titrations, the method that was considered in Case One. Streaming current titrations were carried out with aliquots from a dilute solution of touch-oxidized size-press starch [41]. Titrations were repeated at various levels of NaCl addition. Results are given in Fig. 19.
Several different effects are shown in Fig. 19. First, the addition of salt tended to suppress the magnitude of the initial signal, before addition of any titrant.
Poly-DADMAC Addition (meq)
-0.6 -0.4 -0.2 0
0 0.4 0.8 1.2 1.6
Stre
am
in
g Cu
rre
nt
Si
gna
l (m
V)
No NaCl 0.01% NaCl 0.1% NaCl 1.0% NaCl Oxidized starch,100 ppm CaCl2
Fig. 19. Streaming current titrations of dilute touch-oxidized starch solutions in the presence of various NaCl amounts
Without going into all of the mechanisms that can lead to the problems of streaming current measurements at increasing salt levels [26,41], there are two practical questions that every user of this type of test needs to consider. The first question is whether the tests that are being carried out in a given mill by the streaming current method are inside or outside of the range of conditions where reliable results can be expected [41]. The second question involves whether more reliable results can be achieved by diluting every sample with distilled or deionized water.
Fortunately, there is a way to answer both questions mentioned in the previous paragraph. The test involves a comparison of the regular streaming current titration results with a reference test. The recommended reference test involves diluting the sample by a factor of ten with the distilled water, and then multiply the end result of the titration by ten.
-400 -350 -300 -250 -200 -150 -100 -50 0
0 500 1000 1500 2000 2500
Poly-DADMAC (mEq/L) S tream ing Cu rr ent S ig n al
SC Device “A”
“As received” sample 10X diluted sample; result X10 -70 -60 -50 -40 -30 -20 -10 0
0 500 1000 1500 2000
Poly-DADMAC (mEq/L) Stre am in g C u rren t S ig n al
SC Device “B”
“As received” sample
10X diluted sample; result X10
Fig. 20. Streaming current titrations of whitewater from TMP mill having high level of water recirculation using two commercial devices (frames A and B), showing generally good agreement in titration endpoints.
The mill samples represented in Fig. 20 gave generally good titration results, even without dilution, in contrast to the situation shown in Fig. 19. The good results, despite the high conductivity, were tentatively attributed to a relatively high anionic charge density and pitchy nature of the samples. By contrast, the touch-oxidized starch had a very low density of anionic charge, and those titrations were carried out in the absence of wood pitch.
Things to Keep in Mind
Obviously the present discussion does not give a complete review of cationic demand titration methods. For example, procedures related to colorimetric and conductometric methods of endpoint determination were merely mentioned, with no consideration of possible interferences or challenges related to interpretation of results. However, it still can be useful to summarize some key points that ought to improve the reliability of charge demand data in general:
The first key point is to select a test device and procedure based on what kind of information you want from the test. If you want cationic demand information, then it makes best sense to use a streaming current or colorimetric titration procedure. Other types of detection schemes can be used, including streaming potential, microelectrophoresis, and conductometric titrations, also can be used as reference methods, to check your results. But the latter methods are usually considered to be more tedious, in terms of routine testing, compared to
streaming current and colorimetric charge demand tests. By contrast, if you want to monitor changes in the electrokinetic potential of fibers, then streaming
potential measurements are highly recommended. Likewise,
micro-electrophoresis is the recommended way to determine the zeta potential of fine particulate matter.
should be minimized. At the very least, any filtrations of the samples ought to be done immediately when samples are collected, since charge decay phenomena tend to be much less pronounced in the absence of fibers. Another way to minimize delays is by implementation of an online titration system.
Other procedures that need to be considered with care include whether or not samples are diluted by a factor of ten with distilled water, whether the pH is adjusted, whether the titrations are carried out in a forward or reverse direction (after adding an excess of polymer of one sign of charge), and whether there are certain ingredients in a typical sample that tend to interfere with a certain type of charge demand procedure.
The third point is to verify that the tests are giving reliable results. Ideally, such verification tests need to be done only once or twice, as long as there are no major changes in the chemical nature of the system. Microelectrophoresis tests have long been recommended as possibly the best kind of reference measurement, having the best reliability and the fewest problems related to theory [16,42]. Finally, when testing a new kind of sample, especially if the conductivity is higher than 1000 µS/cm, it is recommended to follow the “10X dilution” rule: After carrying out one titration on as-received filtrate from the system, the next sample is diluted 10X with distilled water, and the results are multiplied by the same factor. If your calculated cationic demand for the diluted sample changes dramatically compared to tests of an “as-is” sample, then it is recommended to always use ten-fold dilution with distilled water when testing that type of sample.
Literature Cited
1. Hubbe, M. A., “Selecting and Interpreting Colloidal Charge Measurements,” in “Proc.Scientific & Technical Advances in Wet End Chemistry,” Barcelona, Spain, PIRA Intl., Leatherhead (2000).
2. Bley, L., “Latest Experiences of On-line Charge Measurement: A Process Control Concept,” Pulp Paper Can. 99 (5): T165-T169 (1998).
3. Denbrok, C., and Peacock, B., “Wet-End Charge Measurement using Streaming Current Online Titrators,” Tappi J. 82 (10): 57-59 (1999).
4. Chen, J., Hubbe, M. A., and Heitmann, J. A., “Measurement of Colloidal Charge in the Paper Mill by Streaming Current,” TAPPI 2001 Papermakers Conf.,
electronic document, TAPPI Press, Atlanta.
6. Hubbe, M. A., and Chen, J., “Charge-Related Measurements – A Reappraisal. Part 1: Streaming Current,” Paper Technol. 45 (8): 17-23 (2004).
7. Sanders, N. D., and Schaeffer, J. H., “Comparing Papermaking Wet-End Charge-Measuring Techniques in Kraft and Groundwood Systems,” TAPPI J.
78(11): 142-150 (1995).
8. Padovani, E., and Colasurdo, A. R., “Online Real-Time Measurement Reduces Wet-End Variability,” Pulp Paper 69 (4): 57-62 (1995).
9. Miyanishi, T., and Shigeru, M., “Optimizing Flocculation and Drainage for Microparticle Systems by Controlling Zeta Potential,” Tappi J. 80 (1): 262-270 (1997).
10. Hubbe, M. A., and Wang, F., “Charge-Related Measurements – A
Reappraisal. Part 2: Fiber-Pad Streaming Potential,” Paper Technol. 45 (9): 27-34 (2004).
11. Hunter, R. J., Foundations of Colloid Science, Clarendon Press, Oxford, 1987.
12. Farley, C. E., “Microelectrophoresis as a Wet End Chemistry Teaching Tool,”
Proc. TAPPI 1992 Papermakers Conf., 509-512, TAPPI Press, Atlanta, 1992.
13. Pelton, R., Miller, P., McPhee, W., and Rajaram, S., “Strategies for
Improving Electrophoresis Data from Coulter DELSA,” Colloids Surf. A 80 (2-3): 181-189 (1993).
14. Sanders, N. D., and Roth, K. J., “Combining Charge Distributions and Heats of Interaction to Probe Filled Papermaking Furnish Flocculation Mechanisms,”
Tappi J. 76 (11): 209-214 (1993).
15. Vanderhoek, N., “Optimizing Paper Machine Performance through Electrokinetic Measurement,” Appita47 (5): 397-401 (1994).
16. Strazdins, E., “Critical Issues in Applying Electrokinetics to Papermaking,”
Tappi J. 78 (8): 115-119 (1995).
17. Halabisky, D. D., “Wet-End Control for the Effective Use of Cationic Starch”
Tappi 60 (12): 125 (1977).
18. St. John, M. R., and Gallagher, T., “Evaluation of the Charge State of Papermachine Systems Using the Charge Titration Method,” Proc. TAPPI 1992
19. Rice, M., and Roeraade, J., “Continuous Filtration and Titration Apparatus for Real Time Monitoring of Polyelectrolyte Concentration and Cationic Demand of a Paper Furnish,” Nordic Pulp Paper J. 18 (1): 95-107 (2003).
20. Lindgren, J., Öhman, L.-O., Gunnars, S., and Wågberg, L., ”Charge Determinations of Cellulose Fibers of Different Origin – Comparison between Different Methods,” Nordic Pulp Paper Res. J. 17 (1): 89-96 (2002).
21. Strazdins, E., “Application of Electrokinetics in Optimization of Wet-End Chemistry,” in Wet-Strength Resins and their Application, L. L. Chan, Ed., TAPPI Press, 1994, Ch. 4.
22. Hubbe, M. A., “Method for Determining Electrokinetic Properties of Papermaking Furnish,” U.S. Patent 6,176,974, Jan. 23, 2001.
23. Wang, F., and Hubbe, M. A., "Development and Evaluation of an Automated Streaming Potential Measurement Device," Colloids and Surfaces A,194: 221-232 (2001).
24. Wang, F., and Hubbe, M. A., "Charge Properties of Fibers in the Paper Mill Environment. 1. Effect of Electrical Conductivity," J. Pulp Paper Science28 (10) 347-353 (2002).
25. Laine, J., and Lindström, T., “The Colloid/Polyelectrolyte Titration Technique – A Review and an Appraisal of the Technique,” Proc. EC/COST E14 Workshop: New Measurement Techniques for Monitoring White Water Chemistry in
Papermaking, Lisbon, 2000.
26. Chen, J., Heitmann, J. A., and Hubbe, M. A., “Dependency of Polyelectrolyte Complex Stoichiometry on the Order of Addition. 1. Effect of Salt Concentration during Streaming Current Titrations with Strong Poly-acid and Poly-base,”
Colloids Surf. A 223 (1-3): 215-230 (2003).
27. Stone, J. E., and Scallan, A. M., “A Structural Model for the Cell Wall of Water-Swollen Wood Pulp Fibers based on their Accessibility to
Macromolecules,” Cellulose Chem. Technol. 2 (3): 343-358 (1968).
28. Berthold, J., and Salmén, L., “Effects of Mechanical and Chemical
Treatments on the Pore-Size Distribution in Wood Pulps Examined by Inverse-Size-Exclusion Chromatography (ISEC),” J. Pulp Paper Sci. 23 (6): J245-253 (1997).
30. Alince, B., and van de Ven, T. G. M., “Porosity of Swollen Pulp Fibers Evaluated by Polymer Adsorption,” in Baker, C. F., Ed., The Fundamentals of
Papermaking Materials, Vol. 2, 771-788, Pira International, Leatherhead, Surrey,
UK, 1997.
31. Viovy, J. J., “Electrophoresis of DNA and Other Polyelectrolytes: Physical Mechanisms,” Rev. Modern Phys. 72 (3): 813-872 (2000).
32. Pelton, R., “A Model of the External Surface of Wood Pulp Fibers,” Nordic
Pulp Paper Res. J. 8 (1): 113-199 (1993).
33. Neuman, R. D., “Surface Force Measurement in Papermaking Systems,” in Baker, C. F., Ed., Products of Papermaking, Vol. 2, 969-1021, Pira, Leatherhead, Surry, UK, 1993.
34. Penniman, J. G., “Comparison of Pulp Pad Streaming Potential
Measurement and Mobility Measurement,” Tappi J. 75 (8): 111-115 (1992).
35. Koethe, J. L., and Scott, W. E., “Polyelectrolyte Interactions with
Papermaking Fibers: the Mechanism of Surface-Charge Decay,” Tappi J. 76
(12): 123-133 (1993).
36. Farley, C. E., “Factors Influencing the Rate of Charge Decay,” Tappi J. 80
(10): 177-183 (1997).
37. Marton, J., “The Role of Surface Chemistry in Fines – Cationic Starch Interactions,” Tappi J. 63 (4): 87-91 (1980).
38. Marton, J., and Marton, T., “Wet End Starch: Adsorption of Starch on Cellulosic Fibers,” Tappi 59 (12): 121-124 (1976).
39. McCormick, C. L., Blackmon, K. P., and Elliott, D. L., “Water-Soluble Copolymers,” Polymer 27 (12): 1976-1980 (1986).
40. Kathmann, E. E., White, L. A., and McCormick, C. L., “Water-Soluble Copolymers,” Macromol. 29 (16): 5273-5278 (1996).
41. Chen, J., Hubbe, M. A., and Heitmann, J. A., “Measurement of Colloidal Charge in the Paper Mill by Streaming Current,” Proc. TAPPI Papermakers Conf., 2001.