HERITABILITY AND PHOTOTAXIS I N DROSOPHILA MELANOGASTER
NORTIN M. HADLER
Department of Biology, Yale University, N e w Haven, Connecticut
Received June 22, 1964
F O R decades the ground base of genetics has been the acceptance of the princi- ple that the appearance, morphology, and physiology of any plant or animal is causally related to that organism’s genotype and its interaction with its en- vironment. However, the possibility that the same viewpoint is equally applica- ble to the organism’s behavior has only recently been explored. In fact, the demonstration that behavior is a function of two independent variables, the geno- type and the environment, is in contradistinction to the historical tendency in behavioral science to assume homogeneity of behavioral expression over the individuals or species under investigation. It is increasingly apparent that the variability of behavior is as universal a fact as is genetic variability.
The behavior of Drosophila melanogaster, indeed of the order Diptera, which was classically stereotyped as negatively geotaxic and positively phototaxic, has recently been shown to be plastic. HIRSCH (1959) developed a “multiple unit classification maze” for the mass screening of D. melanogaster for geotaxis. This maze is essentially a physical realization of the mass screening scoring technique
(HIRSCH
and TRYON 1956) and affords an objective, automatic and reliable means of assessing the geotaxic response of populations of D. melanogaster. Using these mazes HIRSCH and his colleagues were able to demonstrate and measure the variability of the geotaxic response (HIRSCH 1959) and to assess the contri- bution of each chromosome to the behavioral response (ERLENMEYER-KIMLING, HIRSCH a7d WEISS 1962; HIRSCH and ERLENMEYER-KIMLING 1962).Phototaxis in Drosophila is equally amenable to an experimental behavior- genetic approach (HADLER 1964; HIRSCH and BOUDREAU 1958; MBDIONI 1963). I n the present paper, selection and hybridization experiments are described lead- in? to an analysis of the heritability of this behavior. By adhering to a definition
of heritability in the restricted sense, the behavior, phototaxis, is shown to be clcfincd by the experimental design.
MATERIALS A N D METHODS
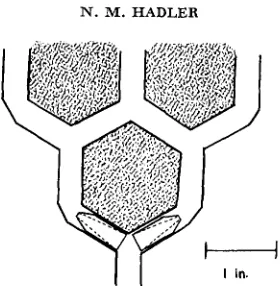
The two photomazes used in the present experiments have been described previously (HADLER 1964). They consist of an arithmetic progression of consecutive Y-units in a horizontal plane (Figure 1). The mazes are so constructed that when illuminated from above, the alleys are in darkness with the exception of the “light” arm of each Y-unit. A “Plexiglas” cone is inserted in each arm of a Y-unit to minimize retracing (HIRSCH 1959).
1270 N. M. HADLER
FIGURE 1 .-Diagramatic representation of the hexagonal structural unit of the photomazes. Alleys are formed by glueing black nylon hexagons (rubber in the case of Maze I) onto a sheet of lucite. Lucite cones are inserted in each arm of a Y as shown.
tube into which a fly emerges establishes how many light or dark choices it has made in passing through the maze. A fly emerging into Tube 0 has made 15 consecutive light choices; into Tube 1, 14 light choices and one dark choice;
. . .
into Tube 15, fifteen consecutive dark choices. In this fashion the population is screened and its distribution in the collecting tubes. described in terms of its mean (photoscore) and variance, is a measure of its phototaxic response.Two photomazes are now being used f o r separate selection experiments. The mazes are not structurally identical. To increase the difference between the two mazes, a double-bulb circular fluorescent fixture illuminates the surface of Maze 11, at about 300 apparent foot candles, a single bulb fixture illuminates the surface of Maze I.
I t is necessary to maintain environmental controls in a behavioral study; it is even more important to describe as fully as possible the environment used to elicit the behavior under study. This point can not be overemphasized and will be dealt with in the DISCUSSION. Such factors as mechanical stimulation, rearing conditions, age at time of trial, temperature and humidity, light and the effects of gravity and diurnal rhythms are maintained constant during this experiment. For a detailed description of these controls, see HADLER 1964.
The selection and hybridization experiments described in this paper involved over 45,000
flies. A foundation population was established in 1961 i n a population cage from equal numbers of Formosa, Syosset and Capetown strains of D. melanogaster provided through the generosity of PROFESSOR TH. DOBZHANSKY. A sample containing 200 males and 200 females was drawn from this wild-type population and screened through the given maze. The 60 females and 60 males from whom the strongest photopositive response had been elicited were mated to establish the “light” (Lt) line. This was effected in six half-pint culture bottles ranked 1 through 6. Ten males and ten females were allocated to each bottle in such a fashion that the bottle rank corre- sponded to the response intensity, i.e., the ten most photopositive pairs were mated in Bottle 1. The “dark” line (Dk) was established in similar fashion from the photonegative end of the wild- type distribution.
By this procedure separate “dark” and “light” lines were established for Maze I and f o r Maze 11, i.e., four separate, noninterbreeding populations. In succeeding generations, samples of 200 females and 200 males were drawn from the culture bottles, starting with Bottle 1. These samples were screened through the appropriate maze, and the extreme 60 males and 60 females from each strain were mated
RESULTS
HERITABILITY A N D PHOTOTAXIS 1271
TABLE 1
Selection data
\‘laze I Maze I1
Light Dark Light Dark
Female Male Female Male Female Male Female Male
G17 GI9 G20 G21 G22 G23 G24 G25 G26 G27 G28 G29 G30 4.45 4.22 222 2.83 3.70 193 1.91 2.81 207 2.11 3.17 21 1 1.43 1.97 227 2.27 3.39 227 2.55 4.43 21 2 1.94 2.72 213 1.28 1.49 22 1 1.61 2.55 222 3.08 4.06 197 3.45 3.93 187 2.00 2.59 189 3.94 5.4.8 204 3.11 4.98 166 1.75 2.70 198 1.94 3.65 166 2.05 4.01 188 2.00 3.14 220 2.60 4.72 Z 98 1.81 2.72 197 1.11 1.88 208 1.45 2.55 21 6 2.33 3.60 187 2.83 4.31 162 1.93 3.01 200
11.54 12.63 5.47 3.52
115 96
12.19 12.61 3.78 3.61 165 123 11.99 11.99 3.75 5.23 212 177 11.71 12.11 5.35 4.50 204 166 12.37 12.82 3.76 2.67 213 198 11.39 12.03 4.90 5.63 219 202 12.75 12.44 3.06 3.88 217 207 12.71 12.65
3.23 2.78 225 223 10.27 10.68 6.66 5.51 215 199 11.87 11.84 4.74 5.94 203 184 12.57 12.91 3.46 4.79 167 162 11.68 11.77 3.36 3.26 180 161 13.44 13.26 1.97 2.33 224 190 Wild-type controls
Maze I
- Female Male
-
X 7.88 t_ .58 8.70 -C .63
0 2 6.03 t 1.31 6.55 ir .99
- 4.00 4.31 201 3.95 3.91 214 4.27 5.33 210 3.39 4.75 213 3.46 5.26 21 1 2.71 3.79 224 3.41 6.18 226 3.08 4.62 21 1 2.1 1 3.20 200 2.14 2.96 221 3.00 4.80 21 1 3.93 6.44 215 3.70 3.79 209 4.85 5.49 176 5.14 5.09 207 4.68 4.87 195 4.11 4.46 159 4.40 6.63 197 2.58 2.87 208 3.81 6.77 215 3.50 5.57 208 1.86 2.31 200 2.20 3.11 219 3.37 5.30 218 4.06 6.01 199 3.33 4.69 200
11.28 12.21 5.83 4.84 186 174 10.68 11.52 5.77 4.92 174 157 10.70 11.70 6.50 5.90 202 179 10.57 10.99 4.01 4.14 203 175 10.50 11.68 5.55 3.89 201 186 11.90 12.17 5.20 4.16 218 216 12.90 12.83 3.58 3.46 125 129 12.10 12.55 4.11 3.79 183 166 10.26 11.55 4.18 3.46 218 194 11.56 11.49 5.05 5.68 220 197 11.96 12.99 4.89 4.52 212 199 12.38 12.51 2.84 2.97 211 204 13.15 13.34 2.64 2.09 234 209
Maze I1
Female Rfale
1272 N. M . HADLER
given in Table 1. Included in Table I are the results of nine wild-type control populations tested with Maze I and nine tested with Maze 11. The averages of the means of these trials, averages of the variances and their respective standard errors are presented. The course of selection as indicated by the photoscore can be followed over 30 generations in Figure 2 for Mazes I and 11. All strains have significantly diverged from the appropriate wild-type controls.
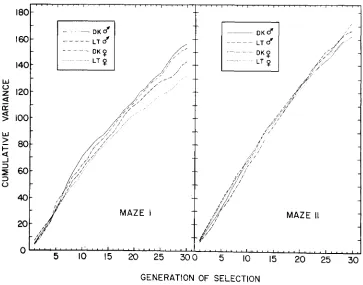
I n Figure 3, cumulative variance is plotted as a function of generation of selec- tion for Mazes I and 11. These curves are meaningful only as a qualitative study of the change in variance as a function of the generation of selection and the
w
[r
0
U
0
b-
0
I
P ?
0
I 4 7 IO 13 16 19 22 25 28 31
GENERATION OF SELECTION
H E R I T A B I L I T Y A N D P H O T O T A X I S 1273
stability of the rate of change of variance. After G8, the curves for the Maze I strains are roughly parallel and decreasing in slope. This is to say that the size of the variance is decreasing as a function of generation of selection at a rate that is relatively constant over strain and sex. The curves for Maze I1 reveal a differ- ent phenomenon. There is little stability in the response of the variance to selec- tion, particularly for the light strain. These curves qualitatively resemble those constructed from the data obtained during the first eight generations of selection in Maze I.
When the variance of the selected population approaches the standard error
of the variance of the wild-type population, selection will reach a limit as the mazes no longer discriminate among individuals. The asymptotes thus defined (HADLER 1964) are now being strongly approached. In an ideal instrument, selection should proceed to isogenicity in each strain and sex, barring heterosis. That this is not the case was demonstrated by the effectiveness of reverse selec- tion (started at G27) in forcing the photoscore and variance back toward the appropriate wild-type control.
In an isogenic strain, the observed variance is dependent solely on the environ- ment. The wild-type variance is dependent on both the genome and the environ-
180-
160-
I40 -
W
g
120-3
100-9
a
W
l-
-1
2 80-
a
6 0 -
0
MAZE II
GENERATION OF SELECTION
1274 N. M. HADLER
ment. Heritability (h') can be computed by the following formula based on the above two statements: h2 = (U: - U,")/O: where U: is the wild-type variance and U: is the variance of a n isogenic line.
The variances of the strains of G30 are approaching the limits of selection of the mazes. It follows that these variances are approaching the variances charac- teristic of isogenicity in these strains. It is therefore possible to make a conserva- tive, lower-limit estimate of heritability. There is no statistically significant sexual dimorphism in behavior in any of the G30 strains. Since the variances of the Lt and Dk strains (sexes combined) for each maze are significantly different at the
5
percent confidence level, heritability estimates must be calculated sepa- rately for the two mazes. The following are the lower-limit estimates of herita- bility: Maze I Lt: h2 = .564; Maze I Dk: h2 = .658; Maze I1 Lt: h' = .412; Maze I1 Dk: h2 = .668.Table 2 presents the results of a preliminary hybridization analysis. Several trends are apparent in these data. In the reciprocal crosses, the offspring, par- ticularly the daughters, of Lt females are characteristically more photopositive than the offspring derived from Dk females, in both mazes and in all hybridiza- tion generations. Thus the X chromosome appears to be implicated in the dis- cussion of heritability. A significant increase is observed in the F2 variances over the F, variances with no significant difference between the
F,
and F, vari- ances. The observed trend in variance across the F,, Fa and F, is expectedTABLE 2
Hybridization analysis: Statistical constants for F,, F,, and F ,
Dk female X Lt male Lt female X DK male
Female and male Female and male
F Female Male combined Female Male combined
I 21 6.60 6.81 5.85 6.72 6.23 6.77 5.55 5.78 7.06 10.05 I 25 5.94 7.05 7.60 8.71 6.77 7.88 5.64 7.41 7.38 6.53
6.27 6.73 6.50 5.60 6.22
6.93 7.72 7.32 6.59 8.28
I 21 5.59 12.03 6.12 13.68 5.86 12.86 . . . .
I 25 6.96 8.99 6.70 10.00 6.83 9.49 4.85 9.79 6.11 9.95
6.27 6.41 6.35 . .
10.51 11.84 11.17 . . . . . .
I 25 9.07 8.76 9.61 8.36 9.34 8.56 8.55 10.29 8.79 9.81 I1 21 6.89 7.71 9.14 6.47 8.02 7.09 6.81 6.61 8.39 8.03 11 25 6.27 12.20 7.79 11.94 7.03 11.07 6.07 8.64 5.96 6.98
6.58 8.47 7.52 6.44 7.17
9.95 9.20 9.08 7.63 7.51
I1 25 7.77 11.91 7.84 9.69 7.80 10.79 5.56 12.37 6.80 10.97 I1 25 9.60 9.30 9.43 10.30 9.52 9.80 8.17 11.33 7.95 10.95
6.31 7.92 5.51 6.97 5.91
7.45 5.48 9.87
8.67 10.15 7.60 7.32 6.02 7.81 6.81
HERITABILITY A N D PHOTOTAXIS 1275 (ERLENMEYER-KIMLING et
d.,
1962; MATHER 1949) and tends to rule out cyto- plasmic inheritance as a factor to consider in the discussion of heritability.DISCUSSION
The degree to which the present selection experiment is effective depends upon the reliability of the phenotype as a measure of the genotype.
If
the environment is kept constant, any permanent change in the behavioral response of the ~ O P U -lation may be attributed to a change in its genetic composition. Both the extent to which selection has been effective, and the gradual and prolonged divergence of the strains demonstrate that a polygenic system is involved in the expression of phototaxic behavior. The hybridization analysis suggests the involvement of the X chromosome in this polygenic system.
Heritability can be briefly defined as “the proportion of the trait variance in a specified population which is determined by the genotypic variation in that popu- lation” (FULLER and THOMPSON 1960, p. 62). If this definition is to be meaning- ful the concept of “trait variance” must be understood. Behavior is the observed response of an organism to a particular stimulus environment. The trait variance in the population is dependent both on the genotypic variability of that population and on the environmental variance. This dependence is described most succinctly by its effects on heritability. For instance, the same trait variance could be achieved by reducing the genotypic variability (as in the case of selection ex- periments) and increasing the environmental variance, or vice versa. In the first instance, heritability would be lowered, while in the second it would be increased. Moreover, if the same population were exposed to two different stimulus environ- ments and different behavioral responses were elicited, there is no reason to assume that the genetic components of the two elicited responses are identical, i.e., involve the same components of the genome. This would be true even for the unusual case when the heritability estimate was the same for both responses.
1276 N. M. HADLER
11. For this reason, a lower-limit estimate of the heritability of each behavior is given in RESULTS. Heritability is not a characteristic or correlate of a behavior
per se. It is a characteristic of a particular population with respect to a particular behavior, in a given environment.
One common characteristic of research in experimental behavior genetics is the fact that results can not be quantitatively reproduced. Even if one were to use the same mazes and foundation population, two insurmountable obstacles would remain: the necessity of duplicating the temporal variations in the micro- environment and the error incurred in sampling populations. The reliabiIity of the sampling technique can be estimated by the formula : r- = (uOz - U , ~ ) / U ~ ~ ,
where uO2 is the wild-type variance and ue2 is the standard error of the wild-type variance. For this experiment the reliability in sampling was about 85 percent.
The author gratefully acknowledges his indebtedness to PROFESSOR D. F. POULSON for valuable consultation and for providing laboratory space and facilities and to DRS. L. ERLENMEYER- KIMLING and DAVID SEEGAL for valuable consultation. This work was supported by National Science Foundation (URP) Awards administered through Yale University.
SUMMARY
Two different multiple Y-unit mazes, which permit the assessment of the mean and variance of the phototaxic behavior in Drosophila populations, have been used for separate 30-generation selection experiments and hybridization analyses. The behavior is shown to be dependent upon a polygenic system in which the
X
chromosome is implicated.
Heritability is not a characteristic of a behavior per se, but of a particular p o p - lation with respect to a particular behavior elicited by a particular stimulus en- vironment. Therefore no one behavior-"phototaxis"-is analyzed with this approach. Four behaviors are studied: photopositive and photonegative behavior in Maze I and photopositive and photonegative behavior in Maze 11. The lower- limit estimates of the heritability of these behaviors are 0.564, 0.658, 0.412 and 0.668, respectively.
LITERATURE CITED
ERLENMEYER-KIMLING, L., J. HIRSCH, and J. M. WEISS, 1962 Studies in experimental behavior genetics. 111. Selection and hybridization analyses of individual differences in the sign of geotaxis. J. Comp. Physiol. Psychol. 55: 722-731.
FULLER, J. L., and W. R. THOMPSON, 1960 HADLER, N. M., 1964
HIRSCH, J., 1959
Behavior Genetics. Wiley, New York.
Genetic influence on phototaxis in Drosophila melanogaster. Biol. Bull. Studies in experimental behavior genetics. 11. Individual differences in geotaxis as a function of chromosome variation in synthesized Drosophila populations. J. Comp. Physiol. Psychol. 52 : 304-308.
Studies in experimental behavior genetics. I. The Herit- ability of phototaxis in a population of Drosophila melanogaster. J. Comp. Physiol. Psychol. 51: 647-651.
Studies in experimental behavior genetics. IV. 126: 264-273.
HIRSCH, J., and J. C. BOUDREAU, 1958
HIRSCH, J., and L. ERLENMEYER-KIMLING, 1962
H E R I T A B I L I T Y A N D PHOTOTAXIS 1277
Mass screening and reliable individual measurements in the HIRSCH, J., and R. C. TRYON, 1956
MATHER, K., 194Q
M~DIONI, J., 1963
experimental behavior genetics of lower organisms. Psychol. Bull. 53 : 402-410.
Biometrical Genetics. Methuen, London, England.