GENETICS
OF BEHAVIOR:
SELECTIONFOR
MATING ABILITY IN CHICKENSP. B. SIEGEL
Virginia Polytechnic Institute, Blacksburg
Received August 3, 1965
MATING behavior in animals is complex and determined by diverse genetic and environmental factors. As one aspect of this behavior, mating frequency in chickens has received considerable attention (
UPP
1928; WOOD-GUSH 1956; MCDANIEL and CRAIG 1959; SIEGEL 1959; CARBAUGH, SCHEIN and HALE 1962;JUSTICE,
MCDANIEL and CRAIG 1962). These reports, while not in agreement on the best procedures for the study of this component of sexual behavior, were con- sistent in showing that it was highly variable.Although phenotypic variation is large, data are available to suggest a genetic basis for mating frequency and sex-drive in chickens. For example, GUHL (1951 ) found significant differences among males f o r mating frequency. Differences
have been noted among sire families (WOOD-GUSH and OSE~QRNE 1959) and inbred lines (SIEGEL 1959). A repeatability estimate of .31 was obtained
by
SIEGEL (1960a) for the number of completed matings made in 10-minute observation periods. Further, some progress in the separation of lines by selection for sex-drive has been reported by WOOD-GUSH (1958, 1960) and TINDELL and ARZE (1965).The present study was designed to measure the effects of mass selection in divergent directions for mating frequency at 31 to 34 weeks of age. Information was sought on the inheritance of this trait and its relationship with unselected characteristics.
MATERIALS A N D METHODS
The selected trait: The characteristic studied was the cumulative number of completed mat- ings by males in eight 10-minute observation periods hereafter referred to in this paper as CNCM. The tester females were Athens-Canadian randombreds (HESS 1962), the same age as the males, maintained in twenty-four 4 ft x 8 ft pens (eight pullets per pen). Males were maintained either in all-male flocks or in individual cages where females were visible to them. In the late afternoon each male was placed singly, for a 10-minute period in a pen of females. The number of completed matings accomplished was recorded for each male during this period. Upon comple- tion of the observation period he was returned to his home pen or cage. This procedure was re- peated eight times during the three week period when the males were from 31 to 34 weeks of age. The order of testing and assignment of males to flocks of females was at random and no male was tested more than once i n a single day.
Foundation stock, management, and selection procedures: Progeny for each generation were obtained from two hatches, the first and third Tuesday in March. Chicks for the foundation generation were from a single hatch, the first Tuesday in March. Each generation a sample of eggs was obtained from the Athens-Canadian Randombred population and incubated with those
1270 P. B. S I EG EL
from the selected lines. Chicks from these eggs were grown with the selected lines and measure- ments obtained for the same characteristics.
On the 22nd day of incubation chicks were remcwed from the hatcher, pedigreed and placed in floor pens with a hot-air brooding system. Temperature, humidity and lighting were controlled so as to provide environmental conditions that were as similar as possible among pens. The same ration (SIEGFL 1%2a) was fed until measurements were obtained for the selected trait.
Foundation stock consisted of chicks from a sample of eggs obtained from the Athens-Canadian Randombred population. From this gene pool two lines were selected on the basis of cumulative number of matings completed i n eight 10-minute observation periods. Males with a high fre- quency of completed matings formed the parent stock for the high mating line (HML) whereas those with the lower frequency were used to sire the low mating line (LML)
.
Thereafter, mass selection was practiced within each line for the single characteristic, CNCM.Within each line, ten males were selected to reproduce the subsequent generation. Males were mated to four females selected at random from the same line. Pullets were assigned at random to the individual cockerels with the restriction that full- or half-sibs would not be mated together. Thus, the average rate of inbreeding per generation was less than 2% according to WRIGHT’S (1930) formula: ‘/s N ,
+
l/s N , . Using the effective number of sires and dams the average inbreeding coefficient in the F, generation was .11. Reciprocal crosses of the selected lines were made in the F, generation. Progeny from these crosses were compared with each other and to offspring of the parental lines in the F, generation.Unselected traits: Unselected characteristics were measured by the following methods: breast angle ( SIEGEL 1962b), relative aggressiveness (SIEGEL 1960b), semen characteristics ( SIECEL 1963), and courts, mounts and treads (GUHL 1961). Ages, in weeks, when measurements were obtained were: breast angle, 8; relative aggressiveness, 20 to 22; semen, 29 to 31 ; COUrt5, mounts and treads, 31 to 34.
Analyses: Differences between lines f o r the selected and unselected characteristics were deter- mined within generations by analysis of variance utilizing a completely randomized design.
For the selected trait the realized effects of selection were used each generation to obtain the heritability of CNCM. Since selection was on the sire side only and females were selected at random the formula used was h2 = 2(AO/AP), where A 0 was the difference between the means of the unselected male off-spring of the high and low line and A P was the cumulative selection differential. Heritability for the selected trait was also estimated from full- and half-sib correla- tions (KING and HENDEFSON 1954). The statistical model used was X h r j k = fi + I h
+
shi -k dhij+
ehiik, where X h z i k was the cumulative number of matings of the kth offspring of the jth dam mated to the ith sire within the hth line.Genetic correlations ( r G G , ) between CNCM and unselected characteristics were computed for six generations of selection by the method outlined by FALCONER (1954a). The formula is
reo, = (AG’) ( h ) (u,)/(AG) (h’) ( u p , ) , where AG and AG are the genetic changes in the selected and unselected traits, respectively, h and h’ the square roots of their heritabilities and up and up,
their phenotypic standard deviations. Phenotypic correlations between the selected and unselected characteristics were computed each generation, transfonned to z values (SNEDECOR 1946) and and average correlation obtained.
R E S U L T S A N D D I S C US S I ON
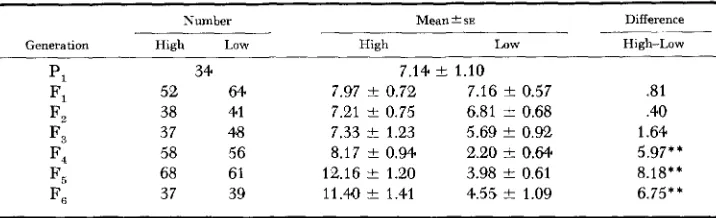
Eflects of selection: The response of CNCM to bidirectional mass selection is
shown by generations in Table 1 and Figure 1. Population means for the selected lines were adjusted each generation for environmental fluctuations as evidenced
by the random-mating control population. No significant differences were found between means of the selected lines in the first three generations, but in tl:e F,
and subsequent generations differences were highly significant.
TABLE 1
Numbers and means* of unselected males b y lines and generations for the selected trait
Difference
Generation High Low High Low High-Low
I _ _ _
Number Mean C SE
PI 34 7.14 -+ 1.10
Fl 52 64 7.97 t 0.72 7.16 !c 0.57 .81
F2 38 41 7.21 +- 0.75 6.81 t 0.68 .40
F3 37 4.8 7.33 -C 1.23 5.69
*
0.92 1.64F, 68 61 12.16 C 1.20 3.98 t 0.61 8.18**
Fe; 37 39 11.41) t 1.41 4.55 t 1.09 6.75**
F4 58 56 8.17 -C 0.94 2.20 i Q.64 5.97**
* Adjusted to random mating controls.
H i g h z h i g h line; Low=low line. " p < . O l .
general discussions of the problem have been presented by MATHER (1949) and FALCONER (1960). MATHER (1949) pointed out that no scale may be regarded as having special theoretical merit, because it is seldom known at what scale genes influence a trait. Further complications arise because the scale may differ among populations and the investigator may be interested in both additive and non- additive genic effects. Thus, a scale should be chosen which is most suitable for a description of the experimental situation.
FALCONER
(1960) noted that scale effects could be eliminated from the graphical presentation of a response to selec- tion by plotting the response in the form of realized heritabilities. This was done for the part of this paper where response was plotted against selection differentials.P .io .03 .oe .?.I .?.I .I e
pl Fi F?. Fa F4 Fe FO
I I I 1 I
0
GE NE RATIONS
1272 P. B. SIEGEL
A positive correlation between means and variances was found for CNCM
(Table 1). These could result in an expectation that the response, per generation, would increase with the progress of selection in the HML and decrease corre- spondingly in the
LML.
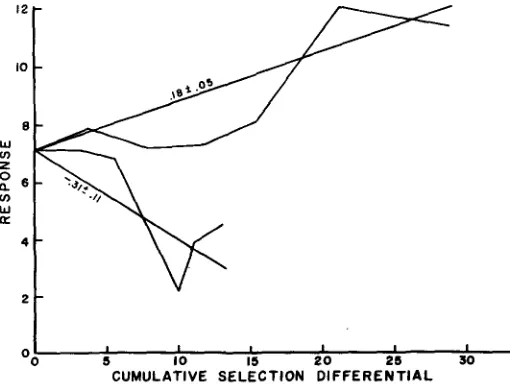
The regression of numbers of matings on generations was .79 +- .26 for the HML and -.67 t .25 for the LML (Figure 1). The slightly larger regression for the HML might be expected from the correlation of means and variances, however, the regressions were of sufficiently similar magnitude to suggest that the response was symmetrical in time. The mean of the reciprocal crosses (denoted by x in Figure 1) between the selected lines was intermediate to the parental lines and of a magnitude similar to that of the control population providing further evidence of a symmetrical response in time. The regression of the divergence between the selected lines was 1.45 +- .30 CNCM per generation.The actual divergence was less than that predicted by regression in each of the first three generations and suggests that divergence may not have been linear throughout.
The mean response for the high and low lines were plotted against the selection differential (Figure 2). The average response in the upward and downward directions per unit of selection was estimated by a regression line fitted to each set of points. The ratio of response to selection as measured by the regression coefficient has been called the realized heritability by FALCONER ( 1954b).
The realized heritability for the divergence of the two selected lines was .20 * .04 which demonstrates a significant amount of additive genetic variation. Herit- abilities of CNCM were estimated each generation from full- and half-sib corre- lations. Such heritabilities have large sampling errors when the number of sires, dams and progeny are small (ROBERTSON 1959) as in this experiment. For this reason the heritability estimates for the six filial generations were averaged. The
OO
I
S 10 I S 2 0 25 30CUMULATIVE SELECTION D I F F E R E N T I A L
average estimate based on paternal half-sib correlations, which includes additive effects was .15 a value similar to the realized heritability. The heritability esti- mate based on maternal half-sib correlations, which in addition to additive effects, includes some epistatic and all dominance and maternal effects, was .52 suggest- ing that these factors influenced the selected trait. The heritability estimate based on full-sib correlations is simply the average of that obtained from paternal and maternal half-sib correlations and was .33. It thus appears that both additive and nonadditive gene action influences CNCM in these lines. While this information is of general importance, it is also necessary to look at each selected line separately to determine if the gene action is similar in both directions and if comparable responses can be obtained in each line.
The realized heritability for CNCM was .I8
*
.05 when selection was for a large number of matings and .31*
.I1 when selection was for a small number of matings (Figure 2), indicating a considerably lower heritability for the HML than for the LML and an asymmetrical response to selection. Earlier, however, it was noted that the response in the two lines appeared to be essentially sym- metrical when plotted in time. This inconsistency is easily resolved by inspection of Figure 2 which shows a lower selection intensity and a higher heritability in the LiVL than in theHML.
Since response is a function of heritability and selec- tion pressure, the symmetrical response noted to the F, generation was a result of a greater selection pressure in theHML
and a higher heritability in the LML. During the early generations the response obtained was less than that which would have been predicted from the realized heritabilities. The existence of this in each line is shown in Figure 2. While this may have been due to chance, con- sideration should be given to other reasons. These could be intra- and interallelic interactions such as epistasis and linkage.If
such genetic equilibrium systems exist several generations of selection might be necessary to break these down before there would be much response to selection. Further experimentation, par- ticularly with populations where there was no prior history of artificial selection f or the trait being selected, would be necessary to determine if this is a general phenomenon. Similar cases have been observed in chickens by KRUEGER (1965) and WILSON (1965).Presentation of data by the procedure used in Figure 2 minimizes the role of selection differential and scale effects as extraneous causes of asymmetry in the response of the two lines. Generation intervals were controlled by the design of the experiment so they would not be a source of asymmetry. Inbreeding depres- sion would be unlikely as it was only .I 1 in the F, generation and in an earlier experiment SIEGEL (1959) found no inbreeding depression on mating frequency in White Rocks.
1274 P. B. SIEGEL
cult and FALCONER (1954b) has illustrated graphically how they may be con- founded in the empirical results. Unequal gene frequencies could be one of the sources of asymmetry in the present experiment. Mating ability may be con- sidered as a fitness trait and although there was no prior history of artificial selection for this trait in the initial population it is possible that there were many generations of natural selection against the alleles for a low number of matings, thereby, reducing them to low frequencies. All of these alleles would not have been lost because of certain genetic correlations discussed subsequently in this paper. Under the assumption of natural selection against alleles for low mating frequency, one would expect a more rapid response to artificial selection in the direction of the less frequent alleles provided there was a minimum of directional dominance in the opposite direction. This appeared to have occurred in this experiment.
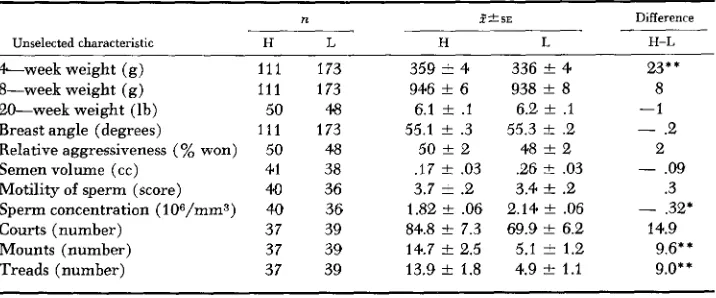
Correlated responses: Means of unselected traits and their phenotypic and genetic correlations with the selected trait, CNCM are presented in Tables 2 and 3. Body weight. A highly significant difference was found between selected lines for body weight at four weeks of age: HML males were heavier than LML males (Table 2). A significant difference between lines was observed initially in the F2 generation and has persisted at about the same magnitude since then. The mean phenotypic correlation was low, .07, whereas the genetic correlation was of a greater magnitude, being .31 (Table 3 ) .
No concomitant changes were found for body weights at either 8 or 20 weeks of age and the means in the F6 generation, as shown in Table 2 were within one standard error of each other. The mean phenotypic correlations of the selected trait with body weight at eight and at 20 weeks of age were the same, namely
-.01 (Table 3 ) . The genetic correlation of CNCM with body weight was 0.7 at eight weeks and .I 7 at 20 weeks.
TABLE 2
Numbers(n), means(%), standard errors (SE) and diflerences between
means for umelected characteristics in the F , generation
n ?&SE Difference
Unselected characteristic H L H L H-L
&week weight ( g ) 111 173 359
*
4 336*
4w**
20-week weight (lb) 50 48 6.1 & . I 6.2 t .I -1 Breast angle (degrees) 1 1 1 173 55.1 t .3 55.3 t .2 - .2 Relative aggressiveness ( % won) 50 48 50 t 2 48 t 2 2 Semen volume ( c c ) 41 38 . I 7 & .03 .26
*
.03 - .09Motility of sperm (score) 40 36 3.7 & .2 3.4 t .2 .3 8-week weight (g) 111 173 946 t 6 938 t 8 8
Sperm concentration (lO6/mm3) 40 36 1.82 t .06 2.14 & .06 - .32* Courts (number) 37 39 84.8 t 7.3 69.9 t 6.2 14.9 Mounts (number) 37 39 14.7 f 2.5 5.1
*
1.2 9.6** Treads (number) 37 39 13.9 2 1.8 4.9 t 1.1 9.0**H=high line; L=low line.
TABLE 3
Phenotypic ( rpp) and genetic ( rGG) correlations of unselected characteristics with the selected trait ( C N C M ) for six generations of selection
Unselected characteristic rm* r0,t
&week weight (9) S-week weight (9) 20-week weight (lb) Breast angle (degrees)
Relative aggressiveness (% won) Semen volume (cc)
Motility of sperm (score) Sperm concentration (106/mm3) Courts (number)
Mounts (number) Treads (number)
.07
- .01 - .01
- .01
.09
- .04 .01 .01 .60 .94 .97
.31 .07 .I7 - .I2
.os
- .38 2 3 .36 .71 3 2
-
.67* Average phenotypic correlation for generations F, to F6
t roo,= (AG’)(k) ( u p ) / ( A G ) ( W ( @ p t ) .
Breast ang2e. The mean breast angles at eight weeks of age, in the F, generation,
was 55.1 and 55.3 degrees in the high and low lines, respectively. The difference between means of .2 degrees was not significant (Table 2). During the earlier generations of selection, however, the differences were greater although the phenotypic correlations were consistently low ranging from -.05 to .06 with a mean of -.01. The genetic correlation, however, declined consistently from essen- tially -1.00 in the F, generation to -.I2 after six generations of selection. This steady decline in the genetic correlation concomitant to selection suggests that the large genetic association between breast angle and the selected trait in early generations was due to the transient effects of linkage rather than the more permanent effects of pleiotropy.
Relative aggressiveness. Selection in divergent directions for CNCM had a very
slight or no influence on relative aggressiveness as measured by initial paired encounters won (Tables 2 and 3 ) . The genetic correlation was .08 and the mean phenotypic correlation was .09. At the phenotypic level WOOD-GUSH (1958) obtained comparable results whereas MCDANIEL and CRAIG (1959) and SIEGEL
(1959) reported correlations of a somewhat higher magnitude between mating ability and relative aggressiveness. The differences in results could be due to the populations studied, age at which the traits were measured or a combination of environmental differences between experiments.
Semen characteristics. Although the phenotypic correlations between CNCM
and semen characteristics were essentially zero (Table 3), the genetic correla- tions indicate definite relationships. The genetic correlation between the selected trait and motility of spermatozoa was .23 and suggests that the selected lines may continue to diverge for this trait. Additional generations will be necessary to determine if this assumption is realized.
1276 P. B. SIEGEL
motility of spermatozoa, the genetic correlation was negative for the selected trait with volume of semen and concentration of spermatozoa, being -.38 for the former and -.67 for the latter. Selection for CNCM caused concomitant negative changes in these semen characteristics and differences between lines approached significance in the
F,
for semen volume and were significant for concentration of spermatozoa (Table2).
WOOD-GUSH
(1959) observed that low mating males produced larger volumes of semen. The divergence between lines for these un- selected traits has increased consistently with selection for CNCM and suggests pleiotropy. The combination of change in volume and concentration would influ- ence considerably the number of sperm per ejaculate. This could have countered the effects of natural selection for a high incidence of mating and thereby pre- vented the fixation of alleles in the high direction.Courts, mounts and treads: Mean phenotypic correlations for six generations
between the selected trait and
corns,
mounts and treads was .60, .94 and .97 respectively (Table 3). These values were comparable to the .66, .91 and .93 obtained by SIEGEL (1959) in a different population of birds. Genetic correlations however were of a lower magnitude than the phenotypic correlations. This sug-gests that although the mating act follows a definite sequence of court, mount, tread and completion, there are in addition to the common genes which influence any two items in the sequence, genes unique to each.
As shown in Table 2, highly significant differences between the selected lines were evident for mounts and treads but not for courts. Perhaps in subsequent generations a real difference may be found for courts. Our definition of court included both the rear approach and waltzing of which the latter is both agonistic and sexual in nature ( GUHL 1962), therefore, courts has an agonistic element whereas treads and mounts are probably purely sexual. The results here demon- strate that courting has an aggressive component trait and the sexual aspect, although important, may be secondary at the genetic level.
SUMMARY
Six generations of bidirectional mass selection were made for the cumulative number of completed matings in chickens. Realized heritabilities were .18 .05
and .31 f .ll in the upward and downward directions, respectively. Phenotypic
response to selection was small during the early generations but increased there- after, suggesting concealed genetic responses during the early generations.
Correlated responses were observed between the selected trait and other mating characteristics and concentration of spermatozoa. Such responses appeared to be absent o r of minor importance between the selected trait and aggressiveness and body weight.
LITERATURE CITED
CARBAUGH, B. T., M. W. SCHEIN, and E. B. HALE, 1962
FALCONER, D. S., 1954a
Effects of morphological variations of
Validity of the theory of genetic correlation. J. Heredity 45: 4244. Asymmetrical response in selection experiments. Symp. Genetics of Popula- chicken models on sexual responses of cocks. Animal Behav. 10: 235-243.
tion Structure, Inter. Union Biol. Sci. Naples, Ser. B, No. 15, 16-41. - 1960 Quanti- tatiue Genetics. Ronald Press, New York.
Measurable differences in mating behavior of cocks. Poultry Sci. 30: 687- 693. __ 1961 T h e effects of acquaintance between sexes on sexual behavior in White Leghorns. Poultry Sci. 40: 10-21.
-
1962 The behavior of chickens. The Behavior of Domestic Animals. Edited by E. S. E. HAFEZ. Williams and Wilkins, Baltimore, Md.HESS, C. W., 1962 Randombred populations of the southern regional poultry breeding project. World Poultry Sci. J. 18: 147-152.
JUSTICE, W. P., G. R. MCDANIEL, and J. V. CRAIG, 1962 Techniques for measuring sexual effectiveness in male chickens. Poultry Sci. 41 : 732-739.
KING, S. C., and C. R. HENDERSON, 1954 Variance component analysis in heritability studies. Poultry Sci. 41: 1439-1446.
MCDANIEL, G. R., and J. V. CRAIG, 1959 Behavior traits, semen measurements and fertility of White Leghorn males. Poultry Sci. 38: 1005-1014.
MATHER, K., 1949
ROBERTSON, A., 1959 Experimental design in the evaluation of genetic parameters. Biometrics 15: 219-226.
SIEGEL, P. B., 1959 Evidence of a genetic basis for aggressiveness and sex-drive in the White Plymouth Rock cock. Poultry Sci. 38: 115-118. - 1960a Repeatability of several semen and mating behavior characteristics. Res. Rpt. Va. Agr. Expt. Sta. pp. 173-174.
-
1960b A method for evaluating aggressiveness in chickens. Poultry Sci. 39: 1046-104.8.-
Selection for body weight at 8 weeks of age. 1. Short term response and herit- abilities. Poultry Sci. 41: 954-962. - 19621, Selection for breast angle at 8 weeks of age. 1. Gene interactions and heritabilities. Poultry Sci. 41: 1177-1185. - 1963 Selection for breast angle at 8 weeks of age. 2. Correlated responses of feathering, body weights, and reproductive characteristics. Poultry Sci. 42 : 437-4469.SNEDECOR, G. W., 1946 Statistical Methods. Iowa State College Press, Ames. TINDELL, D., and C. G. ARZE, 1965
Poultry Sci. 44: 70-72. UPP, C. W., 1928
WOOD-GUSH, D. G. M., 1956 GUHL, A. M., 1951
Biometrical Genetics. Dover, New York.
1962a
Sexual maturity of male chickens selected for mating ability. Preferential mating of fowls. Poultry Sci. 7: 225-232.
The agonistic and courtship behavior of the Brown Leghorn cock. Brit. J. Animal Behav. 4: 133-142. - 1958 Genetic and experimental factors affect- ing libido of cockerels. Proc. Roy. Soc. Edinburgh B 27: 6-8.
-
1959 Genetic differ- ences in the reproductive behavior of domestic cockerels. Anat. Record 134: 658459.-
1960 A study of sex-drive of two strains of cockerels through three generations. Animal Behav. 8 : 43-53.A study of differences in the sex-drive of cock- erels. Brit. J. Animal Behav. 4: 102-110.
WOOD-GUSH, D. G. M., and R. OSBORNE, 1956