COMPARISONS
OF
ADLZBZTUM
AND RESTRICTED FEEDING OF MICE SELECTEX) AND UNSELECTED FOR POSTWEANINGGAIN.
I.
GROWTH, FEED CONSUMPTION AND FEED EFFICIENCY1v.
M. TIMON* AND E. J. E I S E NAnimal Science Department, North Carolina State University, Raleigh
Received April 23, 1969
TUDIES by
FALCONER
(1959), FOWLER (1962), RAHNEFELD et al. (1965),LANG and LEGATES (1969) and SUTHERLAND et al. (1970) have shown that feed efficiency in mice increases as a result of selection for increased body size. FOWLER (1962) showed that line differences (high us. control us. low) in ener- getic efficiency were dependent on the period of the growth cycle in which com- parisons were made. None of these studies attempted to describe the nature of the correlated response in feed efficiency or its dependence on level of feeding. In addition, the changes in feed efficiency were not considered in relation to changes in body composition.
In each of these studies comparisons were made on ad libitum feeding over fixed age intervals. No attempt was made to measure the possible effects of appe- tite on the expression of line differences in feed efficiency. Controlled feeding ex- periments in poultry by LEPORE (1965) and SIEGEL and WISMAN (1966) sug- gest that correlated changes in appetite may lead to biased measures of efficiency differences in line comparisons made on ad libitum feeding. The interpretation of results in any comparison among genetically different lines also will depend on the particular definition of feed efficiency;
FOWLER
( 1 962) used the form gain/ feed, whereas SUTHERLAND et al. (1970) used the reciprocal definition, feed/gain. The present study was undertaken to measure the efficiency of selected (High) and unselected (Control) lines in ad libitum and controlled feeding regimes, and to compare the various measures of efficiency over fixed age and fixed weight intervals. Carcass composition, energetic efficiency and grcywth curve comparisons between lines and sexes will be reported elsewhere (TIMON et al. 1970; TIMON and EISEN 1969).MATERIALS A N D METHODS
The mice used in this study were obtained from 9th generation selection and random control
populations developed from a foundation I.C.R. strain obtained from the Institute of Cancer Re-
search, Philadelphia, Pa. The selected line subsequently designated High ( H ) was selected for
'Paper No. 2868 of the Journal Series of the N-& Carolina State University Agricultural Experiment Station, Raleigh, North Carolina. This reseaxh was supported in part by Public Health Service Research Grant GM 11546. Computing services were supported by NIH Grant FR-00011.
* Present address: The Agricultural Institute, Dunsinea, Castleknock, Dublin.
42 V. M. TIMON AND E. J. EISEN
increased postweaning gain from 31-42 days, while the Control (c) line was randomly selected
In each of the nine generations both populations were propagated by 16 single-pair matings. Random mating of the selected individuals was used, except that full-sib matings were avoided. In sampling these populations, one male and one female mouse were randomly drawn from each of the 16 families in each population. The progenies of random matings among these mice con-
stitute the sample used in this study. To minimize the effects of correlated changes in postnatal maternal performance on postweaning growth, the progenies of all litters in both the High and Control lines were fostered five days after birth on Control line dams of equivalent postpartum age ( k 12 hr). Only whole litters standardized to eight mice ( 4 8 8 , 4 9 9 ) were fostered, and litters were weaned at 21 days. Weights taken over this period (five-day litter weight, individual
12-day and 21-day weights) were recorded to the nearest 0.1 g.
Controlled Feeding: At weaning. High and Control litters of the same age were paired on the
basis of similarity in weight to form 27 blocks, each containing eight mice: two Control ad libitum,
two Control restricted, two High rul libitum and two High restricted (one male and one female in each case). Within each block a random male and female mouse from a High line litter were paired on a weight basis with their Control contemporaries. The High restricted male and female mice (HR) were kept on a restricted feed intake in that they were offered The same quantity of feed (adjusted for differences in body weight) as that consumed by the paired Control male and female mice maintained on the ad libitum feeding regime (CA). In the formula used for caltulat- ing the amount of feed offered to HR individuals,
the correction for body weight is based on the assumption that the maintenance feed requirement is a function of metabolic body size (BRODY 1945). In completing the factorial arrangement within each block, the Control mice were restricted to the same percentage reduction in feed of- fered per gram body weight as that obtained in the High ad libitum and High restricted pair. Body weight and feed consumption were recorded to the nearest 0.1 g over two-day intervals. Consequently, the restricted feed aliquots were calculated every two days and were based on the feed intakes of contemporaries over the previous two-day interval. Feed consumption was meas- ured on all mice from 21 to 57 days and restricted feeding began on day 33. A standard feed (Purina Laboratory Chow) was used throughout the postweaning period. I t was finely ground
(x
cm plate) and offered in special glass jar feeders.STATISTICAL ANALYSIS
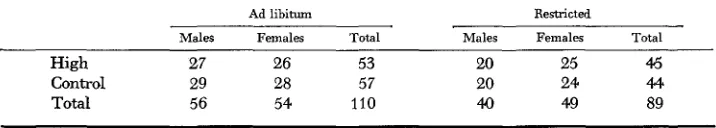
The distribution by line-treatment-sex subclasses of the 199 mice that completed the experi- ment is shown in Table 1. Because of lack of orthogonality in the data due to preweaning or
postweaning mortality, all analyses were computed by a generalized least-squares procedure (HARVEY 1960). Two classes of statistical analyses were conducted.
I . Regression of traits on age and weight: Only the 110 mice fed ad libitum were used in these analyses. The regressions of feed consumption, feed efficiency and weight gain on age (21
to 57 days) were fitted to a third degree orthogonal polynomial equation. The regressions on weight also were fitted to a cubic polynomial, but in these analyses the independent variables
TABLE 1
Classification of mice b y line-treatment-sex subclasses
___ _ _ ~
Ad libitum Restricted
Males Females Total Males Females Total
High 27 26 53 20 25 45
Control 29 28 57 20 24 4 4
CORRELATED RESPONSES IN M I C E 43
were not orthogonal. Linear and quadratic models were also fitted, and the particular equations
used are those for which all terms (linear, quadratic or cubic) were significant in at least one line-sex subclass.
A total of 1980 data points (18 age points Y 110 mice) were available for these analyses. In
the regressions on age, tests of “lack of fit” to the equation were made by partitioning the residual sums of squares into sums of squares due to “lack of fit” and true error (DRAPER and SMITH 1966).
Tests of heterogeneity of regression sums of squares were computed by fitting multiple linear regression models for all combinations of line-sex subclasses, lines and sexes.
2. Line, sex and feed level comparisons over fixed age and fixed weight intervals: Changes in
the pattern of feed intake and weight gain over the experimental period, evident in the regres- sion analyses, indicated the necessity to analyze the data within particular age periods and over a fixed weight interval. Consequently, the data were classified into three separate age intervals: Period I, 21-33 days; Period 1 1 , 3 3 4 days; and Period III,45-57 days. Feed efficiency, average daily feed consumption and average daily gain were based on total feed consumed and total weight gained in each particular age interval.
Analysis of these traits over a constant weight interval was only possible in the ad libitum mice since some individual weight gains in the restricted mice were negative. A 10 g weight interval, 15-25 g, was chosen in the ad libitum mice as this represented the largest constant weight range common to all mice in that group.
A number of different analyses were carried out on the total set of data, the ad libitum data only, within the separate age and weight intervals and with and without the inclusion of a covariate. These analyses will be described in reference to the most complete linear model:
Y s j k Z m = P
+
B,+
L j+
S,+
Ti+
W ) i j+
(BSI,,+
(BT)i, 4- (LS)jk+
(LT)jl+
(ST),,+
P
X i j k l m4-
e; j k , m ,where
Y P t k l m = observation on the mth mouse in the ijklth subclass,
P = population mean,
B, = flxed effect of the ith block; i = 1,
. . .
,27,Li = fixed effect of the jth line; j = 1,2, S, = fixed effect of the kth sex; k = 1,2,
T, = fixed effect of the lth feeding regime; 1 = 1,2,
(BL)%,, (BS),,, (BT)iz, (LS),,, (LT) i,, and (ST),, = respectiveinteractioneffects,
/3 = regression of Y z j k z m on X P j k Z m (average body weight in the case of a fixed age in-
terval or number of days required to gain 10 g in the case of the fixed weight in- terval, 15-25 g),
erjkZm =random effect assumed N(O,ue).
RESULTS
Comparison of High and Control n i c e on ad libitum feeding: The results of this section are presented to chanacterize the differences between lines and sexes in feed consumption, growth rate and feed efficiency under crd libitum feeding.
The mean body weights plotted in Figure 1 illustrate the increased growth rate of the High line relaitive to the Control and the greater growth rate of males com- pared to females. The lack of any difference in body weight at weaning suggests that the fostering technique was probably successful in minimizing preweaning maternal effects.
Age trends: The regressions of feed consumption, feed efficiency (gainJfeed) and weight gain on age shown in Tables 2 and 3 and Figures 2a, 2b and 2c were all highly significant (P
<
.OO1).
On the average, the regressions on age account-44 V. M. TIMON A N D E. J. EISEN
High M u l e s
High Females
Control
Males
Control
Females
-
-.-
---
I O ‘ I I I I 1 I I I I
21 25 2 9 33 3 7 41 4 5 4 9 5 3 57
A G E ( d a y s )
FIGURE 1 .-Plotted growth curves by line-sex subclasses under ad libitum feeding.
weight gain, respectively. Although considerable variation in these traits was unexplained by the equations, in general the tests of “lack of fit” to the equations
(Table 2) were nonsignificant (P
>
.05), indicating their unbiased nature.7.0
-
H i g h M a l e s High Females
Control Males
C o n t r o l Females
-
-.-
---
----
2 2 26 30 3 4 38 4 2 46 5 0 5 4
A G E ( d a y s )
CORRELATED RESPONSES IN M I C E
High M a l e s High Females Control Males
Control Females
-
-.-
---
----
0.03
-
0 . 0 0 - ’ I I I I I I I
’
22 26 30 3 4 38 42 46 5 0 54
A G E ( d a y s )
46
>- 0
n W W
LL
FIGURE 2b.-The regressions of feed efficiency (gain/feed) on age (days) under ad libitum feeding.
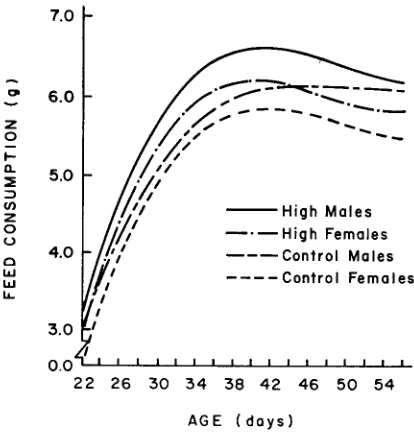
The regression cullres in Figure 2a indicate that average daily feed consump- tion increased in both lines and in both sexes up to about 40 days of age, after which there was a slight though consistent decrease in all groups except Control males. The curves indicate that average feed consumption was larger in High than in Control mice and larger in males than in females. Both line and sex idif- ferences in feed consumption increased up to six weeks of age. Thereafter,
z Q
c3
-
I-
I
W
c3
3
High M a l e s
1.25
-
-
-.
-
High Females---
Control MalesControl Females
0.50
-
0.25
-
0.00 ’ I I I I I I I I I
’
I I’
22 26 30 34 38 42 46 50 5 4A G E ( d a y s )
46
V. M. TIMON AND E. J. EISENTABLE 2
Analyses of variance in the regressions of feed consumption, feed
efficiency and weight gain on age
Mean squares
source df Feed consumption
High Males
Regression 3 551.89* **
Residual 4.821 3.84
Lack of fit 14 3.36NS
Error 468 3.85
Regression 3 573.74"'
Residual 518 4.13
Lack of fit 14 3.45NS
Error 504 4.15
Control Males
High Females
Regression 3 486.13 * * *
Residual 464 2.79
Lack of fit 14 2."S
Error 450 2.80
Control Females
Regression 3 554.15* * *
Residual 500 3.13
Lack of fit 14 3.79NS
Error 486 3.11
Weight gain
Feed efficiency
1.407* **
0.016 0.038** 0.016
1.691 * * *
0.018 0.02ONS 0.018
1.201 * * *
0.018 0.033* 0.018
1.287*** 0.022 0.033NS
0.022
103.06* * *
1.49 5.84*** 1.35
84.59*** 1.17 1.99NS 1.15
79.63*** 1.28
6.04* * *
1.12
55.57*** 0.85 2.66***
0.79
NS Not sienificant
* P
<o.oz,
** P <O.Ol, * * * P <0.001+
Residual degrees of freedom equal 483, 519, 465 and 501 for feed efficiency and weight gainof High males, Control males, High females and Control females, respectively.
the sex differences remained relatively constant, but a switch in levels of feed intake between Conltrol males and High females caused a slight reduction in the average line difference between six and eight weeks. The analyses of variance in Table 3 show that these regression curves differ principally in the level of feed consumption (elevations, P
<
.OOl), though the rate of change in feed intake over time (slopes) was also significantly different (P<
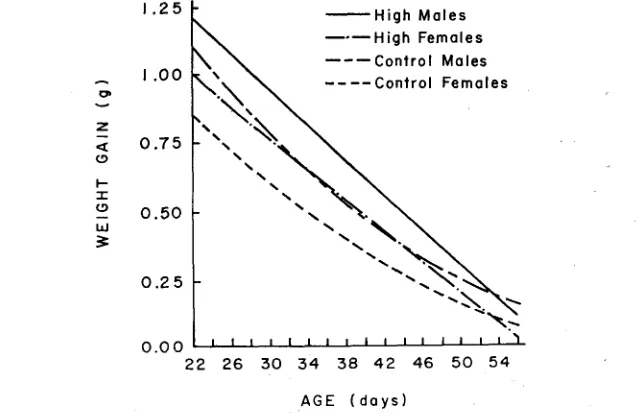
.05).Age trends in feed efficiency (gain/feed) were characteristically negative (Figure 2b). A marked initial difference between the sexes persisted throughout the entire period. In contrast, differences in efficiency between High and Control mice gradually increased, reaching a maximum by day 33.
CORRELATED RESPONSES I N MICE
TABLE 3
Heterogeneity of regression s u m of squares among line-sex subclasses. Regression of
feed consumption, feed eficiency and weight gain on age
47
Mean squares
Source df Feed consumption Feed efficiency Weight gain
Residuals
Line (L) 1 307.57* * * 0.135* * * 28.39***
Sex (S) 1 239.65*** 0.220** 41.38** *
L X S 1 10.42Ns 0.002NS 0.23NS
Error 1964 3.49 0.019 1.19
Slopes
Line (L) 1
Sex (S) 1
L X S I
Error 1964
21.57* 0.069NS 7.16*
13.74* 0.03 1 NS 3.49NS
9.63NS 0.001NS 0.13NS
3.49 0.019 1.19
Elevations
Line (L) 1 286.00* * * 0.066NS 21.23**
Sex (S) 1 225.91*** 0.188** 37.89***
L X S 1 0.74NS 0.001NS 0.11NS
Error 1964 3.4.9 0.019 1.19
NS Not significant
* P <0.05, ** P <O.Ol, *** P <0.001
typical of mammalian growth (HANKINS and TITUS 1939; BRODY 1945; KLEIBER 1961).
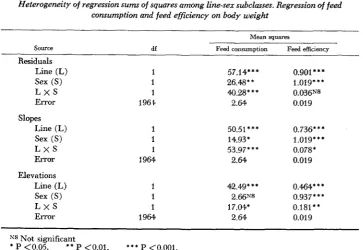
Weight trends: The regressions of feed consumption and feed efficiency on b d y weight are presented in Figures 3a and 3b. The regressions were highly signifi- oant and, on the average, accounted for 61 and 21
%
of the variation in feed con- sumption and feed efficiency, respectively. It is apparent from Figure 3a that at any point between 10 and 30 g body weight, female mice in both lines consumed more feed than males of the same weight. The analysis of variance in Table 4 shows that this sex difference in feed intake over the weight interval studied was due primarily to significantly(I?
<
.05) different slopes.The significance of the sex X line interadon in the slopes suggests further that the feed intake-body weight association is peculiar to each sex-line subgroup. The line difference in the slopes was also hqghly significant (P
<
.OOl) and though not consistent within sexes, it indicates that feed intake per gram body weight was larger in the selected mice at all body weights.48 V. M. TIMON A N D E. J. EISEN
z
I-
2
5 . 0I
n I2
High M a l e s High Females C o n t r o l Males C o n t r o l Females
-
-.-
---
----
I I I I
I O 15 2 0 2 5 3 0
B O D Y W E I G H T ( g )
FIGURE 3a.-The regressions of feed consumption ( g ) on body weight ( g ) under ad libitum
feeding.
0 0
L z W
-
U
~ LL LL
W
n
W W
LL
0.1 5
0 . 1 2
0.09
0 . 0 6
0.03
0.00
H i g h M a l e s High Females Control Males
-
-.-
---
IO 15 2 0 2 5 3 0
B O D Y W E I G H T ( 9 )
FIGURE 3b.-The regressions of feed efficiency (gain/feed) on body weight ( 9 ) under ad
CORRELATED RESPONSES I N MICE 49
TABLE 4
Heterogeneity of regression sums of squares among line-sex subclasses. Regression of feed
consumption and feed eficiency on body weight
Mean squares
Source df Feed consumption Fed efficiency
Residuals
Line (L) 1 57.14* * * 0.901***
Sex (S) 1 26.48* * 1.019* * *
L X S 1 .M).223*** 0.036NS
Error 196) 2.64 0.019
Slopes Line (L) Sex (S) L X S Error
Elevations Line (L)
Sex (S)
L X S Error
1 1 1 1964
1 1 1 1964
50.51 * * * 0.736** *
14.93* 1.019***
53.97* ** 0.078*
2.64 0.019
42.49' * * 0.464* * *
2.66NS 0.937 * * *
17.04* 0.181**
2.64 0.01 9
N5 Not significant
* P <0.05, ** P <0.01, * * * P <O.OOl.
Controls at any point in the body weight range from 15-30 g, while over the entire range of weights, males were more efficient than females.
Comparisons over fixed age and fixed weight intervals: The results reported thus far indicate that growth rate, feed consmption and feed efficiency are non- linear functions of age and weight. Consequently, these traits were analyzed within three consecutive age intervals and over a constant weight interval. Al- though the relationships studied were approximately linear within the three age intervals (21-33, 33-45, and 45-57 days), there was considerable heterogeneity in the regressions of the three traits on body weight. Therefore, the validity of covariance analysis based on body weight is questionable.
The least-squares mean differences in feed efficiency, feed consumption and weight gain given in Table 5 confirm the observations that the differences be- tween lines and sexes change markedly over the 21-57 day period and are de- pendent on body weight. High mice had a higher feed efficiency than Controls in Periods I and I1 (21-45 days) but did not differ significantly ( P
>
.OS) in Period 111. High mice consumed significantly (P<
.01) more feed than Controls over all three age periods, though the magnitude relative to the increasing average feed consumption decreased. I n contrast, sex differences i n feed consumption in- creased both in magnitude and significance from Period I to Period 111.ch 0 TABLE 5 Least-squares estimates of the overall means, and differences between lines (H
-
C) and sexes (M - F) in feed effciency, average daily feed consumption (ADFC) and average daily gain (ADG) under ad libitum feeding Period It Unadjusted Adjusted Period IIt Period IIIt Unadjusted Adjusted Unadjusted Adjusted Weight constant$ Unadjusted AdjustedFeed Efficiency Mean H-C M-F
ADFC
Mean H-C M-F
ADG
Mean H-C M-F
.204 ... .019* .015 .028** .020 4.432 ... .401* * * .I55 .253* --.I62 .906 ... .162*** .095** .188*** .073 .075 ... .017* .048*** .014 .041* * 6.133 ... .465 * * * -.088 .266* * -.261* .464 ... .138*** .260** * .107* * * .221* * * .033 ...
.om
.024 .014* .031* 5.936 ... .430*** -.379 .I98 ... .013 -. 1 06 .097* * * -.034 .285 * * -.458 * .I85 ... .062*** .010 .069* * * .029* * 5.207 ... ,141 -.I 18 -.I28 --.325 * * .967 ... .356* * * .049 .343*** .Ill*t
Unadjusted and adjusted indicate that model included and excluded covariance on average body weight, respectively. $ Unadjusted and adjusted indicate that model included and excluded covariance on number of days required to gain 10 g in the weight range of * P <0.05, ** P <O.Ol, *** P <.001. 15-25 g, respectively.CORRELATED RESPONSES IN M I C E 51 analyses in Table 5 that both sex and line differences in feed efficiency and gain were more completely expressed (200-300% greater) when comparisons were made over a fixed-weight interval.
This result is meaningful because comparisons made at the same age among genetically differentiated lines with respect to growth rate do not account for differences in stage of growth (maintenance requirements) or the composition of weight gains which can exist at (any given time interval. Since growth processes in general are functionally associated with body weight (BRODY 1945), comparisons over a weight-constant interval may reflect more closely the differences in net efficiency which exist among the lines. However, such comparisons will be in- fluenced by maintenance costs if differences in efficiency of tissue growth exist.. Since slower-growing individuals will take longer to gain the prescribed 10 g, they will have an increased maintenance cost which will be proportional to the number of days required to gain the 10 g. Assuming that growth rate was linear in all sub- groups between 15 and 25 g (see Figure 3b), and that maintenance costs as a function of body weight did not vary over lines and sexes, the adjusted weight constant comparisons among lines and sexes (Table 5) may be interpreted as a measure of differences in the net efficiency of growth Again, there was a contrast between the sex and line responses in feed efficiency since adjusting for mainte- nance completely removed the line difference (unadjusted, 0.062 us. adjusted, 0.010) but not the sex difference (0.069 us. 0.029). A similar pattern was observed for average daily gain in the weight-constant analysis. If the stated assumptions are valid, this result suggests that selection for postweaning gain has caused a change in gross efficiency but not in net efficiency of tissue growth. However, dif- ferences in net efficiency appear to exist between male and female mice.
The differences in feed consumption at constant body weight (covariance analyses) show a variable pattern in the lines and sexes. No significant difference existed between High and Control mice except in Period I11 (P
<
.OS), whereas the only significant sex difference was found in Period 11. In agreement with the regressions in Figure 3a, these estimates show that at similar body weights, fe- males consumed more feed than males. It is worth noting that in these covariance analyses significant linex
sex interactions were found in average daily feed con- sumption in Period I1 and Period 111. This same interaction was also significant in the analysis of food consumption over the constant weight interval 15-25 g and it suggests that comparisons of High and Control mice cannot be generalized over both sexes. An earlier study of this same stock (I.C.R.) by EISEN andLEGATES (1966) reported significant sex x genotype interactions for postweaning gain and 56-day weight, traits which are clearly dependent on food consumption. However, LANG and LEGATES (1969) did not find any evidence of this interaction in other stocks in this laboratory.
A summary of the analyses over the three separate periods is presented in Table 6. The changes in all three traits over time were reflected in the highly significant (P
<
.OOl) p e r i d differences, with the greatest changes occurring between Periods I and 11. It also was evident from the analyses of variance that52 V. M. TIMON AND E. J. EISEN
TABLE 6
Least-squares estimates of the overall m a n s and differences between lines ( H - C),
sexes ( M - F) and periods ( P I
-
PI,, PI - P,, P , - P I I I ) in feed eficiency,average daily feed consumption (ADFC) and average daily gain
(ADG) under ad libitum feeding
Feed efficiency ADFC ADG
Mean .lo4 5.501 .523
H - C .012* * .384* * * .lW***
M - F .O19*** .317*** .131***
PI - PI,, .170* * * -1.487* ** .706***
PI1
-
PI11 .042* * * .188*** .265* * *PI - PI1 .127*** -1.675** * .MI***
* * P <O.Ol, * * * P <O.OOl
TABLE 7
Least-squares estimates of the overall means and differences between lines ( H - C),
sexes ( M
-
F) and feeding regimes ( A - R ) in feed eficiency, average dailygain (ADG) and average daily feed consumption (ADFC)
Feed efficiency+ ADFCf AD@
Unadjusted Adjusted Unadjusted Adjusted Unadjusted Adjusted
Mean .029 5.401 .175 . .
H - C .012*** .012** 0.574*** 0.046 .082*** .057*
M - F ,002 .WO .193** 0.327*** .03 1 .oo4
A-R .053*** .051** 1.265** 0.207 .316*** .267**
t
Unadjusted and adjusted indicate that model included and excluded covariance on average* P <0.05, * * P
<
0.01, ***P<
0.001body weight, respectively.
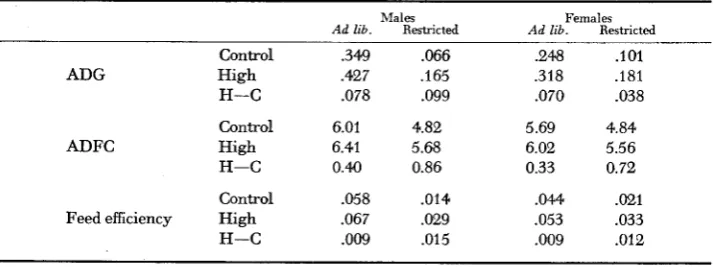
TABLE 8
Mean values for feed efficiency, average daily feed consumption (ADFC) and average daily
gain (ADG) by line-sex-feeding regime subclasses
Males Females
Ad lib. Restricted Ad lib. Restricted
Control .349 .066 .248 .lo1
ADG High .427 .I65 .318 .I81
H-C .078 .099 .070 .038
Control 6.01 4.82 5.69 4.84
ADFC High 6.41 5.68 6.02 5.56
H-C 0.M 0.86 0.33 0.72
Control .058 .014 .044 .021
Feed efficiency High ,067 .029 ,053 .033
CORRELATED RESPONSES IN M I C E 53
average daily gain, which was just significant (P
<
.05). Therefore, the linear contrasts in Table 6 may be interpreted as a summary of the differences in feed consumption, weight gain and feed efficiency between lines and sexes over an age-constant (21-57 days) interval under ad libitum feeding.Ad libitum and restricted feeding: The results of the comparisons made under
ad libitum and restricted feeding regimes are summarized in Tables 7 and 8. The
feed consumption estimates (Table 7) indicate a large difference (1.26 g) be- tween mice on ad libitum and restricted feeding regimes. This difference was largely due to variation in body weight, as the estimate after correction for body weight was only 0.21 g. A significant line
x
feeding regime interaction in feed consumption indicated that the experimental procedure failed to achieve the same degree of feed restriction in the Controls as in the High mice. The failure to impose a similar restriction in borth lines arose largely in the early stages of the restriction period when body weight changes, and consequently the restricted feed aliquots which were adjusted for body weight, were very erratic. In the early stages of the restriction most mice lost weight. Since this may have temporarily imposed stress on individuals, only the effects of restriction over the total period can be assessed. The High line had a higher feed efficiency than Controls under both ad libitumand restricted feeding. Although the means in Table 8 suggest that this difference in feed efficiency was larger under restricted feeding than in the ad libitum regime in both sexes, the line x feeding regime interaction was not significant in either the adjusted or the unadjusted analysis. To examine the effect of the large vari- ation in the early phase of restriction the data were reanalyzed from day 45-57. The results did nut differ from the complete analysis, and again the line x feeding regime interaction was nat significant.
In contrast to the line responses there was no overall significant sex difference in feed efficiency but a highly significant sex
x
feeding regime interaction in both the adjusted and unadjusted means. In this case it is in the ad libitum environ- ment that the greatest difference in efficiency is expressed. It can be seen from Table 8 that the sex difference averaged for High and Control lines is larger i nthe ad libitum environment than in the restricted regime. This is in complete con-
trast to the line
x
feeding regime interaction which showed that line differences in efficiency were more fully expressed in the restricted environment. There was a highly significant sex x feeding regime interaction (P<
.OOl) in average daily gain also.DISCUSSION
Definitions of feed eficiency: When considering the trait, feed efficiency, it is
important to realize that efficiency per se is never really measured. Rather, direct measurements of growth (x,) and feed consumption (xz) are made and efficiency is then defined as a n index (x,/x2 or x2/x1) of these two traits. SUTHERLAND
(1965) and MAGEE (1962) have considered the automiatic aspect of the relation- ship between feed efficiency and weight gain and have indicated the situations in
which this relationship will attain particular values. Whereas SUTHERLAND
54 V. M. TIMON AND E. J. EISEN
MAGEE (1962) preferred the reciprocal form, gainlfeed, which he termed “de- sirable feed efficiency.” TITUS, MEHRING and
BRAMBAUGH
(1953) also drew attention to the alternate forms and suggested the terms, feed efficiency (gain/ feed) and feed conversion (feed/gain).
The product-moment correlation ( p ) between these alternate forms ( xJx2, x2/xl) will always be negative but will never equal minus one. I n this experiment values of this correlation ranged from -0.7 to -0.9. The extent to which p will differ from minus one is a function of the varianceof x1/x2.
Since these alternate indices of efficiency are not the same, i t is of interest to describe the differences. Using PEARSON’S (1897) approximations of the expected value and variance of a ratio, the factors contributing to these differences become evident.
where pl, pz and U:, U; are means and variances of weight gain and feed consump-
tion, respectively, and u12 is the covariance between gain and feed consumption. These formulas clarify some of the consequences of comparing animals on the basis of fixed weight, fixed age or fixed feed intervals. In comparisons over a fixed weight interval, feed consumption provides a direct measure of gross economic ef- ciency and will be perfectly correlated with feed/gain but nonlinearly ( IpI
<
1) related with gain/feed. The latter would be perfectly correlated with gain which is a direct measure of gross economic efficiency when comparisons are made over a constant feed interval.Since both feed consumption and weight gain will vary when comparisons are made over a constant age interval, a choice of the alternate forms cannot be made based on the previous considerations. However, if we consider the variances of xl/x2 us. x2Jx1, it is clear from expressions ( l a ) and
(ea)
that both variances are functions of uz1, uz2 and u12 and differ only in the coefficients of these terms. Com-paring these corresponding coefficients. 1/pz2 us. p22/p41, p1/p32 us. pz/p31, and
p21Jp42 us. 1 / p Z 1 , shows that the coefficients from expression ( l a ) will always be
less than those in (2a) when pl
<
p2. In mammals average weight gain (pl) is al-ways less than average feed consumption ( p z ) ; i.e., pl = K p 2 , 0
<
K<
l. It is easily shown that the coefficients of uZ1, uI2 and uZ2 in formula (2a) will be greater than their corresponding terms in ( l a ) by an amount I N . Consequently the variance of x2/x1 will be considenably greater than the variance of x1/x2. The coefficient of variation will also be greater for x2/x1 but not to the same extent since the means are different, (xz/xl)>
(x,/x,). In this study, the coefficients of variation for x2/x1 and xljxz were 79.9% and 23.7%, respectively. On this basisCORRELATED RESPONSES I N MICE 55 gain /feed would be preferred to feed/gain when comparisons are made over a constant age interval.
Efficiency in the biological sense is also dependent on the tissue composition of the weight gain as well as on the feed requirement for maintenance. Since tissue fat contains more energy than protein (9.45 us. 5.65 kcal/g), any efficiency in- dex which does not account for this difference will underestimate the efficiency of the animals with a higher amount of fat. That this bias will be greater when the index, feed/gain, is used can be seen by expressing total dry weight gain as At, = A, (gain in fat tissue) f- A f f (gain infat-free tissue), and substituting this expression for gain into formulas (1) and (2). Clearly, A, will appear in all terms in the E(xL/xl), but only in the mean (pl) and covariance term (uI2) in
E(x1Jxd.
The effect of maintenance on the efficiency index will depend on the stage of growth at which animals are evaluated. Since maintenance feed requirements are proportional to “metabolic” size (body weight.75) it follows that the effect of maintenance on gross efficiency will increase as animals having genetically dif- ferent growth rates diverge in body weight. It will depend further on the stage of growth to the extent that maintenance requirements relative to the feed energy of growth will be less in the period of maximum growth before puberty. In view of these considerations and the results of this study, it is clear that the particular results of any comparisons between genetic lines or sexes are in part dependent on the method of analysis and the particular definition of the traits studied.
General conclusions: It is apparent from these data that selection for increased growth rate has resulted in a positive correlated response in feed consumption and this increase relative to the mean is much more pronounced in the early post- weaning stage (21-33 days). FOWLER (1962) and LANG and LEGATES (1969) have also observed increased feed consumption in their selected lines, although these authors did not examine the increases relative to body weight. There is strong evidence in this study (Figure 3a) that feed coesumption per gram body weight also increased as a result of selection for postweaning gain.
56 V. M. TIMON A N D E. J. EISEN
mice in a negative way. The larger line difference in efficiency in the restricted feeding regime supports this interpretation. However, it appears that the positive effect of increased gains associated with increased appetite outweighs the negative effects of energy wastage when the differences in maintenance (average body weight) are large enough to influence gross efficiency. The analyses of “energetic efficiencies” in these lines are in accord with this interpretation (TIMON, EISEN and LEATHERWOOD 1970).
These results suggest that nine generations of selection for postweaning weight gain in the High line have hmad little effect on the net efficiency of tissue growth. The apparent advantage of the High line over the Control in gross efficiency was dependent on the increased gains associated with the pronounced increase in ap- petite. In contrast, there was evidence of a physiological difference in net effi- ciency of tissue growth between the sexes.
The dependence of these latter conclusions on assumptions concerning esti- mated maintenance requirement indicates the need to measure the composition of growth at a number of points over the growth period in relation to body size and utilization of the ingested feed. Such a study would also measure energy balance to examine the possibility of increased wastage associated with increased feed intake i n the High line. The differences in the genetic line and sex contrasts suggest the need to include sex comparisons in such a study.
The authors acknowledge the helpful discussions and comments of DRS. B. J. LANG, J. M.
LEATHERWOOD, J. E. LEGATES, R. D . MOCHRIE, H. E. SCHAFFER and P. B. SIEGEL. The technical
assistance of MRS. M. BROWN, MRS. B. J. EDWARDS and MRS. M. GURGANUS is gratefully acknowl-
edged.
SUMMARY
Growth rate, feed consumption and feed efficiency were compared in mice se- lected for increased postweaning weight gain (High line) and Control line mice under ad libitum and restricted feeding conditions. Data based on 199 mice re- corded over the postweaning growth period, 21-57 days, were analyzed to show the pattern of change and total change in these traits as a result of selection for postweaning weight gain.-The results showed that High mice consumed more feed, grew at a more rapid rate and were more efficient than the unselected Con- trols. The High mice had a larger appetite as measured by feed consumed per gram body weight. The difference in feed efficiency between High and Control mice was greater under restricted feed but this line x feeding regime interaction was not statistically significant. Males grew faster and were more efficient than females from the same line. Measured at the same weight, however, females con-
sumed more feed than males. The difficulties in assessing the alternate definitions
CORRELATED RESPONSES I N M I C E 57
LITERATURE CITED
BRODY, S., 1945
DRAPER, N. and H. SMITH, 1966 EISEN, E. J. and J. E. LEGATES, 1966
FALCONER, D. S., 1959
FISHER, R. A. and F. YATES, 1963
FOWLER, R. E., 1962 The efficiency of food utilization, digestibility of food stuffs and energy ex-
HANKINS, 0. G. and H. W. TITUS, 1939 Growth, Fattening and Meat Production. Yearbook of
HARVEY, W. R., 1960 HEADLEY, F. B., 1946
Sci. 5 : 378-384.
KLEIBER, M., 1961
LANG, B. J. and J. E. LEGATES, 1969
LEPORE, P. D., 1965
MAGEE, W. T., 1962
PEARSON, K., 1897
Bioenergetics and Growth. Reinhold, New York.
Applied Regression Analysis. Wiley, New York.
Genotype-sex interaction and the genetic correlation be-
Selection of mice for growth on high and low planes of nutrition. Genet. tween the sexes for body weight in Mus musculus. Genetics 54: 61 1-623.
Res. 1: 91-113.
Statistical Tables. Hafner, New York.
penditure of mice selected for large and small body size. Genet. Res. 3: 51-68.
Agriculture, U. S. Government Printing Office, Washington, D. C.
Least-Squares Analysis of Data. U.S.D.A. Pub. No. ARS-20-8.
Effect of feeding level and live weight on daily gains of pigs. J. Animal
The Fire of Life; An Introduction to Animal Energetics. Wiley, New York.
Rate, composition and efficiency of growth in mice selected
Appetite and growth rate selection with a methionine deficient diet. Poultry
Relationship between daily feed consumption and feed efficiency. J. Animal
Mathematical contribution to the theory of evolution-on a form of spurious correlation which may arise when indices are used in the measurement of organs. Proc. Roy. Soc. London B 60: 489-498.
RAHNEFELD, G. W., R. E. COMSTOCK, W. J. BOYLAN and M. SINQH, 1985 Genetic correlations between growth rate and feed per unit gain in mice. J. Animal Sci. 24: 1061-1066. SIEGEL, P. B. and E. L. WISMAN, 1966 Selection for body weight at eight weeks of a'ge. 6.
Changes in appetite and feed utilization. Poultry Sci. 45: 1391-1397.
SUTHERLAND, T. M., 1965 The correlation between feed efficiency and rate of gain, a ratio and its numerator. Biometrics 21 : 739-749.
SUTHERLAND, T. M., P. E. BIONDINI, L. H. HAVERLAND and D. PETTUS, 1970 Selection for growth rate, appetite and efficiency of feed utilization in mice. J. Animal Sci. (In press).
TIMON, V. M. and E. J. EISEN, 1969 Comparison of growth curves of mice selected and unse- lected for postweaning gain. Theoret. Appl. Genetics 39: 345-351.
TIMON, V. M., E. J. EISEN and J. M. LEATHERWOOD, 1970 Comparisons of ad libitum and re- stricted feeding of mice selected and unselected for postweaning gain. 2. Carcass composition and energetic efficiency. Genetics (In press).
TITUS, H. W., A. L. MEHRING, JR. and J. H. BRAMBAUGH, 1953 Variation of feed conversion. Poultry Sci. 32: 10741077.
for large and small body weight. Theoret. Appl. Genetics 39: 306314.
Sci. 44: 1093-1097.