THE USE
O F RESTRICTION ENDONUCLEASES TO MEASURE
MITOCHONDRIAL DNA SEQUENCE RELATEDNESS IN NATURAL
POPULATIONS.
I.POPULATION STRUCTURE AND
EVOLUTION
IN THE GENUS PEROMYSCUS
JOHN C. AVISE, ROBERT A. LANSMAN,* A N D ROSEMARY 0. SHADE* Departments of Zoology and *Microbiology, University of Georgia, Athens, Georgia 30602
Manuscript received August 20, 1978 Revised copy received December 5, 1978
ABSTRACT
In this study we introduce to natural population analysis a molecular tech- nique that involves the use of restriction endonucleases to compare mitochon- drial DNA (mtDNA) sequences. We have examined the fragment patterns produced by six restriction endonucleases acting upon mtDNA isolated from 23 samples of three species of the rodent Peromyscus. Our observations confirm the following conclusions derived from previous experiments with laboratory animals: (1) mtDNA within an individual appears homogeneous; (2) at least the majority of mtDNA present in an individual is inherited from the female parent. Our experiments demonstrate for the first time that there is detectable heterogeneity in mtDNA sequences within and among natural geographic populations of a species and that this heterogeneity can readily be used to esti- mate relatedness between individuals and populations. Individuals collected within a single locale show less than 0.5% sequence divergence, while those collected from conspecific populations separated by 50 to 500 miles differ by ap- proximately 1.5%. The mtDNAs of the closely related sibling species P . polio- notus and P . mniculutus differ from each other by 13 to 17%; nonsibling species differ by more than 20%. Qualitative and quantitative approaches to analysis of digestion patterns are suggested. The results indicate that restriction analysis of mtDNA may become the most sensitive and powerful technique yet available for reconstructing evolutionary relationships among conspecific organisms.
A
variety of biochemical techniques are commonly employed to assay genetic relationships among species. Nucleic acid hybridization, amino acid sequenc- ing, protein electrophoresis and protein immunology have in recent years con- tributed greatly to our understanding of phylogenetic histories of various groups of organisms. For methodological and empirical reasons, each technique is limited in its usefulness to a restricted range of organism1 comparisons. For example, most protein electrophoretic techniques are suitably applied to comparisons among closely similar species, such as those belonging to a single genus, while protein sequencing, immunological techniques andDNA
hybridization have proved useful in comparing more distintly related species. No technique exceptDNA
sequence determination generally provides sufficient sensitivity to quali-280 J. C. AVISE, R. A. LANSMAN A N D R. 0. S H A D E
tatively define ancestral relatedness among members of conspecific populations. Despite the recent extraordinary advances that make it possible to isolate and sequence specific genes, the difficulties involved in these procedures put them beyond the reach of the population geneticist who wishes to compare a large number of samples from natural populations.
In this study, we introduce to natural population analysis a new molecular technique heretofore applied almost exclusively to problems of molecular biology. We make use of a series of type
I1
restriction endonucleases (BOYER 1971,1974) to cleave DNA molecules isolated from various animals into fragments, which are then sized by gel electrophoresis. These enzymes recognize specific oligo- nucleotide sequences, either four, five, or six base pairs in length, and cleave two phosphodiester bonds within the sequence, one in each strand of the duplex. Given that the nucleotides in the recognition sequence are not protectedby
methylation (modified),
a restriction enzyme consistently cleaves this sequence in DNA isolated from any organism. Thus, differences in the sizes of fragments obtained by digesting homologous DNA's with a given enzyme accurately reflect sequence differences in recognition sites. (The assumption implicit in this work, that differential modification does not alter cleavage patterns, is supported bythe observation that mitochondrial DNA sequences from cultured
Mus
musculus cells are cleaved identically whether the DNA assayed comes directly from the cells or is isolated from recombinant plasmids propagated in E. coli [CHANG et al. 1975; SHADE and LANSMAN, unpublished results]). This simple rationale pro-vides the basis for our attempts to quantify the sequence divergence of DNA molecules purified from related organisms.
Because of its small size and ease of isolation we have chosen mitochondrial DNA (mtDNA) for study. The size and information content of mtDNA are remarkably similar in all metazoan animals. The molecule is between 15,000 and 18,000 base pairs long and is known to encode two ribosomal RNA's, 20 or more transfer RNA's, and approximately seven messenger RNA molecules specifying hydrophobic membrane-associated polypeptides that are the products of protein synthesis on mitochondrial ribosomes (SACCONE and KROON 1976; BATTEY and CLAYTON 1978). Rates of evolution of mtDNA in animals have been estimated by DNA-DNA and DNA-RNA hybridization
(BORST
1972; DAWID and BLACKLER 1972; JAKOVCIC, CASEY andRABINOWITZ
1975) and, more recently, through analysis of restriction endonuclease digests in a few domestic and labora- tory animals and in man (HUTCHINSON et al. 1974;POTTER
et al. 1975; UPHOLT and DAWID 1977). These latter studies have suggested that, as expected, mtDNA is maternally inherited and that considerable sequence heterogeneity exists within the species assayed. At the time of this writing, to our knowledge, restric- tion endonuclease analysis has not previously been employed to determine evolutionary relationships in natural animal populations.M I T O C H O N D R I A L D N A S E Q U E N C E S IN N A T U R A L P O P U L A T I O N S 28 1 populations of individuals or family units (female and her offspring) ;
( 2 )
todetermine whether
mtDNA
is maternally inherited in Peromyscus; (3) to assess the extent of mtDNA sequence polymorphism within and between conspecific and congeneric populations; and(4)
to consider the potential significance of thisnew technique in the analysis of structure and evolution of natural populations.
MATERIALS A N D M E T H O D S
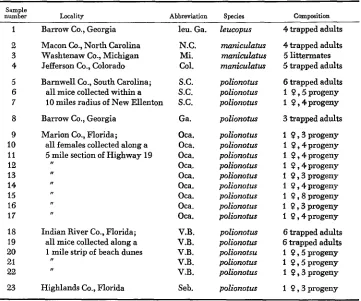
Specimens of P. mniculatus, P. leucopus, and P . polionotus were collected from a number of localities within the continental U.S. as indicated in Table I. P . leucopus is a member of the leucopus species group, closely related to the maniculatus species group, which includes the other two species. On the basis of morphologic, zoogeographic and protein information, P. polio- notus is most closely related to P . maniculrrtus and probably evolved as a southeastern U.S.
isolate from a maniculatus-like ancestor (AVISE, SMITH and SELANDER 1979; DICE 1968). P. polionotus occurs in Georgia, Florida and adjacent states, while P . maniculatus occupies a n immense range that includes most of the North American continent.
When it became apparent that liver samples pooled from conspecific adults trapped in the same locale displayed intrasample sequence heterogeneity (samples numbered 2 and 4 in Tables
TABLE 1
The locality and composition of samples of Peromyscus
Sample
number Locality Abbreviation Species Compwition
1 2 3 4 5 6 7 8 9 10 11 12 13 14 15 16 17 18 19 20 21 22 2.3
Barrow Co., Georgia
Macon Co., North Carolina Washtenaw Co., Michigan Jefferson Co., Colorado
Barnwell Co., South Carolina; all mice collected within a
10 miles radius of New Ellenton
Barrow Co., Georgia
Marion Co., Florida; all females collected along a
5 mile section of Highway 19
I , I, ,, ,, ,, ,,
Indian River Co., Florida; all mice collected along a
1 mile strip of beach dunes
n
I1
Highlands Co., Florida
leu. Ga. N.C. Mi. Col. S.C. S.C. S.C. Ga. Oca. Oca. Oca. Oca. OW. Oca. OM. Oca. Om. V.B. V.B. V.B. V.B. V.B. Seb. leucopus maniculatus maniculatus maniculatus polionotus polionotus polionotus polionotus polionotus polionotus polionotus polionotus polionotus polionotus polionotus polionotus polionotus polionotus polionotus polionotsu polionotus polionotus polionotus
4 trapped adults
4 trapped adults
5 littermates 5 trapped adults
6 trapped adults
1 0 , 5 progeny
1 0 , 4 progeny
3 trapped adults
I 9 , 3 progeny
I 0 , 4 progeny
1 0,4progeny
1 ?,4progeny
1 9 , 3 progeny
1 ? , 4 progeny
1 0 , s progeny
I 0 , 3 p m g e n y
I 0 , 4 progeny
6 trapped adults 6 trapped adults
1 0 , 5 progeny
I 0,5 progeny
I 0 , 3 progeny
1 0,3progeny
282 J. C . AVISE, R . A. L A N S M A N A N D R. 0. SHADE TABLE 2
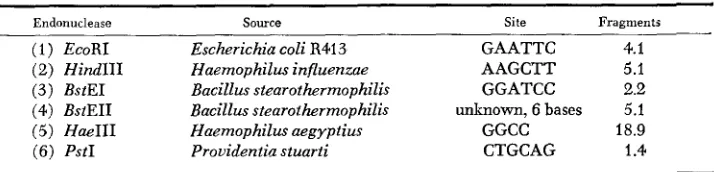
Restriction endonucleases employed in the present study, their source of isolation, nucleotide cleavage site, and the mean number of mtDNA cleavage fragments
produced per asssyed sample of Peromyscus
Endonuclease
(1) EcoRI (2) Hind111 (3) BstEI (4) BstEII (5) HaeIII (6) PstI
Source Site Fragments
Escherichia coli R413 GAATTC 4.1
Haemophilus influenzae AAGCTT 5.1
Bacillus stearothermophilis unknown, 6 bases 5.1
Haemophilus aegypiius GGCC 18.9
Prouidentia stuarti CTGCAG I .4
Bacillus stearothermophilis GGATCC 2.2
1 and 6), we decided to use samples comprised only of livers pooled from a single wild-trapped female and her progeny reared to adulthood in the laboratory.
Livers from three to nine animals that had been starved overnight were removed, minced and homogenized in a mannitol-sucrose buffer (0.21 M mannitol; 0.07 M sucrose; 5 mM tris HCl, pH 7.5; 3 mM CaCl,). Nuclei and debris were pelleted by centrifugation a t 600
x
g for five min. EDTA (0.2 M stock solution, p H 7.5) was added to the supernatant to a final concentration of1 0 m ~ , and mitochondria were collected by centrifugation at 10000 x g for 20 min. mtDNA was purified from this crude mitochondrial preparation after lysis in sodium dodecyl sulfate by the CsCl-ethidium bromide procedure described by BOGENHAGEN and CLAYTON (1974). If the initial density of the gradient is high (refractive index = 1.392) so that the chromosomal and nicked DNA form a band high in a Beckman sw50.1 rotor tube, a closed circular mtDNA frac- tion can be obtained, free of significant RNA o r nuclear DNA contamination, at a yield of approximately 2 pg DNA per gram of liver.
The BstEI and BstEII enzymes were prepared by R. B. MEAGHER. The EcoRI and PstI were purified by the method of GREENE et al. (1978), which can be used in the preparation of most restriction endonucleases. The HaeIII was generously provided by R. GELINAS and the Hind111 purchased from Bethesda Research Laboratories. All the enzymes (BstEI cleaves the same site as BamHI) are obtainable from commercial sources and are listed in Table 2.
After extensive dialysis against TE buffer ( 1 0 m ~ tris-HC1, p H 7.5; 0.05 mM EDTA), ali- quots of the mtDNA samples containing an estimated 20 to 200 n g of DNA in 20 to 80 pl were digested under standard conditions as described in the literature provided by Bethesda Research Laboratories. Approximately one unit of enzyme was used per sample digest. The digests using &base enzymes were electrophoresed in 0.8 or 1.1% agarose gels i n tris-acetate buffer as de- scribed by HELLING, GOODMAN and BOYER (1974). The HaeIII digests were electrophoresed in either 7.5% polyacrylamide o r gradient polyacrylamide gels containing a gradient of 3 to 20% acrylamide (OJALA and ATTARDI 1977) in the tris borate buffer described by MANIATIS, JEFFREY and VAN DE VANDE (1 975). The gels were all 18
x
15 x0.3 cm slabs. After electrophoresis, the gelswere stained by standard procedures using 1 pg per ml ethidium bromide (GREENE et al. 1974), illuminated with short wavelength UV light (cz 260 nm)
.
A more sensitive procedure using the dye 4’; 6-diamidino-2-phenylindoledihydrochloride (DAPI) available from Boehringer-Mann- heim was also used. Gels stained for 60 min in 0.5 pg per ml DAPI were illuminated with long wavelength UV light ( z 360 nm) and photographed through an Eastman Kodak # 4 gelatin filter; bands containing less than 4 ng of DNA were clearly detected. The DAPI staining pro- cedure (see Figure 4) allowed u s to perform more than 10 digestions per sample.RESULTS
“Uniclonal” mtDNA
in
individuals: If a mtDNA that is homogeneous inMITOCHONDRIAL D N A SEQUENCES I N N A T U R A L POPULATIONS 283
pattern should be proportional to the molecular weight of the frhgment, and the total of the molecular weights of the fragments observed should equal the accepted genome size of mammalian mtDNA, 16,300 2 400 base pairs (BROWN
and VINOGRAD 1974). Patterns containing nonstoichiometric bands that exceed 17000 bp in total size could result from incomplete digestions or from hetero- geneity in DNA composition. In only two samples (number 2 and 4 as listed in Tables 1 and 6) were such patterns observed reproducibly. In these cases, incom- plete digestion seems unlikely because not all restriction sites remained uncleaved to the same extent. Since samples 2 and 4 consist of presumably unrelated adults, the simplest explanation is that the samples were comprised of individuals differing in mtDNA sequence.
All remaining samples surveyed, most of which were isolated from littermates or from a female and her progeny, consistently yielded digestion patterns con- taining stoichiometric bands of total 15,600 +- 2000 bp. These data support the concept that individual mice possess a single mtDNA sequence.
The homogeneity of mtDNA within individuals has previously been reported in other species (BROWN and VINOGRAD 1974;
HUTCHINSON
et al. 1974; POTTER et al. 1975; UPEIOLT and DAWID 1977). The reasons for the apparent uniclonal nature of mtDNA are unclear. Oocytes and some other cells contain more than 1000 mtDNA molecules(BOGENHAGEN
and CLAYTON 1974; NASS 1966; UPHOLT and DAWID 1977), but the number of mtDNA molecules that determine the mtDNA sequence pool of mature germ cells is not known in any species and might be small enough to facilitate rapid sorting of mtDNA molecules into homogeneous populations (DAWID andBLACKLER
1972; MICHAELIS 1967;UPHOLT
and DAWID 1977). Another possibility is that natural selection, acting through a currently unknown molecular mechanism, favors conservation of intra-individual nucleotide sequence (see BROWN, WENSINK andJORDAN
1972). Our data do not permit resolution of these o r other hypotheses.Maternal inheritance: Previous experiments have shawn that the majority of
mtDNA molecules present in a vertebrate animal are identical in sequence to the mtDNA present in the female parent (DAWID and BLACKLER 1972; HUTCH-
284 J. C. AVISE, R. A. LANSMAN AND R. 0 . SHADE
7 0 0 0
6 5 0 0
5 8 0 0
5 5 0 0
4 3 0 0
3 8 0 0
3 1 0 0
3 0 0 0
2 2 0 0
E c o R I
H i n d I I I
S.C. Fla. Hybrid S.C. Fla. H y b r i d
=
($1
( 9 )
(6,
( 9 ,
FIGURE I .-Diagrammatic representation of EcoRI and HindIII digestion phenotypes o t
mtDNA from two populations of P . polionotus and their hybrid progeny. In each case the h y brids apparently inherit only maternal mitochondrial genomes. Numbers on the left are esti- mated fragment sizes in base pairs.
are therefore consistent with, but fall short of proving, complete maternal inheri- tance of mtDNA sequence.
Quantitative analyses: Fragment patterns generated by restriction endo- nuclease digestions were used to calculate the extent of sequence divergence between each pair of samples. We have employed a statistical analysis suggested by
UPHOLT
(1977) in which p , the number of base substitutions per nucleotide (or the percentage of nucleotides substituted) is computed from the fraction offragments shared between two digests ( F )
,
the number of base pairs recognized per cleavage site ( n ),
and tlie total number of base pairs in sites cleaved by the restriction enzyme(s) used ( N ) , according to the following formulas:7 [ - F f ( F 2 + 8 F ) 1 / 2
2 p = l -
IPYP)
1
1’2standard deviation U =
UPHOLT’S
(1977) derivation of these formulas is based on the assumptions that fragment changes arise by base substitutions and that the frequency and distri- butions of cleavage sequences in the DNA are similar to those expected in random sequences of the same base composition.MITOCHONDRIAL D N A S E Q U E N C E S IN N A T U R A L P O P U L A T I O N S 285
E c o R I
7 3 0 0
5 8 0 0
3 8 0 0
2 5 0 0
1 3 5 0
-
-
FIGURE 2.-Diagrammatic representation of all EcoRI digestion phenotypes observed in the three species of Peromyscus assayed. Numbers on the left are estimated fragment sizes in base pairs. The letters are phenotype designations discussed in the text and summarized in Table 3.
shares two fragments, 5800 and 5600 bp in length, with l p , which was present in
EcoRI
digests of all P . polionotus collected in Georgia andSouth
Carolina. Together, the two patterns contain seven total fragments, and since six-base sites are cleaved in the reactions, n = 6 andN
= 30 (nucleotides in common cleavage sites are counted only once).If
all patterns produced by the six-base enzymesEcoRI, HindIII, BstEI, and BstEII are jointly considered in, for example, samples 8 uersus 20, n total of 18 of 29 fragments appear conserved. Thus F = 0.62,
N
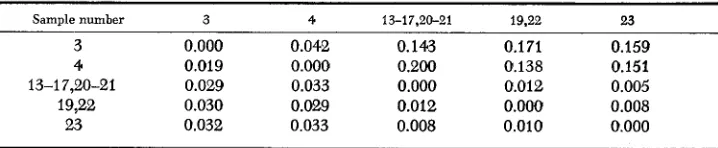
= 120, and p = 0.027 +- 0.015.Estimates of nucleotide sequence divergence for all pairwise sample compari- sons using 6-base enzymes and the 4-base enzyme HaeIII are presented in
MITOCHONDRIAL D N A SEQUENCES I N NATURAL POPULATIONS
TABLE 4
Matrix of genetic distances expressed in base substitutions per nucleoiide between all differentiable samples of Peromyscus, based upon a quantitative unalysis of
percentage of mtDNA fragments conserved with all 6-base enzyme digests (except PstI)
28 7
Sample 9.15, 12-14,
number 1 2 3 4 5-7 8 18-22 10 16-17 23
1 0.000 0.137 0.140 0.145 >0.250 >0.250 >0.250 >0.250 >0.250 >0.250 2 0.024 0.000 0.042 0.047 0.167 >0.250 0.102 0.083 0.129 0.097 3 0.023 0.017 0.000 0.005 0.227 >0.250 0.103 0.087 0.131 0.100 4 0.023 0.016 0.006 0.000 0.131 >0.250 0.109 0.090 0.137 0.089
5-7
-
0.028 0.030 0.024 0.000 0.030 0.023 0.023 0.020 0.0258
-
-
-
-
0.016 0.000 0.027 0.022 0.024 0.0269,15,18-22 - 0.023 0.023 0.022 0.014 0.015 0.000 0.004 0.005 0.010
10
-
0.021 0.024 0.021 0.014 0.014 0.006 0.000 0.009 0.01323
-
0.023 0.023 0.024 0.015 0.015 0.010 0.011 0.011 0.000Entries of >0.250 indicate no cleavage fragments were shared. Below diagonal: standard 12-14,16-17
-
0.025 0.024 0.024 0.013 0.014 0.007 0.009 0.000 0.012deviations of estimated sequence divergence. Samples numbered as in Table 1.
1972; PRAGER and WILSON 1978). In order to provide a pictorial summary of
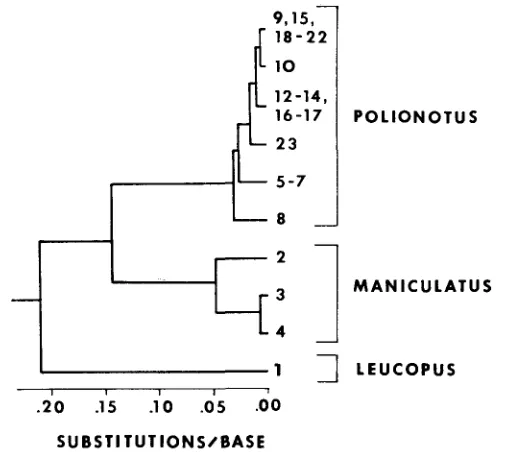
the distance matrix, and to permit contrast with the qualitative character state analysis presented in the next section, we have arbitrarily chosen a phenetic procedure discussed by SNEATH and SOKAL (1973). The resulting dendrogram, based upon the information in Table
4
and calculated according to the unweighted pair-group method with arithmetic means, is shown in Figure 3.Estimates of mtDNA nucleotide sequence divergence between Peromyscus populations at various stages of evolutionary differentiation are sumarized in Table 6. From this table and from Figure 3 there is clearly a strong corre- spondence between the probable level of evolutionary divergence among Pero- myscus samples and our estimates of their mtDNA sequence divergence. Families produced by females collected within a limited geographic area of a few square
TABLE 5
Matrix of genetic distances expressed in base substitutions per nucleotide between all samples of Peromyscus assayed with Haelll, based upon a quantitative analysis
of percentages of conserved fragments
Sample number 3 4 13-17,20-21 19.22 23
3 0.000 0.042 0.143 0.1 71 0.159
4 0.019 0.000 0.200 0.138 0.151
13-17,20-21 0.029 0.033 0.000 0.012 0.005
19,22 0.030 0.029 0.012 0.000 0.008
23 0.032 0.033 0.008 0.010 0.000
288 J . C. AVISE, R . A. LANSMAN A N D R . 0. SHADE
9 . 1 5 . 1
12-14,
5 - 7
8
LIONOTU S
M A N ICULATUS
LEUCOPUS
. 2 0 .15 .10 .05 .oo
S U 6 S T I TU T 10 N S/ BAS E
FIGURE 3.-Dendrogram of Peromyscus samples based on an unweighted pair-group method of analysis of estimated sequence divergence in mitochondrial DNA’s. The axis is in base substi- tutions per nucleotide. The cophenetic correlation equals 0.87.
miles exhibit approximately I
%
sequence divergence. Conspecific populations separated in locale of origin by several hundred miles have accumulated from1 to
4%
nucleotide substitutions. The three more widely separated populations of P . municulutus appear somewhat more distinct from one another on the average, though the samples from Michigan and Colorado are more similar than might have been expected. The majority of the individuals in the heterogeneousTABLE 6
Estimated genetic distance (mean f standard error) in base substitutions per nucleotide between Peromyscus populations ai various stages of evolutionary divergence
Comparison
Within geographic locality P . leucopus
P . maniculatus P . polionotus P . maniculatus P. polionotus
P. maniculatus us. P . polionotus Between geographic localities
Sibling species
Mean clistaqce
between collechons
500 feet 1/4 mile
1 mile
1000 miles 80-500 miles
Mean C S.E. base substitutions per nucleotide +base enzyme 6-base enzymes
- 0.000
-
<0.010 0.004 +. 0.002 0.002 +- 0.0010.042 0.031 f 0.013 0.015 +- 0.001
0.006 2 0.001
0.166 f 0.006 0.132 2 0.006 Nonsibling species
P . leucopus us. P. maniculatus
MITOCHONDRIAL D N A SEQUENCES I N NATURAL POPULATIONS 289
Colorado sample contain a mtDNA sequence that cannot be distinguished from the sequence present in the Michigan sample by any of the 6-base enzymes. The HaeIII digests of these samples are clearly different and allow a calculation of
divergence of p = 0.042. Curiously, the heterogeneity within the Colorado sample demonstrated by the 6-base enzyme digests suggests that the sample contains two mtDNA sequences that differ more greatly than samples collected from widely separated locales differ from one another.
P. maniculatus and P. polionotus are very closely related, sibling species (AVISE, SMITH and SELANDER 1979; DICE 1968). Our analysis suggests that their mtDNA sequences have diverged by 13 to 17%. The more distantly related species, P. leucopus, has diverged in mtDNA sequence by at least 20%.
It
should be pointed out that these calculated differences probably represent minimal esti- mates. The major source of error in the calculations is the possibility that non- homologous fragments of similar molecular weight can be scored as identical. The probability that this kind of error will be made increases when samples of widely differing sequences are compared, or when enzymes which produce a large number of fragments of similar molecular weights(i.e., HaeIII)
are included in the analysis.Qualitative analyses: The data presented in Table 3 can be alternatively analyzed from a different perspective, which is qualitative in approach and emphasizes similarities in the digestion patterns rather than differences. The basic assumption of this analysis is that complex digestion pattern phenotypes, such as those diagrammed in Figures 1 , 2 and 4, cannot be the result of conver- gent evolution from unrelated phenotypes. Thus, individuals or family units sharing a multiband pattem after digestion of mtDNA with one or more enzymes can be unambiguously assigned to a common evolutionary origin. For example, since all P. plionotus samples assayed share a common two-fragment BstEI digestion pattern, we can assert that they belong to a single “matriarchal lineage.”
Furthermore, many of the complex digestion patterns we have observed appear to be related by single base substitutions that result in loss or creation of a cleav- age site. For example, a substitution near the middle of the 7000 base pair frag- ment in EcoRI pattern I p (Figure 2) could create a new cleavage site so that the pattern would be converted to the 4-fragment pattern Iq in which the 3800 and 3100 base pair fragments replace the 7000 base pair fragment in Ip. Patterns that are interconvertible by single base substitutions are labeled with alpha- betically adjacent letters in Table 3. The information in Table 3 has been used to develop the phylogenetic network shown in Figure
5.
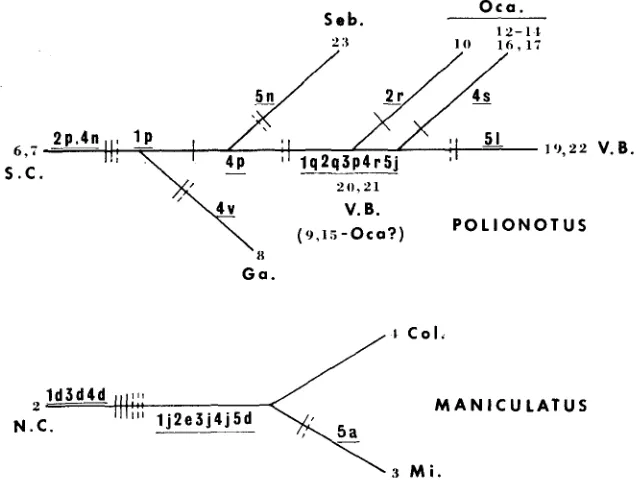
All samples connected in a given tree share at least one complex digestion pattern and hence a common origin. The branches of the tree indicate the kind and minimum number of base substitutions required to interconvert the digestion patterns produced by EcoRI, HindIII, BstEI, BstEII, and HaeIII. For example, a single change creating a new BstEII cleavage site in samples 20 and 21 (phenoytpe I g 2g 3p 4r 5 j ) yields phenotype l g 2q 3 p 4s5j,
which is found in samples 12, 13, 14, 16 and 17. On290 J. C. AVISE, R. A. L A N S M A N A N D R. 0. S H A D E
9 8 7 6 5 4 3 2 1 9 8 7 6 5 4 3 2 1
t r
r r r s s p
21570
-
U- -
2355 c.
2085
-
--
Y Y - - - - U
462 V
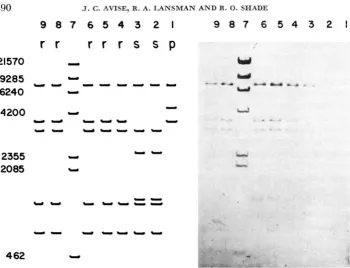
FIGURE 4.-Photograph and diagram of a DAPI-stained 1.1 % agarose gel containing BsfEII digests of P. polionotus mtDNA from samples collected in Florida. Well number 1: sample num- ber 23, pattern designated p; 2:13p; 3:14,s; 4:15,r; 5:18,r; 6:19,r; 8:2V,r; 9:21,r. Well number 7 contains phage A DNA digested with H i d 1 1 to produce molecular weight markers
(MURRAY and MURRAY 1975), the sizes of which are indicated to the left of the figure. In the mtDNA samples, bands with molecular weights lower than 1000 base pairs that are present in patterns r and s do not appear in the photograph, though they were clearly visible in the gel and Polaroid Type 55 negative from which the print was made.
The results of this analysis correlate well with the geographic origins of each sample. The Floridian populations of P. polionotus from Marion and Indian River Counties share complex phenotypes produced by all five enzyme digests, although heterogeneity among samples within these populations is also apparent in the HindIII, BstEII, and HaeIII digests. The sample from Highlands Co., Florida differs in the BstEII and
HaeIII
digests, but a minimum of only four base substi- tutions are required to convert it to a common pattern observed in the Indian River Co. population. The Georgia and South Carolina populations share a pheno- type produced by EcoRI that was not observed in the Floridian populations, but overall these populations appear more divergent both from each other and from the Florida samples.M I T O C H O N D R I A L D N A S E Q U E N C E S IN N A T U R A L P O P U L A T I O N S 29
1
O c a .
1 2 - 1 t Seb.
P O L I O N O T U S
G a .
I C o l .
/
FIGURE 5.-Phylogenies of samples of Peromyscus inferred from mtDNA fragment pheno- types produced by digestion with four to five different restriction endonucleases. The pattern arbitrarily taken as standard in P. polionotus is lq2q3p4~5j where the letters are distinct pheno- types produced by the respective enzymes listed in Table 3. Solid lines crossing branches of the tree represent the minimum observed number of digestion phenotype changes occurring along the pathway, and the number of solid plus dashed lines represents the minimum number of
base substitutions required to account for these changes. The fragment phenotypes are read additively. Thus, to go from the standard pattern in P. poZionofus to the pattern in sample number 23 (Seb.) involves changes from 4r to 4 p and 5 j to 5n, and the Seb, phenotype is read lq2q3p4p5n. The ancestral pattern could be that of any sample in the figure or others as yet un- known. Only samples sharing at least one complex phenotype (and hence traceable to a com- mon evolutionary origin) are linked into a given phylogeny. With our enzymes, no phenotype unambigously links our samples of P. polionotus to P. maniculatus.
292 J. C . AVISE, R. A. LANSMAN A N D R. 0. S H A D E
DISCUSSION
The mtDNA polymorphism differs from nuclear DNA polymorphism in
significant ways. I n sexually reproducing organisms, newly arising mutations in nuclear DNA may spread through a population by mating and recombination during meiosis. But if we accept the uniclonal nature of a n individual's comple- ment of mtDNA and complete maternal inheritance, a new mutation in mtDNA can appear only in direct descendants of the mutant female. Polymorphism must be maintained through sorting of clones whose mtDNA's follow indepen- dent evolutionary pathways. Sexual reproduction and mutations occurring in
males are irrelevant. By this reasoning we can draw some strong conclusions about genetic relatedness among individuals in a population if we can determine the extent to which they share mtDNA sequences.
All of the P. polionotus samples in our collection, gathered from locales encom- passing the majority of the species range, share the same sequence at two sites cleaved by the enzyme BstEZ. The entire species appears therefore to be descended from a single female or group of females belonging to a mtDNA clone. Similarly, we can describe the origins of local populations such as those that inhabit sampled locales at Marion and Indian River Counties, Florida. All individuals sampled from these locales appear linked to a common, more recently evolved mtDNA clone and share the mtDNA sequences cleaved by EcoRI and HindIII. The alternative descriptions of the origins of this species and its local populations, namely that they originate from a large number of distantly related females can, we believe, be ruled out.
These conclusions are not valid if sperm can contribute functional mtDNA molecules to the zygote that can be transmitted through germ cells of the progeny, and/or if mtDNA from sperm recombines with the maternally inherited mtDNA sequence. Even small paternal contributions could conceivably have long-term evolutionary effects in maintaining relative homogeneity within breeding popu- lations
(UPHOLT
and DAWID 1977). A possibly analogous situation for nuclear genes has been described by KIMURA and OHTA (1973). Since mitochondria from sperm have been observed to disperse into the zygote cytoplasm after fer- tilization (GRESSON 19M), the possibility of a paternal contribution of 10% or less to the mtDNA pool in the progeny cannot be ruled out. Therefore, a more rigorous exclusion of partial paternal inheritance is required.The time since separation of P. polionotus from P. maniculatus is not known with any certainty, but reasonable estimates are between IO5 and 2 X lo 6 years (BLAIR 1950). Since mtDNA sequences in the two species have diverged at about 15
%
of nucleotides, we can estimate a rate of divergence of between 1.5 x 1 0-6 and 7.5 x substitutions per nucleotide per year or roughly 3.8 X lo-' to 1.9 X substitutions per nucleotide per generation. The per generation rate is similar to that previously reported for goat and sheep mtDNA's (UPHOLT andMITOCHONDRIAL D N A SEQUENCES I N NATURAL POPULATIONS 293
DNA
hybridization experiments.KOHNE,
CHISCON andHOYER
(1972) calculate this rate to be betweenle8
andIf the rate of base substitution in Peromyscus is approximately linear with time, the magnitude of interlocality differences observed among conspecific populations suggests that the populations have had separate maternal ancestry for an average of between 7500 and 200,000 years. By the same reasoning, average clonal separation within local areas (the Marion Co. P. polionotus popu- lation for example) appears to be between 1000 and 30,000 years. Clonal het- erogeneity within localities could originate
in
situ, or through migration of mice into the locality from other areas. In any event, these age estimates seem very high. It is possible that an error arises because P. polionotus and P. maniculatus have actually been separate for less than 100,000 years. If this were the case, the rate of nucleotide substitution in mtDNA must be even greater than calcu- lated above. Another possibility is that the observed intraspecific polymorphism in mtDNA does not reflect the long-term evolutionary rate of nucleotide sub- stitution. This could conceivably be the case because some slightly deleterious substitutions, which would not in general persist over evolutionary time, could nonetheless contribute to intraspecific heterogeneity. This possibility has previ- ously been raised byUPHOLT
andDAWID
(1977) for mtDNA and by OHTA(1974) for nuclear genes.
The genus Peromyscus was chosen for these initial experiments using restric- tion endonuclease sequence analysis because of the extensive data accumulated on the evolution of this genus, using other techniques. I t is clear to us that the restriction technique is most valuable for demonstrating genetic heterogeneity within and among conspecific populations. The following characteristics of
mtDNA restriction analysis make the technique a powerful tool in the analysis of population structure: (1) each complex restriction phenotype is unique. The chances of an identical phenotype arising by convergence from unrelated pheno- types are extremely remote; (2) the phenotypes are transmitted intact, unaltered by recombination during sexual reproduction, so that all sequence changes can only arise from mutation; ( 3 ) mutations that are fixed in an individual result in a new phenotype that can be unambiguously linked to its progenitor;
(4)
the rate of appearance of new phenotypes by mutation is significant, but not un- manageably high. Thus, relatedness among individuals in a population isapparent despite the presence of easily detectable polymorphism; (5) the pheno- types are readily and quickly assayable-preparations of ten’s of samples can be accomplished in a reasonably short time.
The electrophoretic analysis of protein variation has become a standard molec- ular technique in population genetics, but typically fails criteria (1 )
,
(2) and ( 3 ) listed above. If the degree of sequence polymorphism in the mtDNA of other organisms proves comparable to that we have observed in Peromyscus, we expect that restriction analysis of mtDNA will provide a powerful tool to complement protein electrophoresis and will become the most sensitive technique available for reconstructing evolutionary relationships among conspecific populations.294 J. C. AVISE, R. A. L A N S M A N A N D R . 0. S H A D E
We are grateful to MICHAEL H. SMITH, JOHN PATTON, RAMONE BACCUS, and DAVID FOLTZ for supplying some of the specimens used in the study. RICHARD MEAGHER provided much helpful discussion during the study. The wrok was supported by Public Health Service Grant GM23N6 and National Science Foundation Grant DEB-7814195. R. 0. SHADE is a predoctoral trainee of the Public Health Service.
LITERATURE CITED
AVISE, J. C., M. H. SMITH and R. K. SELANDER, 1979 Biochemical polymorphism and system- atics in the genus Peromyscus VII. Geographic differentiation in members of the truei and maniculatus species groups. J. Mammal. 60: 177-192.
The transcription map of mouse mitochondrial DNA. Cell 14: 143-156.
BATTEY, J. and D. A. CLAYTON, 1978
BLAIR, W. F., 1950
BOGENHAGEN, D. and D. A. CLAYTON, 1974 The number of mitochondrial deoxyribonucleic acid
BORST, P., 1972 BOYER, H. W., 1971
Ecological factors in speciation of Peromyscus. Evolution 4: 253-275.
genomes in mouse L and human HeLa cells. J. Biol. Chem. 249: 7991-7995. Mitochondrial nucleic acids. Ann. Rev. Biochem. 41: 333-375.
DNA restriction and modification mechanisms i n bacteria. Ann. Rev. Microbiol. 25: 153-176. -, 1974 Restriction and modification of DNA: enzymes and substrates. Fed. Proc. 33: 1125-1127.
A comparison of the ribosomal DNA’s of Xaenopus laevis and Xaenopus mulleri: the evolution of tandem genes. J. Mol. Biol. 63: 57-73.
Restriction endonuclease cleavage maps of animal mitochondrial DNA’s. Proc. Natl. Acad. Sci. U.S. 71 : 461 7 4 6 2 1 .
Studies of mouse mitochondrial DNA in Escherichia coli: structure and function of eucaryotic and procaryotic chimeric plasmids. Cell 6: 231-244.
DAWID, I. B. and A. W. BLACKLER, 1972 Maternal and cytoplasmic inheritance of mtDNA in Xenopus. Develop Biol. 29: 152-161.
DICE, L. R., 1968 Speciation. Pp. 75-97, In: BioEogy of Peromyscus, edited by J. A. KING, Special Pub. 2, Am. Soc. Mammalogists.
FARRIS, J. S., 1972 Estimating phylogenetic trees from distance matrices. Am. Naturalist 106: 645-668.
FITCH, W. M., and E. MARGOLIASH, 1967 Construction of phylogenetic trees. Science 155:
279-284.
GREENE, P. J., H. L. HEYNEKER, F. BOLIVAR, R. L. RODRIGUEZ, M. C. BETLACH, A. A. COVAR- RUBIAS, K. BACKMAN, D. J. RUSSELL, R. TAIT and H. W. BOYER, 1978 A general method for the purification of restriction enzymes. Nucleic Acids Res. 7: 2373-2380.
Presence of the sperm middle-piece in the fertilized egg of the mouse
( M u s musculus). Nature 145: 425.
Strictly ma- ternal inheritance of rat mitochondrial DNA. Biochem. Biophys. Res. Comm. 83: 1032- 1038.
Analysis of endonuclease R-EcoRI fragments from lambdoid haeterophages and other viruses by agarose-gel electrophoresis. J. Virology 14: 1235-1244.
Maternal in- heritance of mammalian mitochondrial DNA. Nature 251 : 536-538.
BROWN, D. D., P. C. WENSINH and E. JORDAN, 1972
BROWN, W. M., and J. VINOGRAD.
CHANG, A. C. Y., R. A. LANSMAN, D. A. CLAYTON and S. N. COHEN, 1975 1974.
GRESSON, R. A. R., 194.0
HAYASHI, J. I., H. YONEKAWA, 0. GOTOH, J. WATANABE and Y. TAGASHIRA, 1978
HELLING, R. B., H. M. GOODMAN and H. M. BOYER, 1974
M I T O C H O N D R I A L D N A S E Q U E N C E S I N N A T U R A L P O P U L A T I O N S
295
JAKOVCIC, S. J. CASEY and M. RABINOWITZ, 1975 Sequence homology between mitochondrialDNA’s of different eukaryotes. Biochemistry 14 : 2043-2050.
KIMURA, M. and T. OHTA, 1973 The age of a neutral mutant persisting in a finite population. Genetics 75: 199-212.
KOHNE, D. E., J. A. CHISCON and B. H. HOYER, 1972 Evolution of mammalian DNA. Proc. 6th Berkeley Symp. Math. Statis. Probab. V, pp. 193-209. U. Calif. Press, Berkeley.
MICHAELIS, P., 1967 The investigation of plasmone segregation by pattern analysis. The Nu. cleus 10: 1-14.
MANIATIS, T., A. JEFFREY and H. VAN DE SANDE, 1975 Chain length determination of small double and single stranded DNA molecules by polyacrylamide gel electrophoresis. Biochem- istry 14: 3787-3794.
Phage lambda receptor chromosomes for DNA fragments made with restriction endonuclease I11 of Haemophilus influenme and restriction endo- nuclease I of Escherichia coli. J. Mol. Biol. 98: 551-564.
NASS, M. M. K., 1966 circularity of mitochondrial DNA. Proc. Natl. Acad. Sci. U.S.
56: 1215-1222.
OHTA, T., 1974 Mutational pressure as the main cause of molecular evolution and polymor- phism. Nature 252: 251-254.
OJALA, D. and G. ATTARDI, 1977 A detailed physical map of HeLa cell mitochondrial DNA and its alignment with the positions of known genetic markers. Plasmid 1: 78-105.
POTTER, S. S., J. E. NEWBOLD, C. A. HUTCHINSON, I11 and M. H. EDGELL, 1975 Specific cleavage analysis of mammalian mitochondrial DNA. Proc. Natl. Acad. Sci. US. 72: 4496-4500. PRAGER, E. M. and A. C. WILSON, 1978 Construction of phylogenetic trees for proteins and
nucleic acids: empirical evaluation of alternative matrix methods. J. Mol Evol. 11: 129-142. SACCONE, C., and A. M. KROON, 1976 The Genetic Function of Mitochondrial DNA. North.
Holland, New York.
SNEATH, P. H. A. and R. R. SOKAL, 1973 Numerical Taxonomy. W. H. Freeman, San Francisco. UPHOLT, W. B., 1977 Estimation of DNA sequence divergence from comparison of restriction
UPHOLT, W. B. and I. B. DAWID, 1977 Mapping of mitochondrial DNA of individual sheep and
Corresponding editor: W. W. ANDERSON MURRAY, K. and W. MURRAY, 1975
The
endonuclease digests. Nucleic Acids Res. 4: 1257-1265.