Transactions, SMiRT-25 Charlotte, NC, USA, August 4-9, 2019
Division VI
UPLIFT EVALUATION OF A PARTIALLY EMBEDDED
STRUCTURE WITH NONLINEAR SSI
Myrto Anagnostopoulou1, Charisis T. Chatzigogos2, Pierre-Alain Nazé3, Loic Zuchowski4
1 Senior Engineer, Géodynamique et Structure, France ([email protected]) 2 Senior Engineer, Géodynamique et Structure, Montrouge, France
3 Director, Géodynamique et Structure, Montrouge, France
4 Structural Engineer, Electricité de France (EDF), Tours, France
ABSTRACT
The present paper investigates the stability analysis of a typical partially embedded industrial building under seismic motion. The scope of the present study is to assess the coupling between the anticipated uplift mechanism of the building and the sliding mechanism along its raft by means of the conventional normative approach as well as by means of nonlinear transient analyses using 2D soil-structure models that account for nonlinear SSI effects. The motivation for the present study originates from the fact that using linear springs and the normative pseudo-static approach to assess the seismic stability of embedded structures may often lead to unrealistically high uplift ratio values (>30%), which are not admissible for structural design and floor response spectra definition.
DESCRIPTION OF THE STUDIED STRUCTURE
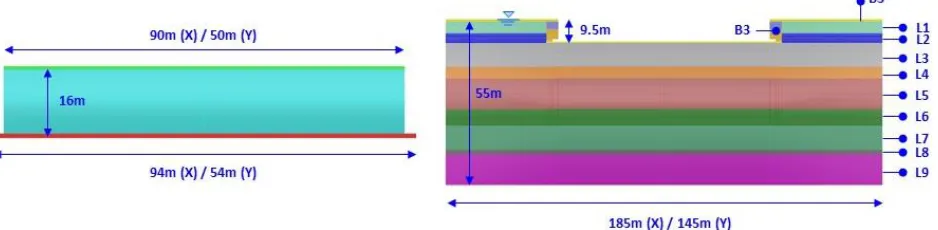
The studied building is a reinforced concrete structure with plan dimensions of 90m × 50m. The total height of the structure at its maximum is equal to 16m. The structure is buried on 4 sides with a maximum embedment depth of 9.5m. The structural system of the building is composed of reinforced concrete horizontal slabs and vertical walls while the foundation consists of a uniform raft directly placed on a stiff soil formation. There is a reinforced concrete toe around the full perimeter of the building which is approximately 2m wide. Because of its significant embedment and the presence of a high groundwater table, it is considered that the building is subject to important hydraulic and hydrodynamic effects. Figure 1 presents a schematic representation of the studied structure and its surrounding soil units, as well as their principal dimensions for each horizontal direction.
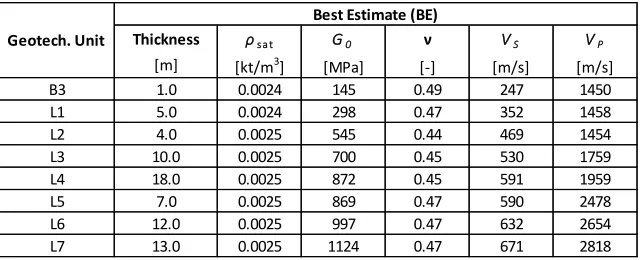
The natural ground surrounding the structure under consideration is characterized by a small strain shear modulus 𝐺0 profile that increases monotonically with depth. More specifically, the shear modulus 𝐺0 of the Best Estimate (BE) soil profile varies from 300MPa at the ground surface to 1100MPa at the rock formation boundary of the model, which is set at ~55m below the surface as shown in Table 1. To account for uncertainties related to mechanical soil properties, the shear modulus is varied by multiplying and dividing the BE profile by a factor of 2 in order to obtain the Upper Bound (UB) and Lower Bound (LB) profiles. Moreover, the full perimeter of the building is backfilled. The width of this backfill between the excavation profile and the foundation raft is approximately 2.5m at the base of the excavation.
Table 1: Soil stratigraphy and elastic properties for BE soil profile.
EARTHQUAKE DATA
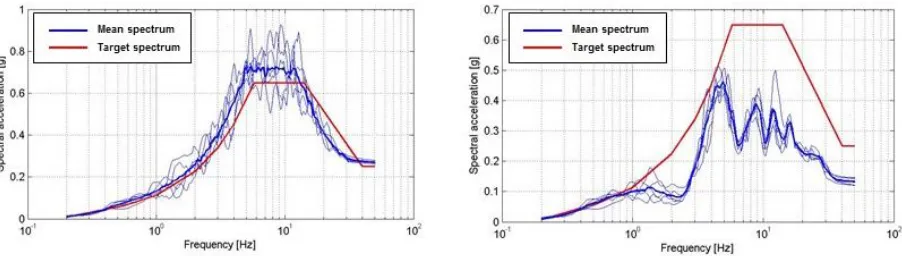
The design response spectrum in the horizontal direction for the studied industrial building is characterized by a peak ground acceleration equal to 0.25g and a spectral acceleration of 0.65g in the constant-acceleration range of the spectrum with a damping ratio of 5%. The vertical component of the spectrum is defined by multiplying the horizontal one by 2/3, which results to a peak vertical acceleration at ground surface which is equal to 2/3 × 0.25g = 0.167g. In addition, a set of 5 spectrum-compatible acceleration time histories is used in the nonlinear transient analyses of the structure under consideration.
PRELIMINARY ASSESSMENT OF UPLIFT RATIO
Firstly, a preliminary assessment of the seismic uplift ratio of the examined building is performed by means of a pseudo-static analytical study with the consideration of the coupling between the sliding and the uplift mechanisms along the foundation raft. For the needs of this study, it suffices to consider a typical cross-section along the transverse direction of the building, because this direction is expected to yield the highest uplift ratios (since the foundation width is smaller along this direction). The principle for the proposed method is presented hereafter.
The regime of forces exerted on the embedded structure is considered to yield a unitary safety factor against sliding. In other words, the following relationship is satisfied:
𝑉𝐸𝑑 = 𝐹𝑅𝑑+ 0.3𝐸𝑃 (1)
In equation (1), 𝑉𝐸𝑑 is the resultant driving horizontal force, 𝐹𝑅𝑑 is the sliding resistance and 𝐸𝑃 is the frontal earth resistance. The factor 0.3 in front of 𝐸𝑃 is applied to account for a concomitant consideration of friction resistance and frontal earth resistance (Eurocode 8 – Part 5). For the calculation of the sliding resistance 𝐹𝑅𝑑 two components can be considered: a) the sliding resistance at the raft 𝐹𝑀, b) the friction resistance along the lateral faces 𝐹𝑆. Equation (1) implies that the system is found on a sliding
Thickness ρs a t G0 ν VS VP
[m] [kt/m3] [MPa] [-] [m/s] [m/s]
B3 1.0 0.0024 145 0.49 247 1450
L1 5.0 0.0024 298 0.47 352 1458
L2 4.0 0.0025 545 0.44 469 1454
L3 10.0 0.0025 700 0.45 530 1759
L4 18.0 0.0025 872 0.45 591 1959
L5 7.0 0.0025 869 0.47 590 2478
L6 12.0 0.0025 997 0.47 632 2654
L7 13.0 0.0025 1124 0.47 671 2818
regime and allows to determine the unknown driving force 𝑉𝐸𝑑 that is developed within the structure. Then, by considering an appropriate point of application for 𝑉𝐸𝑑 (for earthquake loading, this is typically placed around the center of gravity of the building), it is possible to calculate the overturning moments developed at the raft and thus the corresponding uplift ratio of the structure.
The sliding resistance at the raft is equal to 𝐹𝑀 = 𝑁 tan 𝜙, where 𝑁 is the effective normal force at the raft and 𝜙 is the friction angle at the interface. In the following, we consider 𝜙 = 30° (the larger the value of friction angle 𝜙, the higher the expected uplift ratio). The effective normal force 𝑁 is obtained by subtracting the hydrostatic buoyant force 𝐴 and the vertical seismic inertial force 𝐸𝑍 from the weight of the structure 𝑊. The weight of the structure 𝑊 is taken as 870MN and the buoyant force 𝐴 under the foundation raft is taken as 500MN (the buoyancy criterion is satisfied). In the transverse direction, the fundamental frequency of the building is associated with a maximum horizontal acceleration of 0.53g and a maximum vertical acceleration of 0.35g that correspond to the constant-acceleration range of the spectrum.
The friction side resistance 𝐹𝑆 along the lateral faces, which are parallel to the excitation direction, can be approximated by considering a regime of earth pressures at rest acting at the lateral sides of the building. Under this assumption, the friction side resistance 𝐹𝑆 is:
𝐹𝑆=12𝐾0𝛾′𝐷2× 2𝐵 × tan 𝛿 (2)
Where 𝐾0 is the coefficient of earth pressure at rest (which can be taken equal to 𝐾0= 1 − sin 𝜙), 𝛾′ is the buoyant unit weight (𝛾′= 10kN/m3), 𝐷 is the embedment depth of the building (𝐷 = 9.5m), 𝐵 is the dimension of the building in the transverse direction (𝐵 = 54.0m), and 𝛿 is the friction angle at the soil-wall interface which can be taken equal to 𝛿 = 𝜙 (maximization of friction resistance).
The frontal earth resistance 𝐸𝑃 is calculated as follows:
𝐸𝑃=1 2𝐾𝑃𝛾
′𝐷2× 𝐿 × cos 𝛿 (3)
Where 𝐾𝑃 is the passive earth pressure coefficient and 𝐿 is the dimension of the building in the longitudinal direction (𝐿 = 94.0m). The coefficient 𝐾𝑃 can be calculated according to Figure C.2.1 of Eurocode 7: for 𝜙 = 𝛿 = 35° 𝐾𝑃= 8.7, which maximizes even further the friction resistance (and thus the anticipated uplift ratio), since it neglects the effect of inertial forces in the soil domain for the calculation of 𝐾𝑃. The results for the determination of uplift ratio in the studied building are presented in Table 2.
Table 2: Uplift ratio preliminary assessment.
The overturning moment 𝑀 is obtained from the equation:
𝑀 = 𝑉𝐸𝑑𝑙𝑉− 𝐹𝑆𝑙𝐹− 0.3𝐸𝑃𝑙𝑝 (4)
Physicial Quantity Symbol Unit Value
Effective normal force at foundaton N [kN] 62181 Friction force at mat foundation FM [kN] 35900
Friction resistance at sides FS [kN] 14069
Passive frontal earth resistance 0.3EP [kN] 95877
Driving Horizontal Force Ved [kN] 145846
Where 𝑙𝑉, 𝑙𝐹, 𝑙𝑃 the lever arm corresponding to forces 𝑉𝐸𝑑, 𝐹𝑆 and 𝐸𝑃 with respect the base of the raft. Lever arm 𝑙𝑉 is taken equal to 8.10m. Lever arm 𝑙𝐹 = 𝑙𝑃= 𝐷 3⁄ = 3.2m.
With the couple (𝑀, 𝑁) in hand, a simplified evaluation of the uplifted area of the foundation is performed assuming that the base raft of the building is a reinforced concrete section subjected to combined bending moment and axial force. This simplified evaluation leads to an uplift ratio of 24%, which proves to be lower than the commonly allowable code limit of 30%.
NONLINEAR SSI ANALYSIS METHODOLOGY
The detailed assessment of seismic uplift ratio and sliding of the examined building is performed by means of a series of nonlinear dynamic analyses. The nonlinear analyses of the partially buried structure and its surrounding soil are based on the development of a two-dimensional model for each horizontal direction of the building. The main advantages of using 2D finite element models instead of a complete 3D model are the overall reduced dimensions of the models, the reduced computing time and the more easily-achieved convergence criteria of nonlinear analysis. The following sections summarize the principal steps of the adopted methodology.
Free-field Site Response Analysis
Prior to the nonlinear analyses, an 1D model representing the soil column outside the structure’s excavation dig is modelled. The analysis of the representative free field soil column allows to define the soil properties of the layers surrounding the structure under consideration and obtain the free-field seismic motion at all depths from the ground surface down to the substratum. It is noted that, the soil layers are initially modelled using a linear elastic material model corresponding to the LB, BE and UB soil properties (as defined previously), whereas a sensitivity analysis is also performed which accounts for the influence of the nonlinear soil behavior on the building’s stability assessment results. The results of the sensitivity study will be presented in a dedicated section.
Initially, the degraded linear soil characteristics for each layer of the LB, BE and UB soil profiles are calculated by means of equivalent linear site response analyses using the program SHAKE91 (Idriss & Sun, 1991). One 1D soil model is developed for each soil profile on the basis of the idealized soil stratigraphy used to represent the variation in stiffness and damping properties of the ground. The 5 acceleration time histories representing the seismic motion are then injected at the ground surface; a deconvolution site response analysis is performed for calculating the effective soil properties and the acceleration time histories at various depths of the soil column.
comparison with the surface one. These results verify the modelling procedure and inputs used for the natural ground surrounding the structure in the DYNAFLOW analyses.
Figure 2. BE profile – Surface and substratum free field response spectra obtained from reconvolution analyses with DYNAFLOW.
Development of 2D Finite Element Models
The nonlinear transient analyses of the examined building and its surrounding soil are based on the development of a separate 2D model for each horizontal direction of the structure using the finite element code DYNAFLOW. The development of the 2D models is based on the following concepts:
Each model represents a vertical section of the building passing from its center of gravity;
All structural elements are modelled with 4-node 2D continuum elements with 2 degrees of freedom per node (2 translations) using a linear elastic material model;
All soil elements are modelled with 4-node 2D continuum elements with 2 degrees of freedom per node (2 translations) using the degraded effective linear soil stiffness profiles used for the free-field motion analysis described above;
All interfaces between structural elements and soil elements are modelled with nonlinear contact elements used to capture the nonlinear dynamic phenomena of sliding and detachment along the soil-structure interfaces of the semi-buried building;
A nodal mass is assigned to the center of gravity of the building in each horizontal direction. The nodal mass is equal to the modal mass corresponding to the fundamental frequency of the fixed base structure in the direction of interest. This mass is assigned to a fixed non-structural node, which is connected to the center of gravity of the building by means of two elastic springs in the horizontal and vertical direction. The stiffness of the horizontal elastic spring is defined to match the fundamental frequency of the building for each direction, whereas the vertical elastic spring is considered to be infinitely rigid. The rest of the mass of the building is uniformly distributed over all structural elements;
In order to limit the boundary effects, the model extends laterally to at least 40m beyond the perimeter of the excavation dig where the motion is considered to be equal to the free-field motion; The maximum mesh size of the structural and soil elements is ~1m.
model with main dimensions for each horizontal direction, as well as the contact elements used to connect the structure-soil interfaces.
Figure 3. 2D finite element analysis model.
The interfaces between the structural continuum elements and the soil continuum elements are modelled using the following interface elements available in the code DYNAFLOW (see Figure 3):
Slide-Line Elements with Coulomb Friction that connect the lower interface of the building’s mat foundation to the underlying soil elements. These elements allow uplifting of the foundation and prohibit the interpenetration of the two surfaces in the normal direction to the structure-soil interface, whereas they allow sliding along the structure-soil interface in the tangential direction; Contact Surface Elements that connect the structure’s exterior vertical walls and the extensions of
the mat foundation to the fill material surrounding the building. These elements allow frictionless sliding in the structure-soil contact interfaces.
Moreover, the boundary conditions of the vertical lateral boundaries of the soil model are defined using the periodic conditions or slaved nodes approach according to which the lateral boundaries are considered to be located far enough so that the motion close to these boundaries can be found to satisfactorily approximate the free-field motion by applying periodic boundary conditions.
Finally, in order to inject the acceleration time histories at the lower boundary of the soil model, two sets of transmitting boundary elements are introduced at that elevation: one in the horizontal and one in the vertical direction. The mechanical characteristics of the transmitting boundaries, which are equivalent to horizontal and vertical viscous dashpots, depend respectively on the shear wave velocity and the P-wave propagation velocity of the underlying substratum respectively. It is noted that the transmitting boundary elements are activated after conducting a preliminary analysis under self-weight of the DYNAFLOW model.
NONLINEAR DYNAMIC ANALYSIS
Nonlinear dynamic analyses of the two 2D finite element models developed in DYNAFLOW are performed for each of the three soil profiles - Lower Bound (LB), Best Estimate (BE) and Upper Bound (UB) – and the acceleration time histories obtained from deconvolution analysis. The total number of nonlinear dynamic analyses conducted within this study is: 2 directions × 3 soil profiles × 5 records = 30 analyses. All nonlinear dynamic analyses are performed with the finite element code DYNAFLOW.
to the total number of contact elements at each time step of the acceleration time history. The results of the stability assessment are presented independently in each horizontal direction of the building in the following sections.
Longitudinal Direction (X)
The relative horizontal displacement and uplift time histories for the Best Estimate (BE) profile and the 5 acceleration sets are presented on Figure 4. It can be seen that sliding between the building and its underlying soil occurs for acceleration set COMB1 and COMB4, whereas the maximum horizontal relative displacement is approximately 0.01cm. Moreover, uplifting of the building occurs for all considered acceleration sets and the maximum uplift is approximately 20% for acceleration set COMB1.
Figure 4. Best Estimate profile – Relative horizontal displacement and uplift time histories.
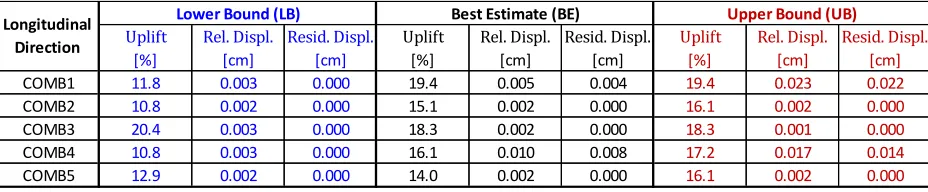
The stability assessment results in the longitudinal direction of the building (X) from the LB, BE and UB profiles are compared in Table 3. The results show that in the longitudinal direction and for all 3 soil profiles considered in this study, the maximum horizontal relative displacement is ~0.023cm and the maximum horizontal residual displacement is ~0.022cm. Moreover, the maximum uplift ratio is 20.4% for the LB profile.
Table 3: Longitudinal direction – Maximum relative displacement and uplift ratio results.
Transverse Direction (Y)
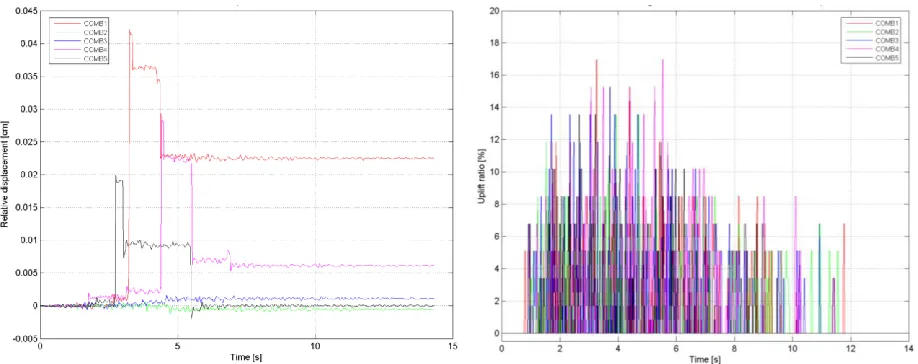
The relative horizontal displacement and uplift time histories for the Best Estimate (BE) profile and the 5 acceleration sets are presented in Figure 5. It can be seen that sliding between the building and its underlying
Uplift Rel. Displ. Resid. Displ. Uplift Rel. Displ. Resid. Displ. Uplift Rel. Displ. Resid. Displ.
[%] [cm] [cm] [%] [cm] [cm] [%] [cm] [cm]
COMB1 11.8 0.003 0.000 19.4 0.005 0.004 19.4 0.023 0.022
COMB2 10.8 0.002 0.000 15.1 0.002 0.000 16.1 0.002 0.000
COMB3 20.4 0.003 0.000 18.3 0.002 0.000 18.3 0.001 0.000
COMB4 10.8 0.003 0.000 16.1 0.010 0.008 17.2 0.017 0.014
COMB5 12.9 0.002 0.000 14.0 0.002 0.000 16.1 0.002 0.000
Upper Bound (UB)
Longitudinal Direction
soil occurs for acceleration set COMB1, COMB4 and COMB5, whereas the maximum horizontal relative displacement varies from 0.02cm to 0.04cm. Moreover, uplifting of the building occurs for all considered acceleration sets and the maximum uplift is approximately 17% for acceleration set COMB1 and COMB4.
Figure 5. Best Estimate profile – Relative horizontal displacement and uplift time histories.
The stability assessment results in the transverse direction of the building (Y) from the LB, BE and UB profiles are compared in Table 4. The results show that in the transverse direction and for all 3 soil profiles considered in this study, the maximum horizontal relative displacement is ~0.067cm and the maximum horizontal residual displacement is ~0.023cm. Moreover, the maximum uplift ratio is 27.1% for the UB profile.
Table 4: Transverse direction – Maximum relative displacement and uplift ratio results.
In addition to these results, Figure 6 presents the uplift time history for the BE profile and acceleration set COMB4, which yields a maximum uplift ratio of 16.9%, as well as the normal contact force 𝐹𝑛 developed in each Slide-Line element connecting the foundation mat to the underlying soil unit for three characteristic time steps. For time step 𝑡1= 0.03s, the normal contact force 𝐹𝑛 is greater than zero for all elements; this shows that the foundation raft is in contact with the soil and uplift is equal to zero. However, for time step 𝑡2= 3.07s, the normal contact force 𝐹𝑛 is equal to zero on the left side of the building (from 𝑥 = -25.5m to 𝑥 = -18.5m) that corresponds to an uplifting ratio of 15.3%. Finally, for time step 𝑡3= 3.16s, the normal contact force 𝐹𝑛 is equal to zero on the right side of the building (from 𝑥 = 20.0m to 𝑥 = 25.5m) that corresponds to an uplifting ratio of 10.2%. On one hand, these results validate the use of Slide-Line Elements with Coulomb Friction for modelling the non-linear soil–structure interaction effects arising at the foundation level and on the other hand, demonstrate that uplift mechanism is coupled to rocking of the foundation during the seismic excitation.
Uplift Rel. Displ. Resid. Displ. Uplift Rel. Displ. Resid. Displ. Uplift Rel. Displ. Resid. Displ.
[%] [cm] [cm] [%] [cm] [cm] [%] [cm] [cm]
COMB1 15.3 0.006 0.004 16.9 0.042 0.023 27.1 0.067 0.003
COMB2 13.6 0.004 0.003 13.6 0.001 0.000 22.0 0.011 0.004
COMB3 15.3 0.001 0.000 15.3 0.002 0.001 15.3 0.008 0.003
COMB4 15.3 0.009 0.007 16.9 0.029 0.006 15.3 0.013 0.002
COMB5 15.3 0.008 0.000 13.6 0.020 0.000 15.3 0.031 0.000
Transverse Direction
Figure 6. Best Estimate profile – Acceleration set COMB4 – Evolution of uplift with time.
SENSITIVITY ANALYSIS ON FILL MATERIAL
In order to check the sensitivity of the stability assessment results presented in the previous section, additional nonlinear analyses have been performed using the 2D model of the building in the transverse direction and the Upper Bound (UB) soil profile, whereas the fill material surrounding the building are modelled using the elastoplastic multi-yield constitutive model implemented in DYNAFLOW, known as Prevost’s model.
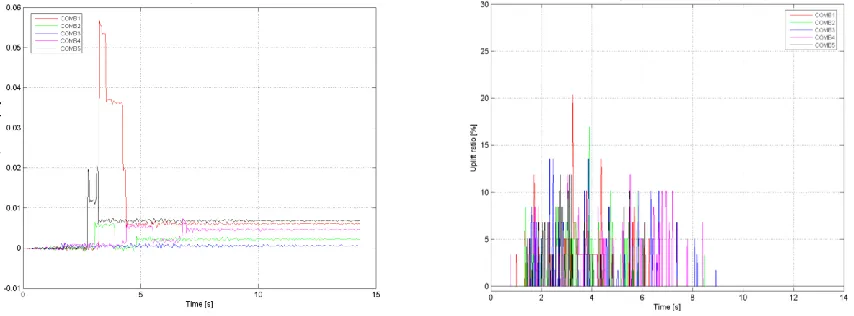
The relative horizontal displacement and uplift time histories for the 5 acceleration sets are presented on Figure 7. It can be seen that sliding between the building and its underlying soil occurs for acceleration set COMB1 and COMB5, whereas the maximum horizontal relative displacement varies from 0.02cm to 0.06cm. Moreover, uplifting of the building occurs for all considered acceleration sets and the maximum uplift is approximately 20% for acceleration set COMB1. The stability assessment results are summarized in Table 5.
Figure 7. Nonlinear soil model analysis – Relative horizontal displacement and uplift time histories.
t1
t1 = 0.03s
𝑭𝒏≠ 0
Uplift = 0% t2
t2 = 3.07s
𝑭𝒏= 0
Uplift = 15.3% t3
t3 = 3.16s
𝑭𝒏= 0
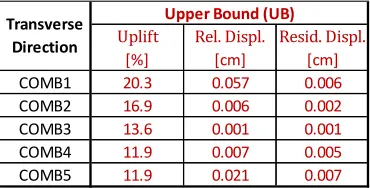
Table 5: Nonlinear soil model analysis – Maximum relative displacement and uplift ratio results.
These results can be compared to the results presented on Figure 4 and in Table 3. It can be noted that the maximum horizontal relative displacement is reduced from 0.067cm for the case of linear elastic fill materials to 0.057cm for the case of nonlinear fill materials and acceleration set COMB1, whereas the maximum uplift is reduced from 27.1% to 20.3% respectively.
CONCLUSION
The preliminary assessment of the uplift ratio for the studied building presented in this paper is based on the coupling between the sliding mechanism and the uplift mechanism activated along the raft of the building. This preliminary evaluation shows that the expected uplift ratio of the building is equal to 24%. The uplift ratio depends on the anticipated vertical accelerations in the building that control the effective normal force on the raft, which should in all cases remain in positive (to satisfy the stability criterion against buoyancy).
A detailed verification of the seismic stability of the studied building was also performed by means of nonlinear transient dynamic analyses of a 2D finite element model for each horizontal direction of the building and 3 ground stiffness profiles. These analyses incorporate the presence of nonlinear contact elements between the structure-soil interfaces allowing the uplifting and the sliding along these interfaces.
The main results of the nonlinear analyses presented in this paper show that sliding between the foundation raft and the underlying soil remains limited (< 0.07cm), therefore the sliding phenomenon is not detrimental for the general stability of the building. On the other hand, it was shown that the maximum uplift of the foundation varies between 11% and 27%, whereas when both uplift and soil yielding in the fill material are considered, the maximum uplift of the building is reduced to 20%. Nevertheless, the anticipated levels of uplift ratios at the foundation level have been shown to be less than the commonly allowable code limit of 30%.
REFERENCES
European Committee for Standardization. (2005). NF-EN-1998-5 – Eurocode 8: Design of structures for earthquake resistance - Part 5: Foundations, retaining structures and geotechnical aspects.
European Committee for Standardization. (2005). NF-EN-1997-1 – Eurocode 7: Geotechnical Design - Part 1: General rules.
Idriss, I. M., Sun, J. I. (1992). “SHAKE 91: A Computer Program for Conducting Equivalent Linear Seismic Response Analyses of Horizontally Layered Soil Deposits,” Center of Geotechnical Modeling, Department of Civil & Environmental Engineering, University of California, Davis, California, USA.
Prevost, J. H. (2013). “DYNAFLOW – Version 02 Release 13.A,” Department of Civil and Environmental Engineering, Princeton University, New Jersey, USA.
Uplift Rel. Displ. Resid. Displ.
[%] [cm] [cm]
COMB1 20.3 0.057 0.006
COMB2 16.9 0.006 0.002
COMB3 13.6 0.001 0.001
COMB4 11.9 0.007 0.005
COMB5 11.9 0.021 0.007
Transverse Direction