O R I G I N A L R E S E A R C H
A study on the epidemiology of tinnitus in the
United Kingdom
This article was published in the following Dove Press journal: Clinical Epidemiology
Nadja A Stohler 1,2
Daphne Reinau 1,2
Susan S Jick 3,4
Daniel Bodmer5
Christoph R Meier 1–3
1Basel Pharmacoepidemiology Unit, Division of Clinical Pharmacy and Epidemiology, Department of Pharmaceutical Sciences, University of Basel, Basel, Switzerland;2Hospital Pharmacy, University Hospital Basel, Basel, Switzerland;3Boston Collaborative Drug Surveillance Program, Lexington, MA, USA;4Boston University School of Public Health, Boston, MA, USA; 5Department of Biomedicine and Clinic for Otorhinolaryngology, University Hospital Basel, Basel, Switzerland
Purpose: Subjective tinnitus is a common symptom with potentially negative impact on quality of life. More research is required to gain a deeper understanding of the disease and its clinical presentation. To estimate the incidence of tinnitus and to describe patient-related characteristics such as lifestyle factors and comorbidities.
Patients and methods: Using the Clinical Practice Research Datalink, we calculated
incidence rates of first-time diagnosed tinnitus in an adult population between 2000 and
2016. We stratified incidence rates by sex, age, and year of diagnosis. Additionally, we
performed a 1:1 matched case-control study comparing body mass index, lifestyle factors and selected comorbidities between patients with incident tinnitus and tinnitus-free controls. Results:We identified 109 783 adults with afirst-time diagnosis of tinnitus between 2000 and 2016, yielding an overall age-standardized incidence rate of 25.0 new tinnitus cases per
10,000 person-years (95% CI: 24.6–25.5). There was a steady increase in tinnitus incidence
throughout the study period. Approximately 80% of tinnitus cases were diagnosed at age
40 years or older. We observed the highest incidence rate in individuals aged 60–69 years
(41.2 per 10,000 person-years, 95% CI: 40.7–41.7). Smokers and alcohol drinkers were at
lower risk of being diagnosed with tinnitus compared with non-smokers and non-drinkers, respectively. The occurrence of tinnitus was strongly associated with a recent diagnosis of several otological and vestibular disorders as well as head and neck disorders.
Conclusion:The present observational study found an increasing incidence of tinnitus over
time, emphasizing the continuously growing health burden. The findings on patient
char-acteristics, lifestyle factors, and selected comorbidities contribute to a better understanding of risk factors for tinnitus.
Keywords:case-control study, clinical practice research datalink, lifestyle factors, incidence rates, tinnitus
Introduction
Patients suffering from subjective tinnitus experience a perception of sound in the absence of an external source. It is a symptom audible only to the patient, and not to
the examiner.1–3 The nature of tinnitus varies and is described as ringing, buzzing,
clicking, hissing, roaring, humming, or pulsations. The manifestation differs
consid-erably in severity, ranging from mild to very bothersome.4,5A severe, persistent form
commonly introduces comorbidities such as sleep disturbance, anxiety or depression,
and as a consequence substantially affect the patients’quality of life.6–9
Tinnitus is a frequent symptom in the developed world. Nevertheless, there is no
universal definition, and as a result epidemiological studies report a wide range of
prevalences extending from 5.1% to 42.7%.10In the United Kingdom (UK), a large
Correspondence: Christoph R Meier Basel Pharmacoepidemiology Unit, Hospital Pharmacy, University Hospital Basel, Spitalstrasse 26, Basel 4031, Switzerland
Tel +41 61 556 5369 Fax +41 61 265 8875 Email christoph.meier@usb.ch
Clinical Epidemiology
Dovepress
open access to scientific and medical research
Open Access Full Text Article
Clinical Epidemiology downloaded from https://www.dovepress.com/ by 118.70.13.36 on 20-Aug-2020
observational study reported an incidence rate of 5.4 cases
of clinically significant tinnitus per 10,000 person-years,11
and another study estimated the annual healthcare burden of tinnitus-related costs to be £750 million in the National
Health Service (NHS).12 A similar study in the
Netherlands attributed €1.9 billion of direct health care
costs to tinnitus, whereas the total cost of illness (health care costs, productivity losses, and out-of-pocket costs)
was considerably higher amounting to€6.8 billion.13
The pathophysiology of tinnitus is not fully understood,14
however, there has been remarkable progress in recent years. Results from animal studies, mainly in rodents, complemen-ted by imaging studies in humans suggest various underlying mechanisms affecting auditory and non- auditory brain areas, as well as the interaction between the auditory and the
somatosensory structures.15,16Based on these
pathophysio-logical concepts, various therapeutic compounds (mostly approved for other indications) were tested in tinnitus patients. Despite this substantial effort, clear evidence for
an effective pharmacological treatment is still lacking.16–18
The difficulty to demonstrate replicable significant clinical
benefit may be explained by the heterogeneity of tinnitus (in
terms of perception, distress, concomitant comorbidities and
risk factors, as well as the underlying etiology).19–21Thus, to
date guidelines do not recommend any specific drug
therapy.2,15
More research is required to gain a deeper under-standing of the disease and a better characterization of affected patients, including lifestyle factors and common comorbidities
In this population-based study, we estimate the inci-dence of tinnitus recorded by general practitioners (GPs) in the UK from January 2000 to December 2016, and describe patient-related characteristics with respect to demography, lifestyle factors and comorbidities compared with persons without tinnitus.
Materials and methods
Data source
We used primary care data derived from the Clinical Practice Research Datalink (CPRD) obtained under license
from the UK Medicines and Healthcare products
Regulatory Agency (MHRA). The CPRD is an anon-ymized database created in 1987 that contains ongoing medical records from over 11 million patients provided
by approximately 700 GP practices throughout the UK.22
Recorded data include patients’ demographics, lifestyle
factors, diagnoses, signs and symptoms, treatments, test
results, and referrals to secondary care.22–24 CPRD
patients represent the general UK population with respect
to sex, age and ethnicity.22 Several studies have reported
on the high quality and validity of the database.23,25,26The
Independent Scientific Advisory Committee (ISAC) for
Medicines and Healthcare products Regulatory Agency database research (MHRA) approved the study (protocol number: 18_024R) and the study protocol was available to the journal and reviewers.
Study design and study population
We established two separate study populations. First, we conducted a retrospective cohort study to quantify
inci-dence rates (IRs) of first-time diagnosed tinnitus.
Therefore, we included all adult patients who were present in the CPRD population between 2000 and 2016 and who had a minimum active history in the CPRD of 3 years prior to cohort entry. We excluded patients if they had a recorded diagnosis for malignant cancer or HIV/AIDS prior to cohort entry.
Second, we conducted a separate case-control study,
for which we identified all patients in the CPRD with a
first-time Read code for tinnitus at the age of 18 years or
older between January 1st, 2000 and December 31st, 2016 (cases). Like in the cohort study, we excluded all patients with less than three years of recorded history in the CPRD
prior to the date of thefirst tinnitus diagnosis (index date)
to minimize outcome misclassification be including
pre-valent tinnitus cases. In addition, we again excluded patients with any record of malignancy or HIV/AIDS prior to the index date, as these patients may receive specialized care and often suffer from various additional comorbidities.
We matched each tinnitus case to a randomly selected control patient who did not have a recorded diagnosis for tinnitus in the CPRD medical record. Cases and controls were matched on sex, age, general practice, years of his-tory in the CPRD, and calendar time and we applied the same exclusion criteria to controls as we did to cases.
Statistical analysis
In the cohort analysis, we calculated crude and
age-stan-dardized IRs (ASR) offirst-time diagnosed tinnitus in the
CPRD population by dividing the total number of incident tinnitus diagnoses by the person-years (PY) at risk overall
as well as stratified by age, sex, and year of diagnosis. We
assessed PY at risk by summing-up person-time between
Clinical Epidemiology downloaded from https://www.dovepress.com/ by 118.70.13.36 on 20-Aug-2020
cohort entry and the end of follow-up, which was defined
as the earliest out of the day of a first-time diagnosis of
tinnitus diagnosis, death, leaving the practice, or
December 31st, 2016. Age-standardization was performed using the European Standard Population published in 2013
by Eurostat, the Statistical Office of the European Union.27
In the case-control analysis we conducted conditional logistic regression analyses to calculate odds ratios (ORs)
with 95% confidence intervals (CIs) for the following
exposure groups: BMI (<18.5, 25.0–29.9, ≥30.0, and
30.0–34.9, 35.0–39.9, ≥40 kg m−2, unknown, compared
to normal BMI [18.5–24.9 kg m−2]), smoking
(ex-smo-kers, current smo(ex-smo-kers, unknown smoking status compared to non-smokers) and alcohol consumption (ex-drinkers, current drinkers subdivided in units per week, unknown status, compared to non-drinkers). Furthermore, we inves-tigated the association between tinnitus and selected comorbidities (systemic somatic diseases and neurologi-cal/psychological disorders, otological and vestibular dis-orders, and head and neck disorders) overall as well as
stratified by sex. For otological or vestibular disorders as
well as for head and neck disorders, we also considered the amount of time between the last record of the
respec-tive condition and the index date (≤30, 31–360 days or
>360 days prior to (including) the index date). All covari-ates were assessed prior to the index date.
We adjusted all OR for smoking, alcohol consumption, and BMI. We did not adjust for any other comorbidities due to the descriptive nature of this analysis.
For confidentiality reasons, we do not provide the
number of patients in categories containing less than five
patients.
We performed all analyses using SAS 9.4 software (SAS Institute, Cary, North Carolina, USA). Statistical
significance was set at the alpha level of 0.05.
Results
Characteristics of the study population
We identified 109,783 adults with a first-time recorded
Read code for tinnitus between January 2000 and December 2016. There was a similar number of males and females. The mean age was 54.7 years (standard deviation [SD] ±15.9), though women were slightly older than men at the time of diagnosis (55.7 [SD ±16.5] and 53.6 [SD ±15.2] years, respectively). Approximately two thirds of the tinnitus cases were between 40 and 69 years
of age atfirst recording of tinnitus (Table 1).
Incidence rates (IRs)
Age-standardized IR (ASR) offirst time GP-recorded
tin-nitus was 25.0 per 10,000 PY (95% CI: 24.6–25.5), and
rates were similar for men (ASR of 25.7, 95% CI: 25.0–
26.4) and women (ASR 24.7, 95% CI: 24.0–25.3 per
10,000 PY). The IRs increased with age and were highest
in the age group 60–69 years (41.2 per 10,000 PY, 95%
CI: 40.7–41.7, Figure 1). During the course of the study
period, we found a steady increase in the incidence of
tinnitus, which was similar in men and women (Figure 2)
as well as in younger and older adults (<30 years and
≥30 years of age; data not shown). IRs stratified by sex,
age group, and year of diagnosis (age-standardised and
crude incidence rates) are provided in theTable S1.
Lifestyle factors
We observed an adjusted ORs for diagnosed tinnitus of 0.91
(95% CI: 0.89–0.94) in obese patients (BMI≥30.0 kg/m2),
and an adjusted ORs of 0.91 (95% CI: 0.84–0.97) in
under-weight patients (BMI <18.5 kg/m2), when compared to
individuals of normal weight.
Compared with non-smokers, current smokers were at a reduced risk of being diagnosed with tinnitus (adj. OR
0.78, 95% CI: 0.76–0.80). Overall, current alcohol
drin-kers had a minimally decreased risk compared to non-drinkers. However, the effect became stronger with increasing levels of alcohol consumption (in consumed
units of alcohol per week,Table 1).
Comorbidities
Internal diseases and neurological/psychological disorders
We observed an increased risk of being diagnosed with tinnitus
in patients with insomnia (adj. OR 1.45, 95% CI: 1.41–1.49),
anxiety (adj. OR 1.39, 95% CI: 1.35–1.42), and depression
(adj. OR 1.31, 95% CI: 1.28–1.34). We found a decreased risk
of being diagnosed with tinnitus in patients with dementia (adj.
OR 0.43, 95% CI: 0.37–0.50), Parkinson’s disease (adj. OR
0.63, 95% CI: 0.54–0.74), and schizophrenia (adj. OR 0.76,
95% CI: 0.69–0.85). No association was found between
tinni-tus and seizures/epilepsy or multiple sclerosis.
Cardiovascular comorbidities (arrhythmia, hypertension, myocardial infarction, congestive heart failure, and stroke/ transient ischemic attack) did not reveal any meaningfully increased or decreased ORs. Diabetes mellitus revealed a
decreased adjusted OR of 0.85 (95% CI: 0.83–0.89), whereas
other metabolic diseases (hyperlipidemia, hypothyroidism,
Clinical Epidemiology downloaded from https://www.dovepress.com/ by 118.70.13.36 on 20-Aug-2020
and hyperthyroidism) were not associated with the risk of being diagnosed with tinnitus.
Irritable bowel syndrome andfibromyalgia were
statisti-cally significantly associated with the risk of being diagnosed
with tinnitus (adj. ORs 1.56, 95% CI: 1.51–1.61, and 1.54,
95% CI: 1.42–1.67), whereas ORs for asthma, COPD, and
rheumatoid arthritis were not associated (Table 2).
Stratification by sex did not reveal meaningful effect
modification for the risk of tinnitus in association with
mental health and other comorbidities (Table S2).
Otological and vestibular disorders
Having a medical history of various otological or vestibu-lar disorders was associated with a higher risk of being diagnosed with tinnitus. All inner ear conditions evaluated were found positively associated with tinnitus. This included common conditions such as ear infections (labyr-inthitis, otitis media, or otitis externa) and cerumen, as well as rarer conditions such as sensorineural or conduc-tive hearing loss, acute vestibular neuritis or benign posi-tional vertigo. These observed associations were stronger
Table 1Distribution of patient characteristics and lifestyle factors in patients with tinnitus and their matched controls
Tinnitus cases (%) Tinnitus-free controls (%) OR crude (95% CI) OR adjusteda(95% CI)
Sex
Male 53,874 (49.1) 53,874 (49.1) NA NA
Female 55,909 (50.9) 55,909 (50.9) NA NA
Age (years)
<20 1097 (1.0) 1100 (1.0) NA NA
20–29 7118 (6.5) 7109 (6.5) NA NA
30–39 11,757 (10.7) 11,757 (10.7) NA NA
40–49 19,454 (17.7) 19,476 (17.7) NA NA
50–59 26,247 (23.9) 26,233 (23.9) NA NA
60–69 24,097 (22.0) 24,122 (22.0) NA NA
70–79 13,860 (12.6) 13,823 (12.6) NA NA
≥80 6153 (5.6) 6163 (5.6) NA NA
BMI (kg/m2)
12.0–18.4 1561 (1.4) 1634 (1.5) 0.88 (0.82–0.95) 0.91 (0.84–0.97)
18.5–24.9 36,055 (32.8) 33,901 (30.9) 1.00 (reference) 1.00 (reference)
25.0–29.9 36,138 (32.9) 32,981 (30.0) 1.04 (1.02–1.06) 1.02 (1.00–1.04) 30.0–60.0 21,853 (19.9) 22,157 (20.2) 0.94 (0.91–0.96) 0.91 (0.89–0,94) 30.0–34.9 14,876 (13.6) 14,847 (13.5) 0.95 (0.93–0.96) 0.93 (0.90–0.96)
35.0–39.9 4794 (4.4) 4917 (4.5) 0.93 (0.89–0.97) 0.90 (0.86–0.94)
40.0–60.0 2183 (2.0) 2393 (2.2) 0.87 (0.82–0.92) 0.83 (0.79–0.89)
Unknown 14,176 (12.9) 19,110 (17.4) 0.64 (0.62–0.66) 0.78 (0.75–0.80)
Smoking status
Non-smoker 53,513 (48.7) 50,517 (46.0) 1.00 (reference) 1.00 (reference)
Ex-smoker 32,952 (30.0) 29,321 (26.7) 1.08 (1.06–1.10) 1.08 (1.06–1.10)
Current smoker 18,334 (16.7) 21,904 (20.0) 0.78 (0.76–0.79) 0.78 (0.76–0.80)
Unknown 4984 (4.5) 8041 (7.3) 0.51 (0.49–0.53) 0.68 (0.65–0.71)
Alcohol consumption
Non-drinker 17,399 (15.9) 16,062 (14.6) 1.00 (reference) 1.00 (reference)
Ex-drinker 2308 (2.1) 2005 (1.8) 1.07 (1.00–1.14) 1.09 (1.03–1.17)
Current drinker (units/week)
1–9 29,403 (26.8) 27,743 (25.3) 0.97 (0.95–1.00) 0.96 (0.93–0.98)
10–19 12,159 (11.1) 11,971 (10.9) 0.93 (0.89–0.96) 0.91 (0.88–0.94)
≥20 9132 (8.3) 9462 (8.6) 0.87 (0.84–0.90) 0.88 (0.84–0.91)
unknown 28,443 (25.9) 27,281 (24.9) 0.95 (0.93–0.98) 0.95 (0.92–0.98)
Unknown 10,939 (10.0) 15,259 (13.9) 0.59 (0.57–0.62) 0.74 (0.71–0.77)
Notes:a
Adjusted for BMI category, smoking status, alcohol consumption.
Abbreviations:BMI, body mass index; CI, confidence interval; NA, not applicable; OR, odds ratio.
Clinical Epidemiology downloaded from https://www.dovepress.com/ by 118.70.13.36 on 20-Aug-2020
when the comorbidities were closer in time to the index
date (Table 3, stratified by sex in Table S3). The
associa-tion was strongest with sensorineural hearing loss (adj. OR
161.70, 95% CI: 60.56–431.73) followed by acute
vestib-ular neuritis (adj. OR 34.14, 95% CI: 4. 79–243.60), otitis
media (adj. OR 22.82, 95% CI: 17.23–30.22), labyrinthitis
(adj. OR 20.19, 95% CI: 12.88–31.65), conductive hearing
loss (adj. OR 19.51, 95% CI: 6.07–62.74), benign
posi-tional vertigo (adj. OR 12.94, 95% CI: 9.24–18.11),
cerumen (adj. OR 11.56, 95% CI: 10.41–13.83), and otitis
externa (adj. OR 9.87, 95% CI: 8.52–11.43).
Head and neck disorders
Similarly, tinnitus patients were more likely to have a prior diagnosis of head and neck disorders compared with con-trols. Risk estimates were particularly increased if these diagnoses were recorded within one month before the ID. We found elevated ORs for tinnitus in patients with
Figure 1Age- and sex-specific crude incidence rates (IRs) of tinnitusfirst-time diagnoses in the United Kingdom from 2000 to 2016.
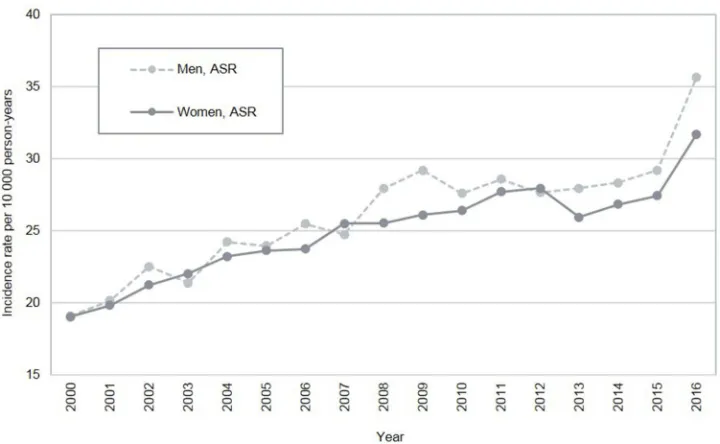
Figure 2Sex-specific and age-standardised incidence rates (ASRs) of tinnitusfirst-time diagnoses in the United Kingdom from 2000 to 2016. Note:Standard population from Eurostat.27
Clinical Epidemiology downloaded from https://www.dovepress.com/ by 118.70.13.36 on 20-Aug-2020
tension-type headache (adj. OR 11.71, 95% CI: 5.92–
23.19), concussion (adj. OR 8.45, 95% CI: 2.54–28.05),
temporomandibular joint disorders (adj. OR 6.63, 95% CI:
3.98–11.06), whiplash (adj. OR 5.39, 95% CI: 3.11–9.34),
cervicalgia (adj. OR 5.04, 95% CI: 4.33–5.86), migraine
(adj. OR 4.38, 95% CI: 3.43–5.60), or cranial nerve
dis-orders (adj. OR 4.33, 95% CI: 2.69–6.98; Table 4,
strati-fied by sex inTable S4).
Discussion
In this large case-control analysis, we assessed incidence rates of GP-recorded tinnitus in the UK over time, and we characterized life style parameters as well a large range of comorbidities in tinnitus patients. The direct comparison of tinnitus cases with a randomly selected, matched sample of tinnitus-free patients allowed us to characterize which
factors were more and which less frequently observed in tinnitus patients compared to controls, without any claim that such observed association are necessarily causal.
Incidence rates
Between 2000 and 2016, we calculated an overall crude IR of GP-reported tinnitus of 24.3 cases per 10,000 PY. IRs for men and women were comparable, which is consistent with results of previously published studies although there
is no general consensus in thefield.4,11,28–30
We observed that IRs increased with age, were highest
between age 60–69 years, and decreased subsequently
there-after. This pattern has been reported by others.4,11,28 It is
hypothesized that, with increasing age, the importance of
tinnitus in a patient’s overall health burden declines, and
the ability to cope with symptoms grows.28,31Another theory
Table 2 Distribution of comorbidities in patients with tinnitus and their matched controls: internal diseases and neurological/ psychological disorders
Tinnitus cases (%)
Tinnitus-free controls (%)
OR crude (95% CI)
OR adjusteda(95%
CI)
Neurological/psychological disorders
Insomnia 14,944 (13.6) 11,043 (10.1) 1.46 (1.42–1.50) 1.45 (1.41–1.49)
Anxiety 22,872 (20.8) 17,839 (16.3) 1.39 (1.36–1.42) 1.39 (1.35–1.42)
Depression 22,421 (20.4) 18,363 (16.7) 1.30 (1.27–1.33) 1.31 (1.28–1.34)
Seizure/Epilepsy 2393 (2.2) 2366 (2.2) 1.01 (0.96–1.07) 1.01 (0.96–1.08)
Multiple Sclerosis 324 (0.3) 369 (0.3) 0.88 (0.76–1.02) 0.89 (0.76–1.03)
Schizophrenia 623 (0.6) 831 (0.8) 0.75 (0.67–0.83) 0.76 (0.69–0.85)
Parkinson Disease 256 (0.2) 411 (0.4) 0.62 (0.53–0.73) 0.63 (0.54–0.74)
Dementia 282 (0.3) 660 (0.6) 0.42 (0.36–0.48) 0.42 (0.37–0.49)
Cardiovascular disorders
Arrhythmia 6374 (5.8) 5304 (4.8) 1.23 (1.18–1.28) 1.19 (1.14–1.24)
Hypertension 25,988 (23.7) 25,609 (23.3) 1.02 (1.00–1.05) 0.98 (0.96–1.00) Myocardial infarction 2935 (2.7) 2974 (2.7) 0.99 (0.94–1.04) 0.95 (0.90–1.00) Congestive heart failure 1505 (1.4) 1593 (1.5) 0.94 (0.88–1.01) 0.92 (0.85–0.99)
Stroke/TIA 3385 (3.1) 3735 (3.4) 0.90 (0.86–0.94) 0.88 (0.84–0.93)
Metabolic disorders
Hyperlipidemia 12,081 (11.0) 10,595 (9.7) 1.18 (1.15–1.22) 1.14 (1.11–1.18)
Hypothyroidism 6225 (5.7) 5500 (5.0) 1.15 (1.10–1.19) 1.13 (1.08–1.17)
Hyperthyroidism 1523 (1.4) 1363 (1.2) 1.12 (1.04–1.21) 1.11 (1.03–1.20)
Diabetes mellitus 6915 (6.3) 7626 (7.0) 0.90 (0.87–0.93) 0.85 (0.83–0.89)
Other disorders
Irritable bowel syndrome 11,008 (10.0) 7288 (6.6) 1.59 (1.54–1.65) 1.56 (1.51–1.61)
Fibromyalgia 1588 (1.5) 1053 (1.0) 1.54 (1.42–1.67) 1.53 (1.41–1.66)
Asthma 16,630 (15.2) 14,842 (13.5) 1.15 (1.12–1.18) 1.11 (1.08–1.14)
Rheumatoid Arthritis 1479 (1.4) 1336 (1.2) 1.11 (1.03–1.20) 1.10 (1.02–1.19)
COPD 2848 (2.6) 3062 (2.8) 0.93 (0.88–0.98) 0.95 (0.90–1.00)
Notes:Comorbidities listed according to their odds ratios in decreasing order.aAdjusted for BMI category, smoking status, alcohol consumption. Abbreviations:CI, confidence interval; COPD, Chronic obstructive pulmonary disease; OR, odds ratio; TIA, transient ischemic attack.
Clinical Epidemiology downloaded from https://www.dovepress.com/ by 118.70.13.36 on 20-Aug-2020
is that tinnitus may be associated with cardiovascular disease, and that patients with cardiovascular diseases are more likely to die, whereby those who survive are less likely to develop
tinnitus.28 However, we did notfind a marked increase in
tinnitus risk associated with previous cardiovascular dis-eases, and exploring cardiovascular mortality was not the goal of this study.
We observed a substantial rise in the annual IRs during the study period from 18.3 per 10,000 PY in 2000 to 34.2 per 10,000 PY in 2016. Over the past two decades, other
studies also reported increases in rates of hearing disorders including tinnitus in adolescents and young adults, possi-bly due to higher exposure to loud music in bars, concerts,
discotheques and from personal electronic devices.32–34
However, our analysis yielded no difference between young adults below 30 years of age and older adults with respect to the pattern of IRs over time. Other explanations for the rise in tinnitus incidence include more demanding health expectations, and a higher awareness of symptoms
over time.11,35
Table 3Distribution of comorbidities in patients with tinnitus and their matched controls: otological and vestibular disorders
Tinnitus cases (%)
Tinnitus-free controls (%)
OR crude (95% CI)
OR adjusteda
(95% CI)
Sensorineural Hearing Loss
≤30 days prior to (includigng) the ID 618 (0.6) < 5b(0.0) 156.99 (58.81–419.08) 161.70 (60.56–431.73) 31 to 360 days prior to the ID 179 (0.2) 60 (0.1) 3.18 (2.36–4.28) 3.10 (2.29–4.18) >360 days prior to the ID 1142 (1.0) 701 (0.6) 1.68 (1.53–1.85) 1.68 (1.53–1.85)
Acute vestibular neuronitis
≤30 days prior to (includigng) the ID 37 (0.0) < 5b(0.0) 36.15 (5.07–257.83) 34.14 (4.79–243.60) 31 to 360 days prior to the ID 68 (0.1) 27 (0.0) 2.58 (1.64–4.05) 2.37 (1.50–3.73) >360 days prior to the ID 390 (0.4) 236 (0.2) 1.66 (1.41–1.95) 1.63 (1.39–1.92)
Otitis media
≤30 days prior to (includigng) the ID 1114 (1.0) 51 (0.1) 22.91 (17.30–30.32) 22.82 (17.23–30.22) 31 to 360 days prior to the ID 1753 (1.6) 489 (0.5) 3.82 (3.45–4.23) 3.81 (3.44–4.22) >360 days prior to the ID 11,552 (10.5) 9483 (8.6) 1.33 (1.29–1.37) 1.31 (1.27–1.36)
Labyrinthitis
≤30 days prior to (includigng) the ID 408 (0.4) 20 (0.0) 20.90 (13.34–32.73) 20.19 (12.88–31.65) 31 to 360 days prior to the ID 867 (0.8) 277 (0.3) 3.26 (2.85–3.74) 3.19 (2.78–3.66) >360 days prior to the ID 4338 (4.0) 3014 (2.8) 1.49 (1.42–1.57) 1.46 (1.40–1.54)
Conductive Hearing Loss
≤30 days prior to (includigng) the ID 52 (0.1) < 5b(0.0) 17.32 (5.41–55.42) 19.51 (6.07–62.74) 31 to 360 days prior to the ID 29 (0.0) < 5b(0.0) 7.25 (2.55–20.62) 7.23 (2.53–20.67) >360 days prior to the ID 290 (0.3) 229 (0.2) 1.27 (1.07–1.51) 1.25 (1.05–1.48)
Benign positional vertigo
≤30 days prior to (includigng) the ID 462 (0.4) 37 (0.0) 13.11 (9.37–18.34) 12.94 (9.24–18.11) 31 to 360 days prior to the ID 960 (0.9) 398 (0.4) 2.56 (2.28–2.89) 2.48 (2.20–2.80) >360 days prior to the ID 3488 (3.2) 2294 (2.1) 1.60 (1.51–1.69) 1.56 (1.48–1.65)
Cerumen
≤30 days prior to (includigng) the ID 4249 (3.9) 407 (0.4) 11.74 (10.58–13.04) 11.56 (10.41–12.83) 31 to 360 days prior to the ID 6680 (6.1) 3512 (3.2) 2.17 (2.07–2.26) 2.12 (2.03–2.21) >360 days prior to the ID 14,702 (13.4) 14,513 (13.2) 1.13 (1.10–1.16) 1.11 (1.08–1.14)
Otitis externa
≤30 days prior to (includigng) the ID 1875 (1.7) 203 (0.2) 9.88 (8.54–11.44) 9.87 (8.52–11.43) 31 to 360 days prior to the ID 3575 (3.3) 1506 (1.4) 2.55 (2.40–2.71) 2.54 (2.39–2.70) >360 days prior to the ID 13,171 (12.0) 11,085 (10.1) 1.28 (1.24–1.31) 1.26 (1.23–1.30)
Notes:aAdjusted for BMI category, smoking status, alcohol consumption.bFor confidentiality reasons, we do not provide the number of patients in categories containing less thanfive patients.
Abbreviations:CI, confidence interval; ID, index date; NA, not available; OR, odds ratio.
Clinical Epidemiology downloaded from https://www.dovepress.com/ by 118.70.13.36 on 20-Aug-2020
The precise IRs reported in the literature vary due to
differences in study periods, regions, and case definitions.
We included all patients with GP-reported tinnitus, whereas
other authors exclusively focused on i) clinically significant
tinnitus defined by Martinez et al,11ii) self-reported tinnitus
symptoms lasting for at least five minutes4 or iii)
self-reported tinnitus symptoms in the last year of at least
mod-erate severity or leading to sleep disorders.28,36These
dif-ferences likely explain the higher IRs observed in our study.
Lifestyle factors
We found that obese patients were not at increased risk of developing tinnitus, as did three previous cross-sectional
studies37–39and a cohort study.36On the contrary, our data
suggest a slightly lower risk in obese as well as in under-weight patients, though the ORs were very close to the null. We observed an inverse association between current smoking and tinnitus. The same was found in a cross-sectional study using the UK Biobank resource for
persis-tent tinnitus, but not for transient tinnitus.39 An Italian
study published in 2015 reported a comparable trend, but due to the small study population the results did not meet
statistical significance.40 In contrast, other studies have
reported an increased risk of being diagnosed with tinnitus
among smokers.34,36,41,42 A variety of possible causes of
tinnitus as well as differences in the study designs and respective study populations may contribute to these
con-tradictory results.15
Table 4Distribution of comorbidities in patients with tinnitus and their matched controls: head and neck disorders
Tinnitus cases (%) Tinnitus-free
controls (%)
OR crude (95% CI) OR adjusteda(95% CI)
Tension-type headache
≤30 days prior to (includigng) the ID 104 (0.1) 9 (0.0) 11.72 (5.93–23.17) 11.71 (5.92–23.19) 31 to 360 days prior to the ID 359 (0.3) 145 (0.1) 2.53 (2.09–3.07) 2.52 (2.07–3.06) >360 days prior to the ID 3331 (3.0) 2176 (2.0) 1.58 (1.49–1.67) 1.54 (1.46–1.63)
Concussion
≤30 days prior to (includigng) the ID 25 (0.0) <5b(0.0) 8.31 (2.51–27.47) 8.45 (2.54–28.05) 31 to 360 days prior to the ID 39 (0.0) 19 (0.0) 2.05 (1.19–3.55) 2.10 (1.21–3.66) >360 days prior to the ID 539 (0.5) 497 (0.5) 1.09 (0.96–1.23) 1.09 (0.96–1.23)
Temporomandibular joint disorders
≤30 days prior to (includigng) the ID 115 (0.1) 17 (0.0) 6.84 (4.11–11.38) 6.63 (3.98–11.06) 31 to 360 days prior to the ID 308 (0.3) 144 (0.1) 2.17 (1.78–2.64) 2.09 (1.71–2.56) >360 days prior to the ID 2323 (2.1) 1501 (1.4) 1.58 (1.48–1.68) 1.54 (1.44–1.64)
Whiplash
≤30 days prior to (includigng) the ID 86 (0.1) 15 (0.0) 5.80 (3.35–10.04) 5.39 (3.11–9.34) 31 to 360 days prior to the ID 345 (0.3) 232 (0.2) 1.51 (1.27–1.78) 1.48 (1.25–1.75) >360 days prior to the ID 4517 (4.1) 3778 (3.4) 1.21 (1.16–1.27) 1.20 (1.15–1.25)
Cervicalgia
≤30 days prior to (includigng) the ID 985 (0.9) 210 (0.2) 5.17 (4.45–6.01) 5.04 (4.33–5.86) 31 to 360 days prior to the ID 3000 (2.7) 1740 (1.6) 1.89 (1.78–2.01) 1.82 (1.72–1.94) >360 days prior to the ID 18,075 (16.5) 13,399 (12.2) 1.50 (1.46–1.54) 1.47 (1.44–1.51)
Migraine
≤30 days prior to (includigng) the ID 346 (0.3) 80 (0.1) 4.54 (3.56–5.79) 4.38 (3.43–5.60) 31 to 360 days prior to the ID 1045 (1.0) 603 (0.6) 1.83 (1.65–2.02) 1.77 (1.59–1.95) >360 days prior to the ID 9519 (8.7) 7160 (6.5) 1.39 (1.35–1.44) 1.37 (1.32–1.41)
Cranial nerve disorders
≤30 days prior to (includigng) the ID 90 (0.1) 21 (0.0) 4.32 (2.69–6.95) 4.33 (2.69–6.98) 31 to 360 days prior to the ID 342 (0.3) 177 (0.2) 1.95 (1.63–2.35) 1.90 (1.58–2.29) >360 days prior to the ID 2286 (2.1) 1772 (1.6) 1.30 (1.22–1.39) 1.30 (1.22–1.39)
Notes:a
Adjusted for BMI category, smoking status, alcohol consumption.b
For confidentiality reasons, we do not provide the number of patients in categories containing less thanfive patients.
Abbreviations:CI, confidence interval; ID, index date; NA, not available; OR, odds ratio.
Clinical Epidemiology downloaded from https://www.dovepress.com/ by 118.70.13.36 on 20-Aug-2020
Current alcohol consumption was also inversely related
to tinnitus, which is consistent with thefindings of several
other studies.29,36,40It has been hypothesized that alcohol
exerts a favorable effect on microvascular health in the
cochlea.29 Another explanation is that tinnitus is
under-reported in patients with unhealthy lifestyles who may be more likely to suffer from more pressing health-related problems and may not discuss tinnitus with their GP.
Comorbidities
Our analyses yielded a statistically significant association
between prevalent anxiety, depression, and insomnia, and the risk of developing tinnitus. It is well known that these disorders have a negative impact on quality of life and on
severity of tinnitus,7–9 and they are also often a
conse-quence of bothersome tinnitus.5,7,34,43 Some studies have
also found that anxiety and depression can precede
tinnitus,34,44,45 and parallels in pathophysiology have
been noted.8,9,46 In this study, however, we were careful
to establish that the depression-related disorders occurred before the tinnitus diagnosis. It has previously been sug-gested that tinnitus is associated with greater mental health
burden in women than in men.47 A prior cross-sectional
study further reported a statistically significantly increased
risk of suicide attempts in women with severe tinnitus, but
not in men.48The absence of any meaningful effect
mod-ification by sex for the association of the risk of tinnitus
and mental health and other comorbidities may thus reflect
that women with mental health diseases are not per se at an increased risk of developing tinnitus compared to men; however, they may suffer more distress from co-existing tinnitus and mental health diseases. Further research is needed to evaluate this potential association.
Our finding of decreased ORs, especially in patients
with a diagnosis of dementia, Parkinson’s disease or
schi-zophrenia, could be explained by underreporting due to
more serious health-related problems or due to difficulties
in communication.
Impairment of the auditory system seems to be an
important underlying mechanism of tinnitus.14,29 It is
assumed that hearing impairment may induce tinnitus by initiating changes on a cellular and structural level in the brain This involves changes within the central auditory
system as well as within non-auditory systems.14 Our
results showed that hearing loss, in particular sensorineural hearing loss, and ear infections were highly associated with tinnitus. Previous studies also found this association, and they have also shown that concomitantly occurring
hearing loss may be considered a predictor for tinnitus
severity.28,49
Another proposed mechanism of somatosensory sys-tem-related tinnitus involves pathological processes of
musculoskeletal structures of the head and neck,4,28,50–54
such as functional disorders of the cervical spine or neck
and the temporomandibular joint.37,55–58 Changes in the
neuronal activity of the dorsal cochlear nucleus or between somatosensory and auditory systems seem to play an
important role in this subtype of tinnitus.59A
meta-analy-sis of eight cross-sectional studies in patients with
tempor-omandibular joint disorders identified tinnitus as a
common symptom in over 50% of patients.58 The results
of our study were similar, with a large proportion of tinnitus occurring in patients suffering from tension head-aches, migraine, cervicalgia, whiplash, concussion, or cra-nial nerve disorders.
The highest rate of tinnitus among patients with otolo-gical and vestibular disorders as well as head and neck disorders, occurred shortly after the recording of the respective disorder which supports the possibility of a causal association.
Study limitations
When interpreting the results of this study, we took several limitations into account. First, tinnitus is usually a subjective phenomenon, and the diagnosis is based on self-reporting.
Case validation is difficult without uniformly followed
stan-dardized procedures60and the availability of questionnaires or
referral letters. To our knowledge, the tinnitus diagnosis has not been validated in the CPRD, as this is virtually impossible, since tinnitus is a self-diagnosed condition that cannot be
confirmed as yet with objective diagnostic procedures; thus,
there is likely to be some case misclassification in this study.
However, the large sample size of the present clinical data may
compensate for such misclassifications. Second, tinnitus
sever-ity is mostly mild, and only 10 to 52% of individuals who
experience tinnitus discuss this symptom with their GP.4,5,50
Therefore, GP-reported tinnitus does not capture all cases, and the true rates are likely to be higher than those presented in our
study. Nevertheless, the numbers reflect those cases that
pre-sent to the GPs in real life in the UK. Third, GPs do not systematically record tinnitus characteristics such as severity,
duration, or impact on patients’quality of life. Therefore, it
was not possible to carry out detailed analyses to account for these factors or to distinguish between clinically important or less important tinnitus, or between acute or persistent tinnitus.
To date, there is no generally accepted definition to
Clinical Epidemiology downloaded from https://www.dovepress.com/ by 118.70.13.36 on 20-Aug-2020
consistently10grade tinnitus severity, and the approaches used
in the different studies vary.4,28,30,36–38,50Finally, afirst-time
tinnitus diagnosis does likely not coincide with the actual disease onset in a proportion of cases since patients may not seek medical attention immediately.
Conclusion
We investigated the epidemiology of GP-recorded tinnitus in a large sample of the UK population. IRs increased consider-ably over time in men and women, emphasizing a growing health burden. Recent diagnosis of several otological and vestibular as well as head and neck disorders was strongly associated with the risk of developing tinnitus. However, we cannot derive causality from these analyses, as we did not intend to run an etiologic study, but rather to descriptively characterize tinnitus patients with regard to life style para-meters and comorbidities. These observations may support doctors when diagnosing tinnitus and when putting life style and comorbidity patterns of individual patients into perspec-tive of a large population-based assessment.
Acknowledgment
We thank Pascal Egger for technical support and program-ming. Velux Foundation, Switzerland. The sponsor was not involved in any stage from study design to submission of the manuscript for publication.
Data sharing statement
Data for this study were derived from CPRD primary care data obtained under license from the UK Medicines and Healthcare products Regulatory Agency. The data is pro-vided by patients and collected by the NHS as part of their care and support. The interpretation and conclusions con-tained in the study are those of the authors alone.
Disclosure
The authors report no conflicts of interest in this work.
References
1. NICE CKS (2017). Tinnitus. Available from:https://cks.nice.org.uk/
tinnitus. Accessed May 11, 2018.
2. Tunkel DE, Bauer CA, Sun GH, et al. Clinical practice guideline: tinnitus. Otolaryngol Head Neck Surg. 2014;151(2 Suppl):S1–S40. doi:10.1177/0194599814545325
3. Baguley D, McFerran D, Hall D. Tinnitus. Lancet. 2013;382 (9904):1600–1607. doi:10.1016/S0140-6736(13)60142-7
4. Gopinath B, Mcmahon CM, Rochtchina E, Karpa MJ, Mitchell P. Incidence, persistence, and progression of tinnitus symptoms in older adults: the blue mountains hearing study.Ear Hear.2010;31:407–412. doi:10.1097/AUD.0b013e3181cdb2a2
5. Bhatt JM, Lin HW, Bhattacharyya N. Prevalence, severity, exposures, and treatment patterns of tinnitus in the United States.JAMA Otolaryngol Neck Surg.2016;142(10):959. doi:10.1001/jamaoto.2016.1700 6. Nondahl DM, Cruickshanks KJ, Dalton DS, et al. The impact of
tinnitus on quality of life in older adults. J Am Acad Audiol.
2007;18:257–266.
7. Folmer RL, Griest SE. Tinnitus and insomnia.Am J Otolaryngol.
2000;21:287–293. doi:10.1053/ajot.2000.9871
8. Langguth B, Landgrebe M. Tinnitus and depression.Textb Tinnitus.
2011;2975(May):493–498.
9. Pattyn T, Van den Eede F, Vanneste S, et al. Tinnitus and anxiety disorders: a review. Hear Res. 2016;333:255–265. doi:10.1016/j. heares.2015.08.014
10. Edmondson-jones M, Mccormack A, Somerset S, Hall D. A systema-tic review of the reporting of tinnitus prevalence and severity.Hear Res.2016;337:70–79. doi:10.1016/j.heares.2016.05.009
11. Martinez C, Wallenhorst C, McFerran D, Hall DA. Incidence rates of clinically significant tinnitus: 10-year trend from a cohort study in England. Ear Hear. 2015;36(3):e69–75. doi:10.1097/AUD.000000 0000000121
12. Stockdale D, McFerran D, Brazier P, et al. An economic evaluation of the healthcare cost of tinnitus management in the UK.BMC Health Serv Res.2017;17(1):577. doi:10.1186/s12913-017-2527-2 13. Maes C, Vlaeyen AJ. Tinnitus: a cost study. Ear Hear. 2013;34
(4):508–514. doi:10.1097/AUD.0b013e31827d113a
14. Henry JA, Roberts LE, Caspary DM, Theodoroff SM, Salvi RJ. Underlying mechanisms of tinnitus: review and clinical implications.
J Am Acad Audiol.2014;25(1):5–22. doi:10.3766/jaaa.25.1.2 15. Cima RFF, Mazurek B, Haider H, et al. A multidisciplinary European
guideline for tinnitus: diagnostics, assessment, and treatment.HNO.
2019;67(March):10–42. doi:10.1007/s00106-019-0633-7
16. Langguth B, Elgoyhen AB, Cederroth CR. Therapeutic approaches to the treatment of tinnitus. Annu Rev Pharmacol Toxicol. 2018;59 (1):291–313. doi:10.1146/annurev-pharmtox-010818-021556 17. Zenner H-P, Delb W, Kroener-Herwig B, et al. A multidisciplinary
systematic review of the treatment for chronic idiopathic tinnitus.Eur Arch Oto-Rhino-Laryngol. 2017;274:2079–2091. doi:10.1007/s004 05-016-4401-y
18. Cederroth CR, Dyhrfjeld-Johnsen J, Langguth B. An update: emer-ging drugs for tinnitus.Expert Opin Emerg Drugs.2018;23(4):251– 260. doi:10.1080/14728214.2018.1555240
19. Hall DA, Haider H, Szczepek AJ, et al. Systematic review of outcome domains and instruments used in clinical trials of tinnitus treatments in adults.Trials.2016;17(1):1–19. doi:10.1186/s13063-015-1128-9 20. Hall DA, Hibbert A, Smith H, et al. One size does not fit all:
developing common standards for outcomes in early-phase clinical trials of sound-, psychology-, and pharmacology-based interventions for chronic subjective tinnitus in adults.Trends Hear.2019;23:1-16. doi:10.1177/2331216518824827
21. Cederroth CR, Gallus S, Hall DA, et al. Editorial: towards an under-standing of tinnitus hetero.geneity.Front Aging Neurosci.2019;11 (March):1–7. doi:10.3389/fnagi.2019.00001
22. Herrett E, Gallagher AM, Bhaskaran K, et al. Data resource profile: Clinical Practice Research Datalink (CPRD). Int J Epidemiol.
2015;44(3):827–836. doi:10.1093/ije/dyv098
23. Herrett E, Thomas SL, Schoonen WM, Smeeth L, Hall AJ. Validation and validity of diagnoses in the General Practice Research Database: a systematic review. Br J Clin Pharmacol. 2010;69(1):4–14. doi:10.1111/j.1365-2125.2009.03537.x
24. Williams T, van Staa T, Puri S, Eaton S. Recent advances in the utility and use of the General Practice Research Database as an example of a UK Primary Care Data resource.Ther Adv Drug Saf.
2012;3(2):89–99. doi:10.1177/2042098611435911
25. Khan NF, Harrison SE, Rose PW. Validity of diagnostic coding within the General Practice Research Database: a systematic review.
Br J Gen Pract.2010;60(572):199–206. doi:10.3399/bjgp10X483562
Clinical Epidemiology downloaded from https://www.dovepress.com/ by 118.70.13.36 on 20-Aug-2020
26. Jick S, Kaye J, Vasilakis-Scaramozza C, et al. Validity of the General Practice Research Database.Pharmacotherapy.2003;23(5):686–689. 27. Eurostat. Revision of the European Standard Population: Report of Eurostat’s Task Force. Luxembourg: Publications Office of the European Union.2013.
28. Nondahl DM, Cruickshanks KJ, Wiley TL, Klein R, Klein BEK, Tweed TS. Prevalence and 5-year incidence of tinnitus among older adults: the epidemiology of hearing loss study.J Am Acad Audiol.
2002;13(6):323–331.
29. Nondahl DM, Cruickshanks KJ, Huang GH, et al. Tinnitus and its risk factors in the Beaver Dam Offspring Study.Int J Audiol.2011;50 (5):313–320. doi:10.3109/14992027.2010.551220
30. McCormack A, Edmondson-Jones M, Fortnum H, et al. The preva-lence of tinnitus and the relationship with neuroticism in a middle-aged UK population. J Psychosom Res. 2014;76(1):56–60. doi:10.1016/j.jpsychores.2013.08.018
31. Davis AC. The prevalence of hearing impairment and reported hear-ing disability among adults in Great Britain.Int J Epidemiol.1989;18 (4):911–917. doi:10.1093/ije/18.4.911
32. Gilles A, Van Hal G, De Ridder D, Wouters K, Van de Heyning P. Epidemiology of noise-induced tinnitus and the attitudes and beliefs towards noise and hearing protection in adolescents. PLoS One.
2013;8(7):e0070297. doi:10.1371/journal.pone.0070297
33. Henderson E, Testa MA, Hartnick C. Prevalence of noise-induced hearing-threshold shifts and hearing loss among US youths.
Pediatrics.2011;127(1):e39–e46. doi:10.1542/peds.2010-0926 34. Shargorodsky J, Curhan GC, Farwell WR. Prevalence and
character-istics of tinnitus among US adults.Am J Med.2010;123(8):711–718. doi:10.1016/j.amjmed.2010.02.015
35. Nondahl DM, Cruickshanks KJ, Huang G-H, et al. Generational differences in the reporting of tinnitus.Ear Hear.2012;33(5):640– 644. doi:10.1097/AUD.0b013e31825069e8
36. Nondahl DM, Cruickshanks KJ, Wiley TL, et al. The ten-year inci-dence of tinnitus among older adults.Int J Audiol.2010;49(8):580– 585. doi:10.3109/14992021003753508
37. Park RJ, Moon JD. Prevalence and risk factors of tinnitus: the Korean National Health and Nutrition Examination Survey 2010–2011, a cross-sectional study.Clin Otolaryngol. 2014;39(2):89–94. doi:10. 1111/coa.12232
38. Kim H-J, Lee H-J, An S-Y, et al. Analysis of the prevalence and associated risk factors of tinnitus in adults.PLoS One.2015;10(5): e0127578. doi:10.1371/journal.pone.0127578
39. McCormack A, Edmondson-Jones M, Mellor D, et al. Association of dietary factors with presence and severity of tinnitus in a middle-aged UK population.PLoS One.2014;9(12):e0114711. doi:10.1371/jour-nal.pone.0114711
40. Gallus S, Lugo A, Garavello W, et al. Prevalence and determinants of tinnitus in the Italian adult population.Neuroepidemiology.2015;45 (1):12–19. doi:10.1159/000431376
41. Bhatt IS. Prevalence of and risk factors for tinnitus and tinnitus-related handicap in a college-aged population.Ear Hear.2018;39 (3):517–526. doi:10.1097/AUD.0000000000000503
42. Mahboubi H, Oliaei S, Kiumehr S, Dwabe S, Djalilian HR. The preva-lence and characteristics of tinnitus in the youth population of the United States.Laryngoscope.2013;123(8):2001–2008. doi:10.1002/lary.24015 43. Loprinzi PD, Maskalick S, Brown K, Gilham B. Association between
depression and tinnitus in a nationally representative sample of US older adults.Aging Ment Health.2013;17(6):714–717. doi:10.1080/ 13607863.2013.775640
44. Salviati M, Bersani FS, Terlizzi S, et al. Tinnitus: Clinical experience of the psychosomatic connection. Neuropsychiatr Dis Treat.
2014;10:267–275. doi:10.2147/NDT.S49425
45. Robinson SK, Viirre ES, Stein MB. Antidepressant therapy in tinnitus. Hear Res. 2007;226(1–2):221–231. doi:10.1016/j. heares.2006.08.004
46. Wallhäusser-Franke E, Schredl M, Delb W. Tinnitus and insomnia: is hyperarousal the common denominator? Sleep Med Rev. 2013;17 (1):65–74. doi:10.1016/j.smrv.2012.04.003
47. Schlee W, Hall DA, Edvall NK, Langguth B, Canlon B, Cederroth CR. Visualization of global disease burden for the optimization of patient management and treatment.Front Med.2017;4:(June):1–12. doi:10.3389/fmed.2017.00086
48. Lugo A, Trpchevska N, Liu X, et al. Sex-specific association of tinnitus with suicide attempts.JAMA Otolaryngol Head Neck Surg.
2019;451:17–19.
49. Sindhusake D, Golding M, Wigney D, Newall P, Jakobsen K, Mitchell P. Factors predicting severity of tinnitus: a population-based assessment.J Am Acad Audiol.2004;15:269–280.
50. Sindhusake D, Mitchell P, Newall P, Golding M, Rochtchina E, Rubin G. Prevalence and characteristics of tinnitus in older adults: the Blue Mountains Hearing Study.Int J Audiol. 2003;42(5):289– 294.
51. Sindhusake D, Golding M, Newall P, Rubin G, Jakobsen K, Mitchell P. Risk factors for tinnitus in a population of older adults: the Blue Mountains Hearing Study. Ear Hear. 2003;24(6):501–507. doi:10.1097/01.AUD.0000100204.08771.3D
52. Folmer RL, Griest SE. Chronic tinnitus resulting from head or neck injuries. Laryngoscope. 2003;113(5):821–827. doi:10.1097/000 05537-200305000-00010
53. Tranter RMD, Graham JR. A review of the otological aspects of whiplash injury. J Forensic Leg Med. 2009;16(2):53–55. doi:10.1016/j.jflm.2008.09.001
54. Zeigelboim BS, Fonseca VR, Mesti JC, Gorski LP, Faryniuk JH, Marques JM. Neurotological findings at a health unit for adults with cervicalgia. Int Arch Otorhinolaryngol. 2016;20(2):109–113. doi:10.1055/s-0036-1572563
55. Bernhardt O, Mundt T, Welk A, et al. Signs and symptoms of temporomandibular disorders and the incidence of tinnitus.J Oral Rehabil. 2011;38(12):891–901. doi:10.1111/j.1365-2842.2011.022 24.x
56. Michiels S, De Hertogh W, Truijen S, Van De Heyning P. Cervical spine dysfunctions in patients with chronic subjective tinnitus.Otol Neurotol.
2015;36(4):741–745. doi:10.1097/MAO.0000000000000670
57. Lee C-F, Lin M-C, Lin H-T, Lin C-L, Wang T-C, Kao C-H. Increased risk of tinnitus in patients with temporomandibular disorder: a retrospective population-based cohort study. Eur Arch Oto Rhino Laryngol. 2016;273(1):203–208. doi:10.1007/ s00405-015-3491-2
58. Porto De Toledo I, Stefani FM, Porporatti AL, et al. Prevalence of otologic signs and symptoms in adult patients with temporomandib-ular disorders: a systematic review and meta-analysis. Clin Oral Investig.2017;21(2):597–605. doi:10.1007/s00784-016-1926-9 59. Haider HF, Hoare DJ, Costa RFP, et al. Pathophysiology, diagnosis
and treatment of somatosensory tinnitus: a scoping review. Front Neurosci.2017;11(Apr). doi:10.3389/fnins.2017.00207
60. El-Shunnar SK, Hoare DJ, Smith S, et al. Primary care for tinnitus: practice and opinion among GPs in England. J Eval Clin Pract.
2011;17(4):684–692. doi:10.1111/j.1365-2753.2011.01696.x
Clinical Epidemiology downloaded from https://www.dovepress.com/ by 118.70.13.36 on 20-Aug-2020
Supplementary materials
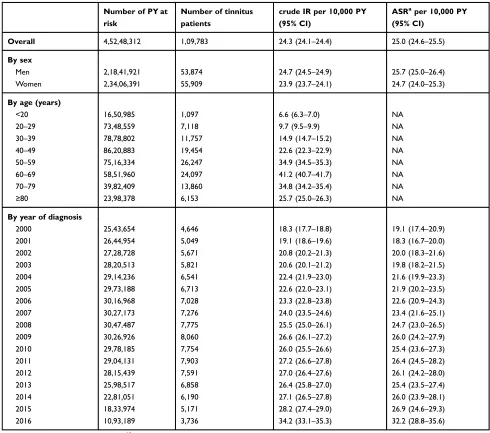
Table S1Incidence rates of tinnitus diagnosed in the UK between 2000 and 2016
Number of PY at risk
Number of tinnitus patients
crude IR per 10,000 PY (95% CI)
ASRaper 10,000 PY
(95% CI)
Overall 4,52,48,312 1,09,783 24.3 (24.1–24.4) 25.0 (24.6–25.5)
By sex
Men 2,18,41,921 53,874 24.7 (24.5–24.9) 25.7 (25.0–26.4)
Women 2,34,06,391 55,909 23.9 (23.7–24.1) 24.7 (24.0–25.3)
By age (years)
<20 16,50,985 1,097 6.6 (6.3–7.0) NA
20–29 73,48,559 7,118 9.7 (9.5–9.9) NA
30–39 78,78,802 11,757 14.9 (14.7–15.2) NA
40–49 86,20,883 19,454 22.6 (22.3–22.9) NA
50–59 75,16,334 26,247 34.9 (34.5–35.3) NA
60–69 58,51,960 24,097 41.2 (40.7–41.7) NA
70–79 39,82,409 13,860 34.8 (34.2–35.4) NA
≥80 23,98,378 6,153 25.7 (25.0–26.3) NA
By year of diagnosis
2000 25,43,654 4,646 18.3 (17.7–18.8) 19.1 (17.4–20.9)
2001 26,44,954 5,049 19.1 (18.6–19.6) 18.3 (16.7–20.0)
2002 27,28,728 5,671 20.8 (20.2–21.3) 20.0 (18.3–21.6)
2003 28,20,513 5,821 20.6 (20.1–21.2) 19.8 (18.2–21.5)
2004 29,14,236 6,541 22.4 (21.9–23.0) 21.6 (19.9–23.3)
2005 29,73,188 6,713 22.6 (22.0–23.1) 21.9 (20.2–23.5)
2006 30,16,968 7,028 23.3 (22.8–23.8) 22.6 (20.9–24.3)
2007 30,27,173 7,276 24.0 (23.5–24.6) 23.4 (21.6–25.1)
2008 30,47,487 7,775 25.5 (25.0–26.1) 24.7 (23.0–26.5)
2009 30,26,926 8,060 26.6 (26.1–27.2) 26.0 (24.2–27.9)
2010 29,78,185 7,754 26.0 (25.5–26.6) 25.4 (23.6–27.3)
2011 29,04,131 7,903 27.2 (26.6–27.8) 26.4 (24.5–28.2)
2012 28,15,439 7,591 27.0 (26.4–27.6) 26.1 (24.2–28.0)
2013 25,98,517 6,858 26.4 (25.8–27.0) 25.4 (23.5–27.4)
2014 22,81,051 6,190 27.1 (26.5–27.8) 26.0 (23.9–28.1)
2015 18,33,974 5,171 28.2 (27.4–29.0) 26.9 (24.6–29.3)
2016 10,93,189 3,736 34.2 (33.1–35.3) 32.2 (28.8–35.6)
Note:a
Standard population from Eurostat.27
Abbreviations:ASR, age-standardised incidence rates; CI, confidence interval; IR, incidence rate; PY, person-years.
Clinical Epidemiology downloaded from https://www.dovepress.com/ by 118.70.13.36 on 20-Aug-2020
T able S2 Distribution of patient characteristics and lifestyle factors in patients with tinnitus and their matched contr ols, strati fi ed by sex Men (n=53,874) W omen (n=55,909) Tinnitus cases (%) Tinnitus-fr ee contr ols (%) OR crude (95% CI) OR adjusted a (95% CI) Tinnitus cases (%) Tinnitus-fr ee contr ols (%) OR crude (95% CI) OR adjusted a (95% CI) Neur olo gical/ psycholo gical disor ders Insomnia 5942 (11.0) 4175 (7.8) 1.51 (1.45 – 1.58) 1.49 (1.43 – 1.56) 9002 (16.1) 6868 (12.3) 1.42 (1.37 – 1.48) 1.42 (1.37 – 1.47) Anxiety 8806 (16.4) 6880 (12.8) 1.35 (1.31 – 1.40) 1.35 (1.30 – 1.40) 14,066 (25.2) 10,959 (19.6) 1.41 (1.37 – 1.45) 1.41 (1.37 – 1.46) Depre ssion 8143 (15.1) 6390 (11.9) 1.34 (1.29 – 1.39) 1.33 (1.28 – 1.38) 14,278 (25.5) 11,973 (21.4) 1.28 (1.24 – 1.32) 1.30 (1.26 – 1.34) Seizur e/Epilepsy 1231 (2.3) 1267 (2.4) 0.97 (0.90 – 1.05) 0.98 (0.90 – 1.06) 1162 (2.1) 1099 (2.0) 1.06 (0.97 – 1.15) 1.06 (0.97 – 1.15) Multiple Scler osis 98 (0.2) 126 (0.2) 0.78 (0.60 – 1.01) 0.79 (0.60 – 1.03) 226 (0.4) 243 (0.4) 0.93 (0.78 – 1.12) 0.94 (0.78 – 1.12) Schizophrenia 333 (0.6) 402 (0.8) 0.83 (0.71 – 0.96) 0.84 (0.72 – 0.98) 290 (0.5) 429 (0.8) 0.67 (0.58 – 0.78) 0.70 (0.60 – 0.81) Parkinson Disease 124 (0.2) 228 (0.4) 0.54 (0.44 – 0.68) 0.54 (0.44 – 0.68) 132 (0.2) 183 (0.3) 0.72 (0.58 – 0.90) 0.74 (0.59 – 0.92) Dementia 106 (0.2) 207 (0.4) 0.50 (0.40 – 0.64) 0.51 (0.41 – 0.65) 176 (0.3) 453 (0.8) 0.38 (0.32 – 0.45) 0.38 (0.32 – 0.46) Card io vascular disor ders Arrh ythmia 3111 (5.8) 2632 (4.9) 1.21 (1.14 – 1.28) 1.16 (1.09 – 1.22) 3263 (5.8) 2672 (4.8) 1.25 (1.18 – 1.32) 1.22 (1.16 – 1.29) Hyper tension 12,176 (22.6) 11,907 (22.1) 1.04 (1.00 – 1.07) 0.98 (0.94 – 1.01) 13,812 (24.7) 13,702 (24.5) 1.01 (0.98 – 1.05) 0.98 (0.95 – 1.01) Myocar dial infar ction 2120 (3.9) 2121 (3.9) 1.00 (0.94 – 1.07) 0.96 (0.90 – 1.02) 815 (1.5) 853 (1.5) 0.95 (0.86 – 1.05) 0.92 (0.84 – 1.02) Congestive heart failure 766 (1.4) 828 (1.5) 0.92 (0.83 – 1.02) 0.89 (0.80 – 0.98) 739 (1.3) 765 (1.4) 0.96 (0.87 – 1.07) 0.95 (0.86 – 1.06) Str ok e/TIA 1703 (3.2) 1906 (3.5) 0.89 (0.83 – 0.95) 0.86 (0.81 – 0.93) 1682 (3.0) 1829 (3.3) 0.91 (0.85 – 0.98) 0.90 (0.84 – 0.97) Metabolic disor ders Hyperlipidemia 6238 (11.6) 5445 (10.1) 1.19 (1.14 – 1.24) 1.13 (1.09 – 1.18) 5843 (10.5) 5150 (9.2) 1.18 (1.13 – 1.23) 1.16 (1.11 – 1.21) Hypoth yr oidism 1074 (2.0) 899 (1.7) 1.20 (1.10 – 1.31) 1.16 (1.06 – 1.27) 5151 (9.2) 4601 (8.2) 1.14 (1.09 – 1.18) 1.12 (1.07 – 1.17) Hyper th yr oidism 312 (0.6) 285 (0.5) 1.10 (0.93 – 1.29) 1.04 (0.89 – 1.23) 1211 (2.2) 1078 (1.9) 1.13 (1.04 – 1.22) 1.13 (1.04 – 1.23) Diabetes mellitus 3839 (7.1) 4280 (7.9) 0.88 (0.84 – 0.93) 0.83 (0.79 – 0.87) 3076 (5.5) 3346 (6.0) 0.91 (0.87 – 0.96) 0.88 (0.84 – 0.93) Other disord ers Irritable bowe l syndr ome 3405 (6.3) 2028 (3.8) 1.74 (1.64 – 1.84) 1.66 (1.57 – 1.76) 7603 (13.6) 5260 (9.4) 1.53 (1.48 – 1.59) 1.51 (1.46 – 1.57) Fibr om yalgia 388 (0.7) 262 (0.5) 1.50 (1.28 – 1.76) 1.50 (1.27 – 1.76) 1200 (2.2) 791 (1.4) 1.55 (1.41 – 1.70) 1.54 (1.40 – 1.68) Asthma 7577 (14.1) 6743 (12.5) 1.15 (1.11 – 1.19) 1.09 (1.05 – 1.13) 9053 (16.2) 8099 (14.5) 1.15 (1.11 – 1.18) 1.12 (1.09 – 1.16) Rheumatoid Arthritis 475 (0.9) 413 (0.8) 1.15 (1.01 – 1.32) 1.13 (0.99 – 1.29) 1004 (1.8) 923 (1.7) 1.09 (1.00 – 1.19) 1.09 (0.99 – 1.19) COPD 1535 (2.9) 1576 (2.9) 0.97 (0.90 – 1.05) 0.99 (0.91 – 1.06) 1313 (2.4) 1486 (2.7) 0.88 (0.81 – 0.95) 0.91 (0.84 – 0.98) Notes: aAdjusted for BMI categor y, smoking status, alcohol consumption. Comorbidities listed according to their odds ratios in decr easing or der Abbre viations: CI, con fi dence inter val; COPD , Chr onic obstructiv e pulmonary disease; OR, odds ratio; TIA, transient ischemic attack.
Clinical Epidemiology downloaded from https://www.dovepress.com/ by 118.70.13.36 on 20-Aug-2020
T able S3 Distribution of comorbidities in patients with tinnitus and their matched contr ols, strati fi ed by sex: otological and vestibular disorders Men (n=53,874) W omen (n=55,909) Tinnitus cases (%)
Tinnitus- free contr
ols (%) OR crude (95% CI) OR adjusted a (95% CI) Tinnitus cases (%) Tinnitus- fre e contr ols (%) OR crude (95% CI) OR adjusted a (95% CI) Sensorineural Hearing Loss ≤ 30 da ys prior to (includigng) the ID 330 (0.6) <5 b (0.0) 166.11 (41.47 – 665.34) 171.24 (42.74 – 686.06) 288 (0.5) <5 b (0.0) 148.37 (36.97 – 595.42) 153.01 (38.12 – 614.15) 31 to 360 da ys prior to the ID 85 (0.2) 31 (0.1) 2.94 (1.93 – 4.49) 2.84 (1.86 – 4.35) 94 (0.2) 29 (0.1) 3.42 (2.24 – 5.21) 3.36 (2.20 – 5.13) >360 da ys prior to the ID 565 (1.1) 380 (0.7) 1.52 (1.33 – 1.73) 1.52 (1.33 – 1.74) 577 (1.0) 321 (0.6) 1.88 (1.64 – 2.16) 1.88 (1.63 – 2.16) Acute v estibular neur onitis ≤ 30 da ys prior to (includigng) the ID 18 (0.0) <5 b(0.0) 17.98 (2.40 – 134.54) 17.90 (2.38 – 134.45) 19 (0.0) 0 (0.0) NA NA 31 to 360 da ys prior to the ID 23 (0.0) 5 (0.0) 4.60 (1.75 – 12.10) 3.95 (1.50 – 10.46) 45 (0.1) 22 (0.0) 2.10 (1.25 – 3.52) 1.98 (1.17 – 3.34) >360 da ys prior to the ID 123 (0.2) 78 (0.1) 1.58 (1.19 – 2.09) 1.49 (1.12 – 1.99) 267 (0.5) 158 (0.3) 1.70 (1.39 – 2.07) 1.69 (1.39 – 2.07) Otitis media ≤ 30 da ys prior to (includigng) the ID 548 (1.0) 13 (0.0) 44.05 (25.41 – 76.36) 43.55 (25.11 – 75.54) 566 (1.0) 38 (0.1) 15.74 (11.33 – 21.86) 15.76 (11.34 – 21.91) 31 to 360 da ys prior to the ID 784 (1.5) 201 (0.4) 4.12 (3.52 – 4.82) 4.09 (3.49 – 4.79) 969 (1.7) 288 (0.5) 3.62 (3.17 – 4.14) 3.62 (3.17 – 4.14) >360 da ys prior to the ID 5171 (9.6) 4391 (8.2) 1.27 (1.21 – 1.33) 1.24 (1.19 – 1.30) 6381 (11.4) 5092 (9.1) 1.38 (1.32 – 1.44) 1.37 (1.32 – 1.43) Lab yrinthitis ≤ 30 da ys prior to (includigng) the ID 155 (0.3) 5 (0.0) 31.29 (12.84 – 76.23) 29.62 (12.14 – 72.28) 253 (0.5) 15 (0.0) 17.46 (10.37 – 29.40) 17.05 (10.11 – 28.73) 31 to 360 da ys prior to the ID 298 (0.6) 89 (0.2) 3.47 (2.73 – 4.40) 3.43 (2.69 – 4.36) 569 (1.0) 188 (0.3) 3.16 (2.68 – 3.74) 3.07 (2.60 – 3.64) >360 da ys prior to the ID 1453 (2.7) 992 (1.8) 1.51 (1.39 – 1.64) 1.47 (1.35 – 1.59) 2885 (5.2) 2022 (3.6) 1.49 (1.40 – 1.58) 1.46 (1.38 – 1.55) Conductiv e Hearing Loss ≤ 30 da ys prior to (includigng) the ID 19 (0.0) <5 b (0.0) 18.97 (2.54 – 141.51) 21.20 (2.81 – 159.97) 33 (0.1) <5 b (0.0) 16.49 (3.96 – 68.68) 18.60 (4.45 – 77.82) 31 to 360 da ys prior to the ID 13 (0.0) <5 b (0.0) 6.50 (1.47 – 28.80) 6.95 (1.55 – 31.13) 16 (0.0) <5 b (0.0) 8.00 (1.84 – 34.79) 7.62 (1.75 – 33.25) >360 da ys prior to the ID 127 (0.2) 112 (0.2) 1.13 (0.88 – 1.46) 1.10 (0.85 – 1.43) 163 (0.3) 117 (0.2) 1.40 (1.10 – 1.77) 1.39 (1.09 – 1.76) Benign positional vertigo ≤ 30 da ys prior to (includigng) the ID 146 (0.3) 12 (0.0) 12.61 (6.99 – 22.74) 11.95 (6.61 – 21.60) 316 (0.6) 25 (0.0) 13.32 (8.86 – 20.03) 13.33 (8.86 – 20.06) 31 to 360 da ys prior to the ID 344 (0.6) 124 (0.2) 2.92 (2.37 – 3.60) 2.80 (2.27 – 3.46) 616 (1.1) 274 (0.5) 2.39 (2.07 – 2.77) 2.33 (2.01 – 2.69) >360 da ys prior to the ID 1189 (2.2) 725 (1.4) 1.70 (1.55 – 1.87) 1.65 (1.50 – 1.82) 2299 (4.1) 1569 (2.8) 1.54 (1.44 – 1.65) 1.52 (1.42 – 1.63) Cerumen ≤ 30 da ys prior to (includigng) the ID 2502 (4.6) 237 (0.4) 11.83 (10.32 – 13.56) 11.58 (10.10 – 13.29) 1747 (3.1) 170 (0.3) 11.57 (9.84 – 13.61) 11.50 (9.77 – 13.53) 31 to 360 da ys prior to the ID 3737 (6.9) 2037 (3.8) 2.11 (1.99 – 2.24) 2.06 (1.94 – 2.18) 2943 (5.3) 1475 (2.6) 2.23 (2.09 – 2.38) 2.19 (2.05 – 2.34) >360 da ys prior to the ID 7841 (14.6) 8009 (14.9) 1.10 (1.06 – 1.14) 1.07 (1.04 – 1.11) 6861 (12.3) 6504 (11.6) 1.16 (1.12 – 1.21) 1.15 (1.11 –
1.20) (Continued
)
Clinical Epidemiology downloaded from https://www.dovepress.com/ by 118.70.13.36 on 20-Aug-2020
T able S3 (Continued). Men (n=53,874) W omen (n=55,909) Tinnitus cases (%)
Tinnitus- free contr
ols (%) OR crude (95% CI) OR adjusted a (95% CI) Tinnitus cases (%) Tinnitus- fre e contr ols (%) OR crude (95% CI) OR adjusted a (95% CI) Otitis externa ≤ 30 da ys prior to (includigng) the ID 970 (1.8) 96 (0.2) 10.81 (8.74 – 13.36) 10.71 (8.65 – 13.25) 905 (1.6) 107 (0.2) 9.03 (7.38 – 11.06) 9.10 (7.43 – 11.15) 31 to 360 da ys prior to the ID 1713 (3.2) 717 (1.3) 2.56 (2.34 – 2.80) 2.56 (2.34 – 2.80) 1862 (3.3) 789 (1.4) 2.54 (2.33 – 2.76) 2.53 (2.32 – 2.75) >360 da ys prior to the ID 6353 (11.8) 5585 (10.4) 1.22 (1.17 – 1.27) 1.20 (1.15 – 1.25) 6818 (12.2) 5500 (9.8) 1.34 (1.29 – 1.39) 1.33 (1.28 – 1.38) Notes: aAdjusted for BMI categor y, smoking status, alcohol consumption. bFo r con fi dentiality re asons, we do not pr ovide the number of patients in categories containing less than fi ve patients. Abbre viations: CI, con fi dence inter val; ID , index date; NA, not available; OR, odds ratio . T able S4 Distribution of comorbidities in patients with tinnitus and their matched contr ols, strati fi ed by sex: head and neck disorders Men (n=53,874) W omen (n=55,909) Tinnitus cases (%)
Tinnitus- free contr
ols (%) OR crude (95% CI) OR adjusted a (95% CI) Tinnitus cases (%) Ti nnitus-fr e e contr o ls (%) OR crude (95% CI) OR adjusted a (95% CI) T ension-type headache ≤ 30 da ys prior to (includigng) the ID 38 (0.1) 0 (0.0) NA NA 66 (0.1) 9 (0.0) 7.47 (3.72 – 14.99) 7.55 (3.76 – 15.18) 31 to 360 da ys prior to the ID 117 (0.2) 48 (0.1) 2.47 (1.77 – 3.46) 2.38 (1.70 – 3.35) 242 (0.4) 97 (0.2) 2.56 (2.02 – 3.24) 2.57 (2.03 – 3.26) >360 da ys prior to the ID 1143 (2.1) 708 (1.3) 1.64 (1.49 – 1.81) 1.57 (1.43 – 1.73) 2188 (3.9) 1468 (2.6) 1.54 (1.44 – 1.65) 1.52 (1.42 – 1.63) Concussion ≤ 30 da ys prior to (includigng) the ID 14 (0.0) <5 b(0.0) 1 4 .0 0 (1 .8 4 – 1 0 6 .4 1 ) 13.36 (1.74 – 102.45) 11 (0.0) <5 b (0.0) 5.50 (1.22 – 24.80) 5.98 (1.32 – 27.08) 31 to 360 da ys prior to the ID 15 (0.0) 7 (0.0) 2.14 (0.87 – 5.26) 2.31 (0.93 – 5.75) 24 (0.0) 12 (0.0) 2.00 (1.00 – 4.00) 2.00 (1.00 – 4.01) >360 da ys prior to the ID 332 (0.6) 324 (0.6) 1.03 (0.88 – 1.20) 1.02 (0.88 – 1.20) 207 (0.4) 173 (0.3) 1.20 (0.98 – 1.47) 1.21 (0.99 –
1.49) (Continued
)
Clinical Epidemiology downloaded from https://www.dovepress.com/ by 118.70.13.36 on 20-Aug-2020
T able S4 (Continued). Men (n=53,874) W omen (n=55,909) Tinnitus cases (%)
Tinnitus- free contr
ols (%) OR crude (95% CI) OR adjusted a (95% CI) Tinnitus cases (%) Ti nnitus -fr e e contr o ls (%) OR crude (95% CI) OR adjusted a (95% CI) T empor omandibular joint disord ers ≤ 30 da ys prior to (includigng) the ID 38 (0.1) 7 (0.0) 5.43 (2.42 – 12.15) 5.27 (2.34 – 11.85) 77 (0.1) 10 (0.0) 7.81 (4.05 – 15.10) 7.59 (3.92 – 14.70) 31 to 360 da ys prior to the ID 106 (0.2) 38 (0.1) 2.80 (1.93 – 4.06) 2.73 (1.88 – 3.97) 202 (0.4) 106 (0.2) 1.93 (1.53 – 2.45) 1.86 (1.47 – 2.36) >360 da ys prior to the ID 696 (1.3) 413 (0.8) 1.70 (1.51 – 1.93) 1.64 (1.44 – 1.85) 1627 (2.9) 1088 (2.0) 1.53 (1.41 – 1.65) 1.50 (1.39 – 1.62) Whiplash ≤ 30 da ys prior to (includigng) the ID 44 (0.1) 7 (0.0) 6.44 (2.90 – 14.30) 5.77 (2.59 – 12.86) 42 (0.1) 8 (0.0) 5.27 (2.47 – 11.22) 5.12 (2.40 – 10.92) 31 to 360 da ys prior to the ID 160 (0.3) 112 (0.2) 1.45 (1.13 – 1.84) 1.41 (1.10 – 1.81) 185 (0.3) 120 (0.2) 1.56 (1.24 – 1.97) 1.54 (1.22 – 1.94) >360 da ys prior to the ID 2144 (4.0) 1724 (3.2) 1.26 (1.18 – 1.35) 1.25 (1.17 – 1.33) 2373 (4.2) 2054 (3.7) 1.17 (1.10 – 1.25) 1.16 (1.09 – 1.23) Cer vicalgia ≤ 30 da ys prior to (includigng) the ID 425 (0.8) 81 (0.2) 5.57 (4.39 – 7.07) 5.41 (4.26 – 6.88) 560 (1.0) 129 (0.2) 4.90 (4.03 – 5.95) 4.80 (3.94 – 5.83) 31 to 360 da ys prior to the ID 1184 (2.2) 674 (1.3) 1.90 (1.72 – 2.09) 1.81 (1.64 – 2.00) 1816 (3.3) 1066 (1.9) 1.88 (1.74 – 2.03) 1.83 (1.69 – 1.98) >360 da ys prior to the ID 7533 (14.0) 5411 (10.0) 1.53 (1.47 – 1.59) 1.49 (1.43 – 1.55) 10,542 (18.9) 7988 (14.3) 1.48 (1.43 – 1.53) 1.46 (1.41 – 1.51) Migraine ≤ 30 da ys prior to (includigng) the ID 103 (0.2) 17 (0.0) 6.16 (3.69 – 10.30) 5.73 (3.42 – 9.60) 243 (0.4) 63 (0.1) 4.09 (3.10 – 5.39) 3.98 (3.01 – 5.26) 31 to 360 da ys prior to the ID 246 (0.5) 134 (0.3) 1.87 (1.51 – 2.31) 1.77 (1.43 – 2.19) 799 (1.4) 469 (0.8) 1.81 (1.62 – 2.04) 1.76 (1.57 – 1.98) >360 da ys prior to the ID 2821 (5.2) 1988 (3.7) 1.45 (1.37 – 1.54) 1.41 (1.33 – 1.49) 6698 (12.0) 5172 (9.3) 1.37 (1.32 – 1.42) 1.35 (1.30 – 1.40) Cranial ner v e disor ders ≤ 30 da ys prior to (includigng) the ID 33 (0.1) 10 (0.0) 3.30 (1.63 – 6.70) 3.43 (1.68 – 6.99) 57 (0.1) 11 (0.0) 5.23 (2.74 – 9.98) 5.14 (2.69 – 9.83) 31 to 360 da ys prior to the ID 122 (0.2) 53 (0.1) 2.36 (1.70 – 3.28) 2.26 (1.62 – 3.14) 220 (0.4) 124 (0.2) 1.78 (1.43 – 2.23) 1.75 (1.40 – 2.19) >360 da ys prior to the ID 874 (1.6) 722 (1.3) 1.22 (1.10 – 1.35) 1.21 (1.09 – 1.33) 1412 (2.5) 1050 (1.9) 1.36 (1.26 – 1.48) 1.37 (1.26 – 1.48) Notes: aAdjusted for BMI categor y, smoking status, alcohol consumption. bFo r con fi dentiality re asons, we do not pr ovide the number of patients in categories containing less than fi ve patients. Abbre viations: CI, con fi dence inter val; ID , index date; NA, not available; OR, odds ratio .
Clinical Epidemiology downloaded from https://www.dovepress.com/ by 118.70.13.36 on 20-Aug-2020
Clinical Epidemiology
Dovepress
Publish your work in this journal
Clinical Epidemiology is an international, peer-reviewed, open access, online journal focusing on disease and drug epidemiology, identifi ca-tion of risk factors and screening procedures to develop optimal pre-ventative initiatives and programs. Specific topics include: diagnosis, prognosis, treatment, screening, prevention, risk factor modification,
systematic reviews, risk & safety of medical interventions, epidemiol-ogy & biostatistical methods, and evaluation of guidelines, translational medicine, health policies & economic evaluations. The manuscript management system is completely online and includes a very quick and fair peer-review system, which is all easy to use.
Submit your manuscript here:https://www.dovepress.com/clinical-epidemiology-journal
Clinical Epidemiology downloaded from https://www.dovepress.com/ by 118.70.13.36 on 20-Aug-2020