A Study On “Financial Analysis”
Onteddu Naga Manju Vani1, M shiva2, Dr.K.Veeraiah MBA (ph.D)3
1
P.G. Scholar, 2Guide, Assistant Professor, 3Head of the Department 1,2,3
Department: Department of Management Studies 1,2,3
Branch: MBA(finance) 1,2,3
Marri Laxman Reddy Institute of Technology and Management E mail id: [email protected],[email protected]
ABSTRACT
The success of every business enterprise is directly related to the competencies of business management. The business enterprise can, as a result, create variations of how to approach the new complex and changing situations of success in the market. Therefore managers are trying during negative times to change their management approach, to ensure long-term and stable running of the business enterprise. They are forced to continuously maintain and obtain customers and suppliers. By implementing these measures they have the opportunity to achieve a competitive advantage over other business enterprises.
Keywords : Financial analysis, company, profit, activity, profitability, liquidity, indebtedness
INTRODUCTION
Financial Analysis (also referred to as budget Analysis or Accounting Analysis or Analysis of Finance) refers to the analysis of the viability, stability and profitableness of a business, sub-business or project. This is done by specialists United Nations agency create reports exploitation proportions that use data derived from monetary statements and alternative reports. These reports area unit typically given to prime management together of their bases in creating business selections.
Financial analysis
Maintain or discontinue its main operation or a part of its business; Make or get some ingredients in its product preparation; obtaining or rental / leasing sure machinery and instrumentality within the production of its goods; Issue stocks to lift assets or discuss a bank loan; Make selections concerning investment or loaning capital; Make alternative selections to tell the assorted alternatives within the business behavior of management.
Significance of proportions
Profitability ratios show the angle of a company's profitableness (a). homeowners of the corporate and (b). The company's operative potency, .ROI magnitude relation falls into the primary class. The company's potency in terms of economical use of resources is mirrored in lucre. Despite the high come on the check of improved performance, a lower margin doesn't imply a lower come on investment if a firm has higher investment / quality turnover. Therefore, the operative potency of a corporation are often calculable supported a mix of each the earnings power and also the come on investment (ROI). The earning power of a corporation are often outlined because the overall profitableness of a corporation.
There square measure 2 aspects to the current ratio:
(A)Profitableness on sales as mirrored in lucre, and
thought through the investment / plus turnover.
Comparative statement analysis
A common technique of characteristic periodic changes during a company's monetary performance is to arrange comparative statements. Comparative monetary statements cowl a minimum of 2 periods. Changes — growth and reduce — within the financial gain statements and over time the record will show 2 ways:
(1)Total changes and (2) proportional changes.
Total or proportion, or both, could represent total changes by drawing separate columns for growth and reduce. The relative, or proportional, case of the profit and loss statement is that the amount of sales is assumed to be traditional (hence up to 100) and every one different product square measure expressed as a proportion of sales. Similarly, record things square measure expressed as a proportion of total funds. monetary statements ready on common base proportion things square measure referred to as general-sized statements. the sort of study is named vertical analysis and since it studies changes at a selected information, it implies consistent relationships.
Research of comparative monetary statements will facilitate highlight necessary facts and means the requirement for any analysis. India's revealed balance sheets of common-stock firms and profit and loss accounts square measure given in biennial comparative type. Some firms additionally report shortened statements to shareholders for AN extended year. produce AN
analytical perspective, such statements square measure terribly helpful for investors.
NEED FOR THE STUDY
Financial coming up with is AN integral a part of monetary coming up with. prediction uses past information to predict future monetary wants. it's vital to achieve power to grasp the monetary performance of the corporate. it's used as a benchmark for assessing the monetary position and performance of an organization. Earning power helps to capture giant amounts of monetary of economic information and build qualitative judgments concerning the financial performance of the corporate. Since MSL could be a leading company in NBFCS, it's necessary to try and do analysis and calculate company earnings.
With the assistance of earning power, one will decide-
Ability to fulfill returns on internet assets liabilities.
To what extent has the corporate used its semi permanent economic condition by taking funds.
The flexibility of the corporate to use its assets to get sales revenue.
All operational potency and performance of the operational company
RESEARCH
Based on the objectives of the study, careful analysis was adopted. The descriptive one, it's most frequently wont to interfere with attainable relationships between variables. this can be the only kind of analysis. it's designed to assemble careful data and supply data to form a lot of refined studies. It involves creating a lot of specific hypotheses and testing them through applied mathematics logical thinking.
SOURCE OF KNOWLEDGE
collected from records and to boot printed as annual reports of the corporate. Relevant data was collected from journals and journals of publications in trade and social science.
LIMITATIONS OF THE STUDY
The data used is principally from historical annual reports out there to the general public and doesn't represent this state of the organization.
Thanks to restricted fundamental quantity, careful analysis of project work can't be done.
Matters don't get a similar simply as monetary matters are sensitive in nature.
ANALYSIS TOOL:
Muthoot Capital Services restricted Company's knowledge taken from 2 totally different sources has been rigorously & meaningfully analyzed mistreatment well-established money instruments and applied math strategies. money performance on a company's earning power is measured supported come on internet assets and come on equity.
ABOUT INDUSTRY
The Indian economy is in turmoil thanks to the turmoil within the western monetary sector that began within the last half of
2008-2009. However, our economy will face up to those pressures and record a GDP rate of vi.7%. though down from 11th of September the previous year. rate compared to our neighbors and Western countries. this can be thanks to the sturdy actions taken by the govt of Republic and also the bank of India.
Non-Banking monetary Services continuing its sturdy growth with the sturdy support of the govt of Asian nation and helped lower financial gain teams by providing sensible returns on their savings and providing timely and fast financial backing to those in would like. Demand for NBFCs' credit product raised as a results of reduced credit flows from banks and monetary establishments throughout the year. However, NBFCs have additionally suffered the negative effects of the financial condition, that could be a major a part of their operating funds thanks to the reduced convenience and raised value of bank finance. the govt and tally have recognized the importance of NBFCs in meeting the requirements of unorganized sector disposal in rural and semi-urban areas and have given sturdy suggestions for guaranteeing credit flow to NBFCs. Since then true has improved and with continuing support from the govt and tally, NBFCs ar able to continue their glorious performance.
MUTHOOT SECURITIES LIMITED PROFILE
Contact
•Muthoot Securities restricted (MSL) may be a public restricted non-banking no depository financial institution registered with the banking concern of Republic of India and listed on the city securities market. Established in Feb 1994 in Kerala, MSL provides capital market solutions, as well as Leasing Purchase, Vehicle Loans and Bonds & Deposits, with added services for the advantage of our customers.
has been signed eight.5 times - throughout which period the national capital market has slowed. most the subscription was received from the state of Kerala. MSL is additionally diversifying into fund and non-fund based mostly activities with equal stress on company and non-corporate sectors in Kerala. Encouraged by the area unit Muthoot Pappachan cluster, MSL has these days become one amongst the leading money establishments within the capital market, with its foundations chemical analysis back to 1939, within the banking and finance sector, notably in rural and semi-southern Republic of India.
DATA ANALYSIS AND INTERPRETATION Asset turnover
Some analysts need to calculate total plus turnover additionally to or rather than internet plus turnover. This ration shows the flexibility to come up with sales from all monetary sources committed to (or not) internet assets. Funds that treat internet assets ar known as Capital utilized. internet assets equal internet mounted assets and current assets minus current liabilities excluding bank loans. This way:
Gross profit margin
The first gain quantitative relation in regard to sales is margin. it's calculated by dividing margin by sales. margin is that the distinction between marketing and marketing product.
Evaluation of operating leverage
Operating leverage is outlined as a amendment in earnings before interest and taxes (EBIT) for a given amendment in sales. EBIT changes additional or less changes in sales counting on the magnitude
relation of fastened prices. instead, operational leverage is outlined as taxes to earnings and profits (GP) before interest.
Operating Performance Of Return On Net Assets (Or) Return On Capital Employed
This magnitude relation is expounded to the come on investment within the firm and reflects the general profit of the business in relevancy the investment, associate degree indicator of the excess generated on the invested with money; This magnitude relation measures productivity. Investment, expressed in percentages. The term investment refers to semi permanent funds invested with in an exceedingly business and is termed web assets (or) capital.
Financial leverage through PAT /EBIT Financial leverage (or) tax leverage is defined as the ability of a firm to use interest and tax to magnify the effects changes in PAT/EBIT on the firm’s earning power.
Financial leverage through net assets/net worth
RETENTION RATIO:
The ratio shows the proportion of profits retained in the business out of the current year’s profits. In fact the payout ratio and retained earnings ratio should be equal to 100.
Financial efficiency return on equity Ordinary or general shareholders square measure entitled to the remaining profits. The dividend rate isn't determined: earnings are often distributed to shareholders or maintained within the business. However, net profit when tax represents their come. come on shareholders 'equity is calculated to visualize the gain of the owners' investment. Shareholders' equity or internet value includes paid share capital and reserves and surplus.
Equity Growth
A firm can convert its return on equity (ROE) into a growth in equity through retention. Equity growth as a result of retention policy is a product of return on equity and retention ratio.
Earning power
A company might sell little quantities at higher costs or larger ones at lower costs to keep up gain. In different words, the firm's revenue strength relies on 2 factors: (a) lucre and (b) investment turnover. along these factors gift a whole image of the company's operation. Investment returns mirror the share earning power and this is
often the merchandise of lucre and investment turnover.
Earning power = Return on investment
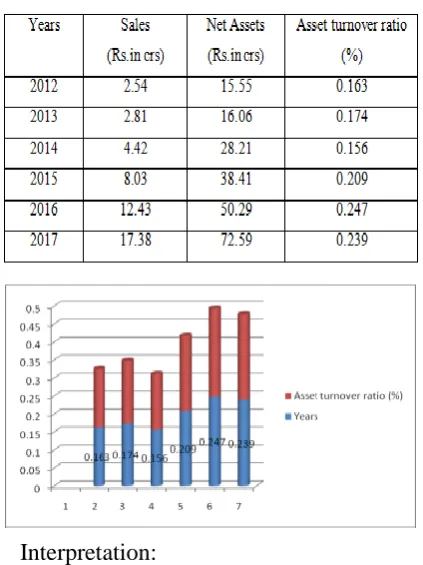
1 CALCULATION OF ASSET
TURNOVER RATIO
Table 3.1 Asset Turnover ratio
Interpretation:
From the on top of table, it will be determined that cyberspace quality turnover quantitative relation has steady inflated except in 2012. web quality worth additionally inflated at constant time. however compared to sales, web value has not inflated. cyberspace quality turnover quantitative relation was the best in 2014, 0.247% and also the lowest in 2011 was zero.156%.
3.2CALCULATION OF GROSS
Table: 3.2 Gross profit margin ratio
Interpretation:
From the higher than table, it will be ascertained that the net profit margin redoubled throughout the 2012-17 study amount, excluding 2013-17. The net profit margin redoubled attributable to redoubled sales of the corporate, that additionally redoubled net profit. The net profit margin price for 2014 was zero.501%. and also the minimum in 2012 is zero.358%.
3.3CALCULATION OF OPERATING LEVERAGE:
Operating leverage may be defined as change in earnings before interest and taxes (EBIT) for a given change in sales.
Table: 3.3 operating leverage ratio
Interpretation:
From the on top of table, it is discovered that the in operation leverage magnitude relation fluctuated throughout the 2012-17 study amount. in operation leverage magnitude relation fluctuated because of inconsistencies between the degree of modification of EBIT and also the degree of modification of the general practitioner. in operation leverage magnitude relation stands at one.759% in 2013 and one.29% in 2012.
Interpretation:
From the higher than table, it may be seen that world wide web plus come back accrued throughout the 2012-17 study amount apart from 2015. come back on web assets accrued as EBIT accrued. RONA was at its peak in 2014, which is 0.2% .NET assets additionally accrued within the amount below that EBIT accrued.
3.5CALCULATION OF FINANCIAL LEVERAGE THROUGH PAT/EBIT: Financial leverage (or) tax leverage is defined as the ability of a firm to use interest and tax to magnify the effects changes in PAT/EBIT on the firm’s earning power.
Table: 3.5 Financial Leverage through PAT/EBIT
Interpretation:
From the higher than table, it is seen that the monetary leverage fluctuated throughout the 2012-17 study amount. monetary leverage fluctuates as EBIT and PAT increase in worth. monetary leverage was zero.4% in 2012 and zero.35% in 2013.
3.6CALCULATION OF FINANCIAL LEVERAGE RATIO THROUGH NET ASSETS/NET WORTH:
Table: 3.6 financial leverage ratio
Interpretation:
quality worth is enhanced. monetary leverage in 2015 was four.50% and in two012 it absolutely was 2.01%.
3.7CALCULATION OF RETURN ON EQUITY
Table: 3.7 Return on equity
Interpretation:
From the table higher than, it may be seen that the come back on equity accrued slightly throughout the 2012-17 study amount. The come back on equity is thanks to a rise in PAT. come back on equity was high in 2015, which implies four.50% and therefore the low is a pair of.2.01%.
3.8Retention ratio:
Retention ratio shows the relationship between retained earnings and profit after tax
Table3.8: Retention Ratio
Interpretation:
From the on top of table, it is discovered that the retention magnitude relation fluctuated throughout the 2012-17 study amount. The retention magnitude relation exaggerated for the primary 2 years and so bated 2 years later as a result of changes in PAT and preserved earnings. The retention magnitude relation was the very best in 2012, i.e. 2.5% in 2013 and also the lowest in 2013 i.e. 1.38%.
3.9CALCULATION OF EQUITY
GROWTH:
Interpretation:
From the on top of table, it is ascertained that the equity growth quantitative relation has hyperbolic ceaselessly throughout the amount 2012-17 .The equity growth quantitative relation has hyperbolic steady as all preserved earnings have hyperbolic. Equity Growth quantitative relation was the best in 2015, with a mean of zero.096% and an occasional of zero.158% in 2012.
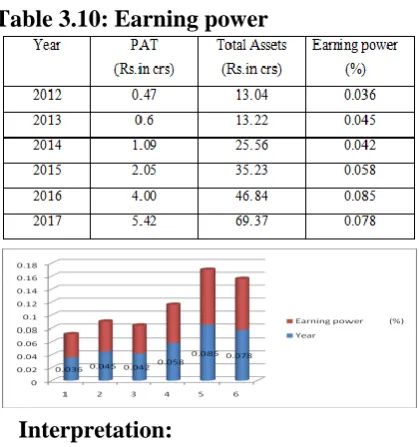
3.10CALCULATION OF EARNING POWER
The percentage of return of investment reflects the earning power and it is the product of net profit margin and investment turn over.
Earning power = Return on investment
Table 3.10: Earning power
Interpretation:
From the on top of table, it are often seen that the earning power magnitude relation fluctuated throughout the 2012-17 study amount, and also the earnings power magnitude relation exaggerated in 2012 and so shrunken over consequent year, increasing the earning power magnitude relation from 2012-14. The earning power magnitude relation for 2014 was at a most of zero.0.085% and a minimum of zero.0.36%.
3.11ESTIMATION OF RETURN ON NET INCOME:
By using the statistical formula, based on the past data we can estimate the future value
Interpretation:
Forecasted values of return on total income for 2018 = 27.402 crores
Forecasted value of return on total income for 2019= 32.96 crores
3.12ESTIMATION OF TOTAL
ASSETS:
By using the statistical formula, based on the past data we can estimate the future value
Interpretation:
Forecasted values of total assets for 2018= 73.0941 crores
Forecasted value of total assets for 2019= 84.2991 crores
3.13CALCULATION OF CO-
EFFICIENT OFCORRELATION
BETWEEN ASSET TURNOVER
RATIO (ATR) & OPERATING
LEVERAGE (OLR)
3.13.Co-efficient correlation between ATR and OLR
Co-efficient correlation between Asset turnover ratio and Operating leverage R = 0.4059
Interpretation:
The parametric statistic between the plus turnover magnitude relation and operational leverage is zero.4059. This shows that there's a positive relationship between plus turnover and operational leverage. This suggests that if the plus turnover magnitude relation will increase, therefore will the operational leverage magnitude relation.
FINDINGS SUGGESTIONS
CONCLUSION
FINDINGS
2020 A Muthoot Securities sales and internet quality values increased from 2012-2017. the worth of sales was high in 2015, that is seventeen.38 crores and internet assets valued at seventy two.59 crores in 2015, however the proportion increase isn't an equivalent as in 2015, because of the very fact that the quality turnover quantitative relation rose to a most of zero.247% in 2014
As the total revenue exaggerated throughout amount the amount} study period, the gross profit margin price conjointly exaggerated and in 2014 the most gross profit margin quantitative relation exaggerated to eight.43 crores.
LTD's EBIT of square measure Muthoot Securities exaggerated throughout the study amount and exaggerated to a most of fourteen.5 crores in 2014 and an occasional of one.29 crores in 2012, compared to the gross profit margin. because of this operational leverage, fluctuations and lows in 2013 mean one.29%.
Changes Degree EBIT and PAT aren't identical, that results in money leverage over the study amount. The degree of amendment in 2014 is zero.74% for EBIT and zero.95% for PAT.
17 Muthoot Securities Limited's investor fund is that the highest in 2015, which means it's price ten.10 crores. this can be as a result of net price of Muthoot Securities restricted exaggerated throughout the 2012-17 study amount .This means that investor funds can grow over the years and therefore the internet price in 2015 can increase to Rs sixteen.10 crore.
PAT and internet price exaggerated throughout the 2012-17 study amount. The degree to that net price rises on top of the degree of growth of the pot. the most internet price growth degree in 2015 is zero.35%.
meaning reserves and surpluses area unit increasing year on year. maintained Earnings most in 2015 was nine.6 crores.
Increased maintained Earnings and internet price exaggerated Equity Growth quantitative relation.
AT PAT and total assets have exaggerated steady however there's a distinction within the level of amendment. the most amendment degree in 2015 is zero.48% .This earning power quantitative relation has fluctuated.
SUGGESTIONS
AT PAT is rising however at constant time interest prices are rising. If the debt obligations square measure reduced and also the interest is reduced, then the corporate will get the most PAT.
If net value rises to a particular level, interest expenses square measure reduced and profits square measure possible to extend.
Retained earnings in Muthoot securities square measure higher as dividends square measure lower for Divide shareholders. attempt to maintain a satisfactory methodology of equalization the earnings and investor fund.
The share worth of Muthoot Securities is low once benchmarking as a result of the dividend policy is insufficient. Share worth will increase if the corporate adopts AN acceptable methodology of distributing dividends.
Share helps the corporate to keep up higher revenues thanks to less profit to its shareholders. This weakens the company's market image.
Operative leverage quantitative relation has fluctuated, which implies that operative leverage isn't used. Management should take forceful measures against it.
Reason Company has no advertising portion, for this reason solely some members realize the corporate.
CONCLUSION
Based on information collected mistreatment Muthoot Securities restricted and money ratios, I conclude that the company's total revenues inflated throughout the 2011-16 study amount which the gross profit margin inflated throughout the study amount, which means that the company's gross profit margin inflated throughout the study amount. operational leverage inflated endlessly as gross profit margin inflated throughout the study amount. Management performance is growing, that makes it clear that management is mistreatment web assets suitably. The company’s maintained earnings stood at fifty nine in 2015, indicating that it's smart prospects for increasing returns on the company’s equities, and therefore the most at 2016 is five.5%.
Finally, we will conclude that Muthoot Securities restricted encompasses a excellent likelihood of turning into a number one company in their sector.
BIBLIOGRAPHY TEXT BOOKS
Financial management I.M.PANDY
Financial management S.P.GUPTHA
Fundamental of financial management
D.CHANDRA BOSE
Managerial economics and financial analysis A.R.ARYASRI
WEBSITES
W.W.W.BAJAJ
AUTOMOBILES.COM