Synthesis of Thiophene -Based Copolymers for Application in Dual
Layer ECDs
Despina Triantou 1, Spyridon Soulis 2, 3 and Silvia Janietz1
1
Fraunhofer Institute for Applied Polymer Research, Department Polymer Electronics, Geiselbergstrasse 69, 14476 Potsdam, Germany
2
Helmholtz-Zentrum Berlin for Materials and Energy GmbH, Institute for Si-Photovoltaics, Kekuléstr. 5, 12489 Berlin, Germany
3
National Technical University of Athens. School of Chemical Engineering, Research Unit of Advanced, Composite, Nano Materials & Nanotechnology, Heroon Polytechniou 9, 15773, Athens, Greece
Abstract
Dual layer electrochromic devices (ECDs) were constructed using copolymers synthesized from electron donor-acceptor-donor (D-A-D) monomers with thiophene-based donor-acceptor-donor moieties. Comonomers having different D-A-D structures were synthesized and successfully electropolymerized as uniform films onto ITO. The properties of the films depended on the acceptor moiety. Compared to the corresponding single layer ECDs, the dual layer devices exhibited genuine multicoloured EC behavior and improved operational characteristics. Further development of the dual layer ECDs is expected to lead towards optimized performance.
Keywords: Electrochromic Materials, Cyclic Voltammetry, EDOT,Benzothiadiazole, EC Devices.
1. Introduction
EC materials have a wide range of applications including smart windows, anti-glare car rear-view mirrors, re-usable price labels, devices for frozen-food monitoring, camouflage materials, etc. [1-3]. Given the many different application fields there is a high demand for new materials having improved EC properties compared to those already available [1, 4-5]. In this field, conducting polymers (CPs) have gained much attention due to their outstanding EC properties and their advantages in processability and durability compared to other possible EC materials (inorganic, viologens, et). The EC properties of the CPs are directly related to their doping-dedoping: through this process their electronic structure changes and, subsequently, their optical properties are affected leading to the creation of different absorption bands in the visible region [1,6,7]. Thus, by changing the applied potential, CPs can change their colour between a “bleached” state and a colored one. When a material has two (or even more) coloured states, it is called multi-coloured and, generally, CPs have multi-coloured EC behavior; this advantage is coupled with fast response on potential changes and, most
importantly, the ability to fine-tune that their band gap (hence, their optical properties) by modifying their chemical structure [7-10]. A very promising route to achieve this fine tuning is by using properly designed (and synthesized) monomers having a structure that combines electron donor (D) and electron acceptor (A) moieties in a D-A-D arrangement. In order to improve the performance and stability of EC polymers the current research has shown that it is opportune to use 3,4-ethylenedioxythiophene (EDOT) as donor [11-14].
The aim of this work is to synthesize EC films having D-A-D structures with thiophene-based donor moieties, investigate the EC and electrochemical properties of them, as well as applying the EC polymers to construct dual layer ECDs.
2. Materials and Methods
2.1 Materials
5,5'-(9,9-dioctyl-9H-fluorene-2,7-diyl)bis(2,3-dihydrothie-no [3,4-b][1,4]dioxine), mo5,5'-(9,9-dioctyl-9H-fluorene-2,7-diyl)bis(2,3-dihydrothie-nomer M1 was synthesized starting from 3,4-ethylenedioxythiophene (Sigma-Aldrich 483028) and 2,7-dibromo-9,9-dioctyl-9H-fluorene (Sigma-Aldrich 560073). n-butyllithium solution (1.6 M in hexane, Sigma-Aldrich 18617), trimethyltin chloride (Sigma-Aldrich 146498), (tributyl-stannyl)thiophene (Sigma-Aldrich 414492) and tetrakis(triphenylphos-phine)palladium (0) (Sigma-Aldrich 697265) were used as received. 4,7-bis(7-methyl-2,3-dihydrothieno[3,4-b][1,4] dioxin-5-yl)benzo[c][1,2,5] thia-diazole, monomer M2, was synthesized starting from benzo[2,5]thiadiazole (Sigma-Aldrich 693847). HBr and Br2 were used as received. Dichloromethane (DCM, anhydrous, Sigma-Aldrich 270997) and acetonitrile (ACN, anhydrous,
Sigma-Aldrich 494445) were used directly without any further purification. Tetrabutylammonium tetraflu-oroborate (for electrochemical analysis, ≥ 99.0%, Fluka 86896) was dried at 120 oC under vacuum prior to use.
2.2 Synthesis of 5,5'-(9,9-dioctyl-9H-fluorene-2,7-diyl)bis(2,3-dihydrothieno[3,4-b][1,4]dioxine) (M1) and 5,7-bis(2,3-dihydrothieno[3,4-b][1,4]dioxin-5-yl)benzo[c][1,2,5]thiadiazole (M2)
Stille couplings were peroformed in microwave oven (CEM Discover DU8107) and the purification of the momomers through Flash Chromatography (ComniFlash chromatography, Teledyne ISCO).
3,4-ethylenedioxythien-2yl trimethylstannane (Scheme 1, structure #1) was synthesized according to the procedure described in the literature [8,15]. 5,5'-(9,9-dioctyl-9H-fluorene-2,7-diyl)bis(2,3-dihydrothieno[3,4-b][1,4]dioxine) (code: M1, structure #5 in Scheme 1) was synthesized by Stille coupling of (1) with 2,7-dibromo-9,9-dioctyl-9H-fluorene (structure #4). 610 mg (2.00 mmol) of (1), 438.4 mg (0.80 mmol) of (4) and 24 mg (0.024 mmol) of tetrakis(triphenylphosphine)palladium were dissolved in anhydrous p-xylene in a glove box. Stille coupling was carried out in a microwave oven with a heating step program (5 min at 120 oC, 5 min at 140 oC and 40 min at
170 oC). The resulting mixture was diluted by
dichloromethane and washed with aqueous solution of
sodium carbonate, NaCO3. The organic layer was
separated, washed with water, dried over MgSO4 and filtered. The product was purified by Flash Chromatography using hexane and ethyl acetate as eluent and the pure product are yellow crystals with a melting point of 118 °C (yield = 84%). NMR spectrum of M1: δH (ppm, CDCl3): 7.79 (t, 6H), 4.30 (d, 8H), 2.00 (d, 4H from CH2 groups) and 0.90-1.10 (multiple, 16H). Anal. calcd for C41H50O4S2 (Mw 670.97 g/mol): C: 73.39, H: 7.51, O: 9.54, S: 9.56; found C: 73.70, H: 7.81, O: 9.20 and S: 9.29.
For the synthesis of the monomer 5,7-bis(2,3-dihydrothieno[3,4-b][1,4]dioxin-5-yl)benzo[c][1,2,5] thia-diazole (M2) the first step is the synthesis of (1) and the bromination of benzo[2,5]thiadiazole (Scheme 1, structure #2). 2.5 g of (2) (18.36 mmol) were mixed with 62.5 ml HBr (2.8 mmol). Then, 15 ml of pure bromine were added dropwise under stirring and the mixture was heated at about 95 oC for 5 h under reflux; afterwards, the mixture was cooled down and the solid product was filtrated, neutralized with water and recrystallized with from a methanol/toluene mixture (yield = 47.3 %). M2 was synthesized by Stille coupling of 4,7-dibromobenzo[2,5]thiadiazole (Scheme 1, structure #3)
with reagent #1 in Scheme 1. 610 mg (2.00 mmol) of (1), 235.17 mg (0.80 mmol) of (3) and 24 mg (0.024 mmol) of tetrakis(triphenylphosphine)palladium were dissolved in anhydrous p-xylene in a glove box, using the same experimental procedure as for M1. The product was purified by Flash Chromatography using hexane and ethyl acetate as eluent and the pure product is dark red powered with a melting point of 140 oC (yield = 47 %). NMR spectrum of M2: δH (ppm, CDCl3) : 8.40 (s, 2H), 6.60 (s, 2H) and 4.32, 4.43 (d, 8H). Anal. calcd for C18H12N2O4S3 (Mw 416.49 g/mol): C: 51.91, H: 2.90, N: 6.73, O: 15.37, S: 23.09; found C: 52.30, H: 3.06, N: 6.59, O: 15.66 and S: 22.39.
Scheme 1. Synthetic route for monomers M1 and M2. M1: 5,5'-(9,9-dioctyl-9H-fluorene-2,7-diyl)bis(2,3-dihydrothieno[3,4-b][1,4]dioxine)
M2 : 4-(2,3-dihydrothieno[3,4-b][1,4] dioxin-5-yl)-7-(2,3-dihydrothieno[3,4-b][1,4]dioxin-7-yl) benzo[c][1,2,5] thiadiazole
2.3 Electrochemistry
Electrochemical experiments were performed using a Cyclic EG&G Parc model 273 potentiostat controlled by an IBM P70 computer. An one-compartment electrochemical cell with a three electrode setup was used. An indium-tin oxide coated glass (ITO, Balzers, 30 nm fully oxidized ITO on SiO2 with a resistance 78 Ohm / sq, 2.5 x1.0 cm) or a Pt plate (0.15 cm2) were used as working electrodes for the deposition of the films. A Pt wire or Pt mesh were used as counter electrode and a Ag/AgCl (3M NaCl and sat. AgCl) as reference electrode. ITO electrodes were cleaned prior to their use by sequential ultrasonication in acetone, water and isopropyl alcohol (10 min in each solvent). Afterwards, they were further cleaned by exposure for 2 min on air plasma and were
dried on a hot plate (120 oC, 10 min). The
electropolymerization solution was a mixture of acetonitrile with dichloromethane (ACN:DCM = 1:1 v/v), with tetrabutylammonium tetrafluoroborate (TBABF4, 0.1 M) as supporting electrolyte and the monomer (M1 or M2) at a concentration 1 mM. After electropolymerization, the two respective polymer films (P1 and P2) were rinsed with ACN:DCM=1:1 v/v solution in order to remove the residues of polymerization and the soluble oligomers and then they were dried under argon flow. The electrochemical investigations of the already formed films on ITO or Pt electrodes was carried out using the same electrode set-up in a monomer-free solution of TBABF4 (0.1 M) in acetonitrile. All the electrochemical experiments were performed at room temperature and prior to them, the solution was purged with argon. The electrochemical cell was calibrated by the use of a ferrocene standard and the half-wave potential has been estimated to be 435 mV for this assembly.
2.4 Spectroelectrochemistry
Spectroelectrochemical data were recorded on an 8453 UV− 358 visible Spectophotometer (Agilent, Germany) connected to a computer. The potential was obtained with the potentiostat PGSTAT 302N from AUTOLAB, controlled by a PC running under GPES from Windows (ECO Chemie B. V.). The polymer films on ITO electrodes were measured in a cell of 1 cm path length. A three electrode cell assembly was used, where the working electrode was the ITO/ EC polymer, a Pt wire acted as counter and an Ag/AgCl (2 M KCl / EtOH) as the reference electrode. The measurements were carried out at room temperature under Ar and the equilibration time for each measurement was 20 sec.
2.5 Construction of the electrochromic devices (ECDs)
Apart from the aforementioned EC copolymers, two more polymer films were used, namely poly(5,7-di(thiophene-2-yl)2,3-diphenyl-thieno[3,4-b]pyrazine) (code: P3, Scheme 2) and poly(2,5-bis (2-(3,4-ethylenedioxy)thienyl)pyridine) (code: P4, Scheme 2). Their synthesis and properties have been already described in the literature [8, 9].
For the construction of the ECDs a custom made gel electrolyte was developed. The electrolyte was applied by casting and it was based on PMMA (Mw=350.000) and TBABF4 that was plasticized with propylene carbonate (PC) to form a highly transparent, conductive gel. PC acted additionally as solvent. The composition of the
casting solution PC/PMMA/TBABF4 was 94.5/ 2.5/ 3 w/w (by weight ratio).
Scheme 2. Chemical structures of P3 and P4.
P3 P4
Both P1 and P2 were used in single and dual layer ECDs. For the ECDs, a layer of polymer film was deposited onto ITO electrodes (1.5 x 2.5 cm2) by cyclic voltammetry. After the deposition, the films were washed with ACN:DCM mixture and dried under nitrogen flow. The deposited films were used as the anode of the ECD; a second ITO was used as the cathode. The electrodes were separated through a UHU (plus Schnellfest) or DELO glue, which both prevented the short circuits between the electrodes and acted as the container for the electrolyte solution. Prior to the electrolyte casting, the void between the electrodes was thoroughly dried. Electrical contacts were applied to the free surface of both ITO substrates. The same procedure was followed for the dual ECDs, with the difference that both ITOs were covered with polymer films.
2.6 Instrumentation
High-resolution 1H-NMR spectra (500 MHz) were
recorded on a UNITY INOVA 500 spectrometer (Varian) at room temperature. Elemental analysis was performed using a Thermo Scientific Flash EA 1112 CHNS/O Automatic Elemental Analyzer. The UV-Vis spectra were recorded by a Lambda 19-UV/VIS/NIR-spectrometer (PerkinElmer). The scanning electron microscopy investigations (SEM) were carried out using a HITACHI S-4100 scanning electron microscope with a cold field emission cathode. Atomic force microscopy (AFM) was performed with an ‘autoprobe CP’ from Park Scientific Instruments (Digital Instruments, Santa Barbara) operating in contact mode. The instrument was equipped with a 100x100 μm2
hardware linearized scanner and commercial silicon tips (modelCSG01, the force constant was 0.1 N/m and the tip radius was smaller than 30 nm).
3. Results and Discussion
3.1 Electropolymerization of M1 and M2
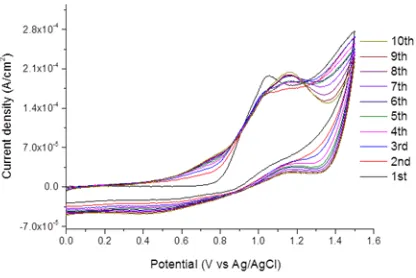
The electropolymerization of M1 was performed using cyclic voltammetry (CV) between 0 to 1.5 V. In Figure 1 the first 10 scans are presented. During the first scan, the oxidation of the monomer took place appearing as a broad peak at 1.2 - 1.3 V. Moreover, two reduction peaks were present, at 1.25 V and 1.05 V. The latter (at 1.05 V) could be attributed to the dedoping of the already formed polymer. Concerning the former reduction peak (at 1.25 V) it was not clear what represents; in order to clarify if it was due to the reduction of the monomer (i.e. the oxidation of the M1 is reversible or quasi-reversible) or not, CV using different scan rates (from 25 to 300 mV/s) were performed. Different criteria were applied [8] and it was proven that the oxidation is not reversible. Thus, the peak is most probably due to the reduction of soluble oligomeric species formed in the vicinity of electrode surface. From the second scan onwards, the oxidation current increases very fast after 1.0 V and one sharp peak appears at 1.4 V, attributed to the further oxidation (i.e. polymerization) of the monomer; likewise, from the 3rd scan onwards, the two reduction phenomena (i.e. of the monomer and the polymer) were also merged into one peak, centered at 1.2 V. Already from the 2nd scan, a blue coloured film deposited onto ITO could be observed.
Fig. 1 Cyclic voltammograms (vs. Ag/AgCl) during the electropolymerization of M1 on ITO electrode (solution: 1 mM of monomer in 0.1 M TBABF4 solvent: 1:1 v/v MeCN:DCM). Scan rate 50
mV/s.
The electropolymerization of M2 was carried out using CV (Figure 2). The oxidation peak of the M2 appeared at 1.05 V and its reduction at 1.3 V, with the corresponding peaks of the polymer at 0.8 V (oxidation) and at 0.45 V
(reduction). A turquoise coloured film deposited onto ITO could be observed already from the 2nd scan.
Fig 2. Cyclic voltammograms (vs. Ag/AgCl) during the electropolymerization of M2 on ITO electrode (solution: 1 mM of monomer in 0.1 M TBABF4 solvent: 1:1 v/v MeCN:DCM). Scan rate 50
mV/s.
3.2 Morphology of the films
Figure 3 shows the SEM and AFM of the P1 and P2 films onto ITO (deposited by CV after 5 scans). Prior to the investigation, the films were neutralized. The thickness of the films was estimated by SEM as 670 and 500 nm, respectively. Both polymers appear to be compact, with P2 looking more compact and homogeneous than P1. Additionally, P2 had a globular and P1 a spaghetti- like structure, in all probability due to different crystalline unit cells. From the AFM measurements the average surface roughness was estimated as 82 nm for P1 and only as low as 0.9 nm for P2. The higher roughness of P1 can be attributed to the abrupt growth of the film (as witnessed by the corresponding CVs in Figure 1).
3.3 Electrochemical behaviour of the polymer films
The reversibility of the doping/dedoping process is an important aspect for the actual application of a CP as EC material; it is investigated by CV scans of an already deposited film in a monomer free solution at different scan rates. Figure 4 shows the reversibility of P2 film deposited onto ITO (after 5 scans). The redox couple due to oxidation and reduction of the polymer can be observed as a (broad) double peak at around 0.80 V and 1.0 V (oxidation) and as single peak at 0.50 V (reduction). The appearance of the double peak probably is an indication of a wide molecular weight distribution for the polymer.
(a)
(b) P1
(c)
(d) P2
Fig 3. SEM (a, c) and AFM (b, d) photos of the P1 and P2 films onto ITO (deposited by CV after 5 scans and then neutralized at -0.3 V for 2 min).
Fig 4. Cyclic voltammetry curves of the P2 polymer ready film on ITO electrode at different scan rates between 25 mV/s and 300 mV/s. A monomer-free solution of 0.1 M TBABF4 in acetonitrile was used. The
ready film had synthesized by scanning the potential from 0 to 1.5 V, scan rate 50 mV/s, for 5 scans, on ITO electrode.
Figure 5 shows that the current of both the anodic and the cathodic peaks depends linearly on the scan rate. Given that the position of the peaks is not affected by the scan rate, it can be deduced that the electrochemical process of doping/dedoping is reversible and not diffusion limited (at least in the region of scan rates studied) [8,9,16]. Similar investigation for a P1 film also proved the doping/dedoping reversibility for that polymer (with oxidation at 0.8 V and reduction at 0.65 V a linear relationship was observed up to 175 mV/s).
Fig 5. Scan rate dependence of current of the anodic (0.8 and 1.0 V) and the cathodic (0.5 V) peak.
3.4 Optical and electrochemical properties
Figure 6 presents the UV-Vis spectra of the P1 and P2 films deposited onto ITO (after 5 scans). P1 exhibits two absorption bands at 445 nm and at 565 nm; similarly, P2 exhibits two absorption bands at 430 nm and a broad one between 540 and 940 nm (centered at 755 nm). Thus, changing the acceptor unit from fluorene to benzothiadiazole caused a bathochromic shift. This effect could be attributed to the the difference in electron affinity of the two moieties; namely, benzodiathiazole is more electronegative than the fluorene moiety. From the onset of the first absorption peak, the energy gap was estimated as 1.43 eV for P1; a similar polymer as P1 (albeit without the octyl chains on the fluorene) was reported to have a band gap of 1.96 eV [13]. Similarly, P2 has energy gap of 1.22 eV with close values also reported in the literature [14, 17].
Fig 6. UV-Vis spectrum of the undoped polymer films P1 and P2 deposited on ITO electrode (synthesized by CV after 5 scans).
The HOMO and LUMO energy levels were additionally estimated using cyclic voltammetry [18]. A film deposited onto a Pt plate (synthesized by CV after 5 scans and then neutralized in a monomer free solution) underwent scans in a monomer free solution with a slow scan rate (20 mV/s). During the anodic sweep a peak was observed at 0.8 V for P1 and at 0.7 V for P2, attributable to the p-doping of the respective polymers; the values of HOMO were estimated as EHOMO= - 5.6 eV for P1 and EHOMO= - 5.5 eV for P2. In the n-doping scan there was not clear peaks, therefore the LUMO levels were calculated indirectly using the optical band gap; the values were ELUMO = - 4.2 eV for P1 and as ELUMO = - 4.3 eV for P2. Thus, the acceptor unit affects the band gap of the CP; namely, it is smaller on P2 than on P1. A similar trend has been reported in the literature [9, 19], i.e. that the electron-rich (such as the benzothiadiazole) or electron deficient
groups on the polymer backbone increase the
delocalization of the π-electrons and hence decrease the band gap.
3.5 Electrochromic (EC) properties
The EC properties were studied through spectroelectrochemistry. Polymer films already deposited onto ITO were used as working electrodes and underwent a stepwise potential scan in a monomer free solution. Starting form 0 V, the potential gradually increased (or decreased) and was kept constant for some time at the desired potential during which the UV-Vis spectra was recorded. The in situ UV-Vis spectrum for P1 is presented in Figure 7. As it was already mentioned, P1 at 0 V has two bands, i.e. at 450 nm and at 565 nm. As the applied potential increased, the first band shifted to lower wavelengths (at 365 nm) and its absorbance increased; at the same time, the absorbance of the second band also increased. At potentials above 1.2 V the first absorption band almost disappeared, the absorbance of the second band (at 570 nm) decreased and a new broad band appears in the IR region (at around 975 nm), attributed to the doping of the polymer (i.e. due to the charge carriers formed from the oxidation). Starting from the neutral state and going to negative potentials (dedoping process) the absorbance at 450 nm increased and that at 565 nm decreased, disappearing at potentials lower than -0.4 V.
Fig 7. Spectroelectrochemical measurements of film P1 deposited onto ITO (CV, after 5 scans) in the neutral and oxidized states at several potential from -0.6 to 1.6 Volts (in ACN + 0.1 M TBABF4 solution).
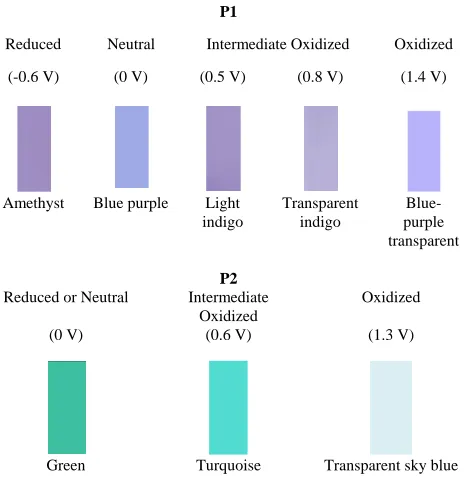
All these spectral changes were also visible with the naked eye. The colour changes versus the applied potential are presented in Figure 8. The film was blue-purple in the neutral state, changing to light indigo, transparent indigo and transparent blue-purple when oxidized and the colour of amethyst when it was reduced. In comparison with
similar polymer with fluerene acceptor moieties (without alkyl side chains) the colour chances are different due to the additional effect of the octyl side chains [15].
The in situ UV-Vis spectra for P2 were also recorded. Initially (at 0 V), P2 had the two absorption bands at 430 nm and at 755 nm. As the applied potential increased, the absorption of both two bands decreased and at 0.5 V they had almost disappeared, with a new absorption band in the IR region (at around 1100 nm) starting to be presented. This behaviour has been also reported in the literature [17]. At even higher potentials (above 1.5 V) only the band at 1100 nm appeared. Again the colour changes were visible with the naked eye and the different colours during the potential changes for the P2 are also presented in Figure 8.
P1
Reduced Neutral Intermediate Oxidized Oxidized (-0.6 V) (0 V) (0.5 V) (0.8 V) (1.4 V)
Amethyst Blue purple Light indigo
Transparent indigo
Blue-purple transparent
P2
Reduced or Neutral Intermediate Oxidized
Oxidized (0 V) (0.6 V) (1.3 V)
Green Turquoise Transparent sky blue
Fig 8. Different colours observed (through the naked eye) versus applied potential for the different electronic states of P1 and P2 films deposited
onto ITO electrodes.
3.6 Electrochemical stability of the polymer films
The stability of the EC polymer films during repetitive potential switchings between oxidized and neutral states is also very important for their application. In order to estimate the stability, polymer films on ITO electrodes underwent repetitive fast scans in a monomer free solution from -1 V to 1.5 V. The charge involved during the doping-dedoping process was calculated for each scan. After 500 scans the total charge loss was 17 % for P1 and
only 2 % for P2. The value of P1 is relative high, but that of P2 is very good. Even though higher values have been reported in the literature for P2 [17], it concerned films deposited onto Pt electrodes rather than ITO: the former is a considerably better substrate for the electrochemical deposition of films than the latter, thus the difference in the stability was not unexpected.
3.7 Electrochromic devices (ECDs)
- Single layer ECDs
The EC polymer layer (P1 or P2) was deposited onto ITO by CV (3 scans) using the above metioned conditions. The single layer ECDs of the two polymers are shown in Figure 9. The initial colour of ECD1 (from P1) was royal blue, whereas that of ECD2 (from P2) was green. The former switched from light transparent purple (dedoped state) to blue- purple transparent (doped state). After some repetitive potential sweeps P1 started to interact with the electrolyte and the glue, leading to deterioration of the device performance. ECD2 switched successfully its colour between green (dedoped state), sky blue and transparent sky blue (doped states) depending on the applied potential, Figure 10.
ECD1 ECD2
Fig 9. Photos of ECD1 and ECD2.
In order to further study the behaviour of the ECD2, repeated potential pulses between a doping potential (+2V) and a dedoping one (-1 V) were applied. The corresponding current-time curves (for the first 4 sweeps) are presented in Figure 11. A constant response is observed, indicating a good stability of the device. The response time for the doping is 15 sec and for the dedoping is 10 sec. After exposing the device in the laboratory environment for 3 weeks the stepwise sweep experiments were repeated and the value of the current had not been affected, an indication of the device stability.
Green sky blue transparent sky blue
-1.0 -0.5 0.0 0.5 1.0 1.5 2.0 -1.5x10⁻⁴
-1.0x10⁻⁴
-5.0x10⁻⁵
0.0 5.0x10⁻⁵
1.0x10⁻⁴
1.5x10⁻⁴
C
urrent
(A
)
Potential (V)
Fig 10. Cyclic voltammogram of ECD2, from -1.5 V to 2.0 V, scan rate
100 mV/s and the colour changes of the device on different potential.
0 500 1000 1500 2000 2500
-1 0 1 2
P
ot
ent
ial
(V
)
Time (sec)
0 500 1000 1500 2000 2500
-2.0x10⁻⁴
0.0
2.0x10⁻⁴
C
urrent
(A
)
Time (sec)
Fig 11. Current/ time response of ECD2 during repeated potential pulses
between + 2V and -1 V.
The in-situ UV-Vis spectra of the ECD2 showed the same bahaviour like the initial P2 film. Thus, in the neutral state (i.e. at 0 V) the ECD was light green and it had two
absorption bands (425 nm and 752 nm). In the doped state (i.e. at +2 V) the device is transparent sky blue exhibiting only one absorption band at 1015 nm. In the dedoped state (i.e. at -1 V) ECD2 is green but it has also two absorption bands as in neutral state. In Figure 12 the colours of the device in dedoped and doped state are presented.
Dedoped state (-1 V) Doped state (+1.5 V)
Fig 12. Colour change of ECD2 (see supplementary file).
The electrochemical stability of ECD2 was also
investigated by repetitive potential switching. The device underwent CV scan in the potential region -0.3 to +2 V with a scan rate of 500 mV/s. A charge loss of 20 % was observed after the first 5 scans and then only a 5 % until the 50th scan. This means that the device is quite stable, but its stability should be further improved for large scale applications. Summarizing, the single layer ECD2 exhibited promising features, however it had only one colour change (apart from various in-between hues).
- Dual layer ECDs
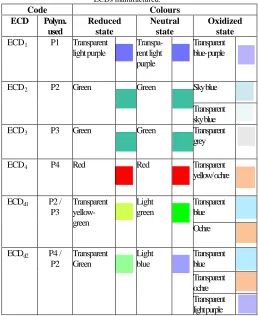
In order to obtain more colours (hence, a real multicoloured device), dual layer ECDs were constructed based on P2 films combined with films P3 or P4 deposited onto ITO by CV. In ECDd1 a layer of P2 was used as cathode and one of P3 as anode, whereas in ECDd2 a P4 layer was used as cathode and one of P2 as anode. Prior assembling the devices, the corresponding cathode electrodes were fully reduced (synthesized by CV between 0 to 1.5 V, with 50 mV/s, after 3 scans, followed by dedoping of the films at -1 V for 2 min) while the anode electrodes were fully oxidized (synthesized by potentiostatically at 1.1 V for 180 sec). The initial colour of ECDd1 was forest green and that of ECDd2 green transparent. The colour changes of all the ECDs constructed are presented in Table 1, where also the colour changes of the respective single layer ECDs are also shown. It is clear that the dual layer ECDs have achieved almost full coverage of the optical spectrum since they produce both red, green and blue hues (the necessary prerequisite for achieving all the other colours).
In Figure 13 the CV of the dual layer ECDs in comparison to the single layer ECD2 are shown. It is clear that dual layer ECDs had much higher active charge (i.e. area
encompassed inside the CV) than ECD2, indicating that the dual layer ECDs were considerably more efficient. The in-situ UV-Vis spectra for the dual ECDd2 are presented in Figure 14. At low potentials there are three absorption bands, at around 450, 550 and 750 nm. During the progressive oxidation of the ECD, the absorption bands at 450 and 750 gradually disappear, but that at 550 nm does not diminish considerably; at the same time an absorption band in appears the IR region (centered at around 1050 nm), that increases gradually (becoming more prominent above +1.4 V).
Table 1. Colours and colour changes versus the electronic states of the ECDs manufactured.
Code Colours
ECD Polym. used
Reduced state
Neutral state
Oxidized state
ECD1 P1 Transparent
light purple
Transpa-rent light purple
Transparent blue- purple
ECD2 P2 Green Green Sky blue
Transparent sky blue ECD3 P3 Green Green Transparent
grey
ECD4 P4 Red Red Transparent
yellow/ ochre
ECDd1 P2 /
P3
Transparent yellow-green
Light green
Transparent blue
Ochre
ECDd2 P4 /
P2
Transparent Green
Light blue
Transparent blue Transparent ochre Transparent light purple
Using repetitive potential pulses between +2 V and -1 V the response time for both the dual layer ECDs was determined as 7 sec (during both doping and dedoping processes). These values are about half that of the single layer ECD2. The reason for this is not clear, but it could be possibly attributed to the charge transfer between the two EC polymer layers being faster than between the EC polymer in the anode and the ITO of the cathode. However, it should be noticed that this is a great improvement over the single layer ECDs and it is very important for the application of the dual layer devices.
-2 -1 0 1 2 3
-6.0x10⁻⁴
-3.0x10⁻⁴
0.0 3.0x10⁻⁴
6.0x10⁻⁴
9.0x10⁻⁴
1.2x10⁻³
Dual ECDd2 (10 mV/s
C
ur
rent
(
A
)
Potential (V)
Dual ECDd1 (20 mV/s)
ECD2 (100 mV/s)
Fig 13. CVs of the single layer ECD2 and the dual layer ECDd1 and
ECDd2 (active surface of the devices : 2.5 cm2).
Fig 14. Spectroelectrochemical measurements of the dual layer ECDd2.
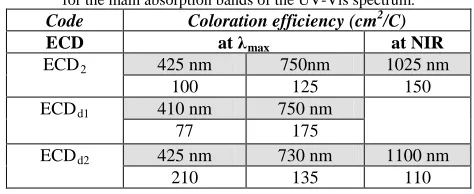
The performance of the ECDs was additionally evaluated using their coloration efficiency (CE). CE is a measure of the consumed current with respect to the colour change of the device and is calculated as: CE = OD/Qd, where OD = log(Tcolored/Tbleached) (T: transmittance of the film) and Qd is the injected (or ejected) charge between the neutral and oxidized states of the device. Table 2 shows the values of the CE for the ECD2 and the dual layer ECDs calculated for the respective main absorption bands. Again, the dual layer ECDs have higher CE values than the single layer ECD, which is advantageous for their application. Given that, apart from the wider colour spectrum they afford, dual layer ECDs additionally have better active charge, response time and CE than the single layer ECDs, it is clear that the former are a large improvement over the latter.
Table 2. Colouration efficiency (CE) of the single- and dual- layer ECDs for the main absorption bands of the UV-Vis spectrum.
Code Coloration efficiency (cm2/C)
ECD at λmax at NIR
ECD2 425 nm 750nm 1025 nm
100 125 150
ECDd1 410 nm 750 nm
77 175
ECDd2 425 nm 730 nm 1100 nm
210 135 110
4. Conclusions
The application in dual layer ECDs of thiophene-based copolymers was investigated. Monomers having D-A-D structures were synthesized and their electropolymerization under CV conditions afforded uniform polymer films directly deposited onto ITO electrodes. The optical properties and the energy levels (HOMO, LUMO) of the polymer films depended on the acceptor moiety; specifically, the replacement of the fluorene unit with benzothiadiazole caused a bathochromic shift and a shift of the HOMO and LUMO to less negative values. The dual layer ECDs that were constructed exhibited genuine multicoloured behavior, having hues of the three basic colours (red, green and blue); simultaneously, the dual layer ECDs had better electrochemical activity, response time and colouration efficiency that the corresponding single layer devices. These initial results of multicoloured devices reveal their prospects; however, further development is necessary in order to optimize their operational characteristics.
Acknowledgments
This research is a part of the NEMEDES project which is funded by the European Commission in the framework of a Marie Curie Scholarship (Fellow : Dr. Despina Triantou), FP7-PEOPLE-2011-IEF, Marie Curie Actions, Intra-European Fellowships (IEF),
http://www.iap.fraunhofer.de/de/Forschungsbereiche/Funk tionale_Polymersysteme/polymere_und_elektronik/elektro aktive_polymere1.html
The authors would like to thank Prof. Carmen Simona Asaftei for providing the device of the in- situ spectroelectrochemical measurements and her useful comments, Mr. Marius Ciobanou for kindly helping during these measurements, Mr. Bjon Grueber for the AFM measurements and Mrs. Tatjiana Egorov-Brening for the construction of the ECDs.
References
[1] P.M.S. Monk, R.J. Mortimer and D.R. Rosseinsky, “Conjugated conducting polymers”. In Electrochromism and Electrochromic Devices, Cambridge: Cambridge University Press, 2007.
[2] G. Sonmez, “Polymeric electrochromics”, Chem. Commun., 42, 2005, pp. 5251–5259,
[3] P.M. Beaujuge, S. Ellinger and J.R. Reynolds, “The donor– acceptor approach allows a black-to-transmissive switching polymeric electrochrome”, Nat. Mat. 7, 2008, pp. 795-799. [4] A. Pawlicka, “Development of Electrochromic Devices”,
Rec. Pat. Nanotechnol. 3, 2009, pp. 177-181.
[5] I. Yagmur, M. Ak and A. Bayrakceken, “Fabricating multicolored electrochromic devices using conducting copolymers”, Smart Mater. Struct. 22, 2013, 115022..
[6] P. Ledwon, A. Brzeczek, S. Pluczyk, T. Jarosz, W. Kuznika, K. Walczak and M. Lapkowskia, “Synthesis and electrochemical properties of novel, donor–acceptor pyrrole derivatives with 1,8-naphthalimide units and their polymers”, Electrochim. Acta, 128, 2014, pp. 420-429.
[7] M. Sendur, A. Balan, D. Baran, B. Karabay and L. Toppare, “Combination of donor characters in a donor–acceptor–donor (DAD) type polymer containing benzothiadiazole as the acceptor unit”, Org. Electron., 11, 2010, pp. 1877–1885. [8] D. Triantou, C.S. Asaftei, S. Soulis, A. Skarmoutsou, E.
Milioni, C. Charitidis and S. Janietz, “Synthesis and characterization of electrochromic films based on 2, 5-bis (2-(3, 4-ethylenedioxy)thienyl)pyridine”, Int. J. Electrochem. Sci., 10, 2015, pp. 1274 – 1291.
[9] D. Triantou, S. Soulis, C.S. Asaftei and S. Janietz, “Effect of the acceptor moiety on the electrochemical and electrochromic properties of Donor-Acceptor-Donor polymer films”, Int. J. Electrochem. Sci., 10, 2015, pp. 3458-3477. [10] K. Zhang, B. Tieke, J.C. Forgie, F. Vilela and P.J. Skabara,
“Donor–Acceptor Conjugated Polymers Based on p- and o-Benzodifuranone and Thiophene Derivatives: Electrochemical Preparation and Optical and Electronic Properties”, Macromolecules, 45, 2012, pp. 743−750. [11] T.Y. Chiang, M.C. Huang and C.H. Tsai, “The reversibility
of ionic transport in PEDOT with application to a complementary electrochromic device”, Appl. Surf. Sci., 308, 2014, pp. 93-300.
[12] A.S. Shaplov, D.O. Ponkratov, P.H. Aubert, E.I. Lozinskaya, C. Plesse, F. Vidal and Y.S. Vygodskii, “A first truly all-solid state organic electrochromic device based on polymeric ionic liquids”, Chem. Commun., 50, 2014, pp. 3191-3193. [13] G. Nie, H. Yang, J. Chen and Z Bai, A novel high-quality
electrochromic material from 3,4-ethylenedioxythiophene bis-substituted fluorine, Org. Electron., 13, 2012, pp. 2167– 2176.
[14] M. Sendur, A. Balan, D. Baran, B. Karabay and L. Toppare, “Combination of donor characters in a donor–acceptor–donor (DAD) type polymer containing benzothiadiazole as the acceptor unit”, Org. Electron., 11, 2010, pp. 1877–1885. [15] C. Wang, J.L. Schindler, C.R. Kannewurf and M.G.
Kanatzidis, “Poly(3,4-ethylenedithiathiophene). A New Soluble Conductive Polythiophene Derivative”, Chem. Mater., 7, 1995, pp. 58-68.
[16] U. Abaci, H. Yuksel Guney and U. Kadiroglu, “Morphological and electrochemical properties of PPy, PAni bilayer films and enhanced stability of their electrochromic devices (PPy/PAni–PEDOT, PAni/PPy–PEDOT)”, Electroch. Acta, 96, 2013, pp. 214-224.
[17] A. Durmus, G.E. Gunbas, P. Camurlu and L. Toppare. “A neutral state green polymer with a superior transmissive light blue”, Chem. Commun., 48, 2007, pp. 3246–3248
[18] S. Admassie, O. Inganas, W. Mammo, E. Perzon and MR. Andersson, “Electrochemical and optical studies of the band gaps of alternating polyfluorene copolymers”, Synth. Met., 156, 2006, pp. 614-623.
[19] W.T. Neo, L.M. Loo, J. Song, X. Wang, X.M. Cho, H.S On Chan, Y. Zong and J. Xu, “Solution-processable blue-to-transmissive electrochromic benzotriazole-containing conjugated polymers”, Polym. Chem., 4, 2013, pp. 4663-4675.
Despina Triantou is Dr. Chemical Engineer (2008) from National Technical University of Athens (NTUA). She worked as a Post-Doctoral researcher in NTUA (2008-2011) and as Marie Curie Fellow at Fraunhofer IAP (from 2013). Up to now, her research has produced 14 publications in scientific journals, 3 chapters in books and more than 40 presentations in scientific conferences. Her research interests are electrochromic materials, conducting polymers, electropolymerization, as well as polycondensation.
Spyridon Soulis is Dr. Chemical Engineer (2005) from National Technical University of Athens (NTUA). He works as a Post-Doctoral researcher in NTUA (from 2005) and in Helmholtz Center of Berlin (2013-15).
Silvia Janietz is Dr. Chemist (1987) from Martin-Luther-University Halle. She is Head of Deportment “Polymer and Electronics” in Fraunhofer IAP (from 2000) and Lecturer at the University of Potsdam (from 2004).