Real Time Implementation and Performance
Analysis of a PID and a Fuzzy Controller for a
Linear Process using LabVIEW
Rishi Raj Saikia
1, Ramesh H.R.
2PG Scholar (C&I), Dept. of EE, UVCE, Bangalore, Karnataka, India1
Associate professor, Dept. of EE, UVCE, Bangalore, Karnataka, India2
ABSTRACT: This paper proposes two different methods of water level control in case of a linear tank. The methods are being a conventional PID controller and a fuzzy controller. The defuzzification method used is Mamdani method. The flow controlling element used here is a feed-pump. Both the Fuzzy and PID controller are implemented using LabVIEW and arduino Mega2560. Finally the performances of both the control schemes are evaluated regarding IAE, ISE, rise time and peak time.
KEYWORDS: PID, FUZZY, LabVIEW, arduino mega2560, Mamdani, IAE, ISE, rise time, peak time.
I.INTRODUCTION
Around 80% of control loops in industries are PID or a variant of PID. Although gain scheduling, cascade and fractional order PIDs shows a better response regarding steady state error suppression and transient response, the PID loops still suffer from the disadvantage of tuning. Tuning a PID for zero residual error is a highly precise work and there are various methods of tuning available of which each method is quite different. With the wear and tear of the actuators non linearity is introduced into the system which again leads to periodic tuning of PID loops which is a cumbersome and costly practice.
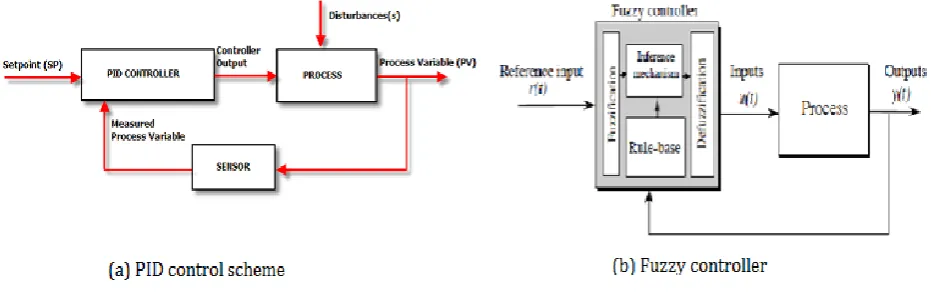
Fig. 1 (a) a PID scheme & (b) a Fuzzy control scheme
A fuzzy controller on the other hand uses human like intuition and hence gives a better response. A fuzzy controller is a model less design hence it can be tuned with the knowledge of input and output variations.
ISSN (Print) : 2320 – 3765 ISSN (Online): 2278 – 8875
I
nternational
J
ournal of
A
dvanced
R
esearch in
E
lectrical,
E
lectronics and
I
nstrumentation
E
ngineering
(An ISO 3297: 2007 Certified Organization) Vol. 5, Issue 5, May 2016
II.SYSTEM SETUP
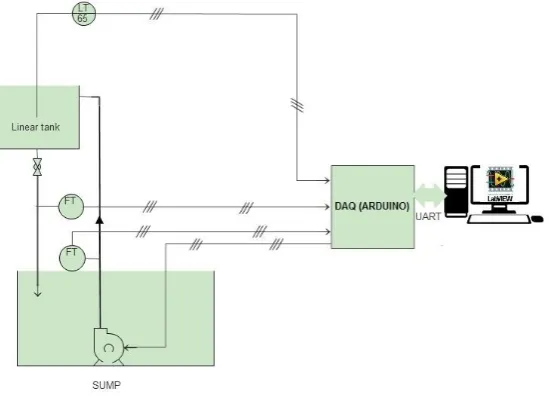
The setup used for level control has following hardware components:
Sump: The Sump is made up of transparent acrylic and also contains a submersible water pump as an actuator. The dimensions of the tank are 24.5cmx19.5cmx34.5cm.
Process Tank: The upper process tank is of dimension 14.5cmx14.5cmx29.4cm and is made up of transparent acrylic.
Level sensor(Ultrasonic):In this setup a HC-SR04 distance sensor is used to measure the depth. It uses +5V DC with effectual Angle <15° and a ranging distance of 2cm to 400 cm
Flow Sensor (YF-S201):Hall Effect turbine type sensor with Max flow rate: 8-9 ltr/min, min. flow rate: 2 ltr/min with frequency range from 16 Hz to 65 Hz respectively. Error range +10% to -10%
Pump: 0-12V submersible DC motor with flow rate of 2ltr/min to 20ltr/min.
Arduino Mega 2560 for data acquisition
Software toolkits: makerhub Linx, arduino ide and LabVIEW Fuzzy and PID toolkit
Fig. 2 System block diagram
III.SYSTEM MODELLING
The trainer system is a FOPTD model which is a single tank level control system. The model is developed on mass-balance principle.
Process: It is the change in level in the process tank with inflow rate (qi) where the manipulated parameter being inflow and output parameter is level.
Tank: The governing equation for the change in liquid volume is given by the following equation: Rate of change of volume of liquid = inflow (qi) – outflow (qo)
So, if qi becomes equal to the qo then there would be no change in the volume of liquid which is obtained by the tank. dy/dt = qi(t) –qo (t) (1)
Where qi-inflow, qo-outflow
To find out T (time constant) and R (resistance to the outflow) we assume the following Assumptions:
1. The cross-sectional area of the tank is constant that is A= 210.25 cm2
2. The outflow of the liquid is proportional to the height of liquid: qo (t) = h (t)/R
Fig. 3 Step response curve for a controller output change of 30%
The estimated transfer function of the process from the response curve is as follows.
𝐻(𝑠) 𝑄(𝑠)=
0.63 1 + 118𝑠𝑒
−2𝑠
IV. FUZZY SYSTEM DESIGNING
The Fuzzy system is designed using Fuzzy system designer in LabVIEW with error (𝑒 𝑡 ) and rate of error (𝑒 (𝑡)) as the linguistic input variables and the PWM duty cycle as the output variable and named as PWM.
Input:
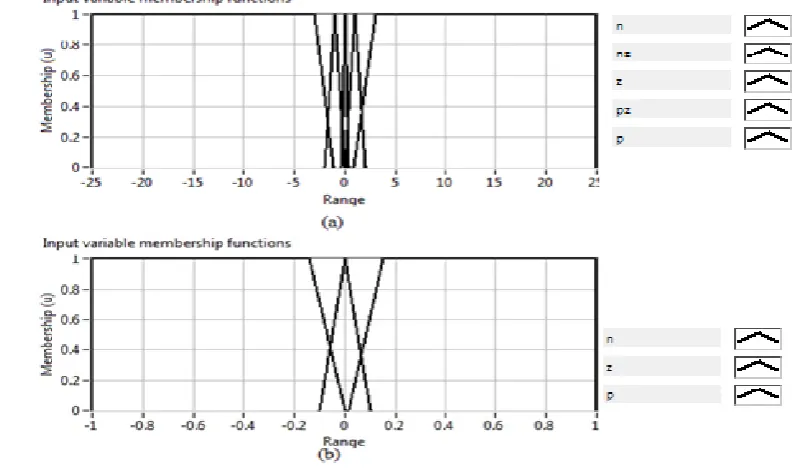
Error (𝑒 𝑡 ) is subdivided into five sets Negative(n), Negative Zero(nz), Zero(z), Positive Zero(pz), Positive(p). The rate of error (𝑒 (𝑡)) is subdivided into three subsets namely Negative (n), Zero (z), Positive (p).
The membership function of each input is shown below
ISSN (Print) : 2320 – 3765 ISSN (Online): 2278 – 8875
I
nternational
J
ournal of
A
dvanced
R
esearch in
E
lectrical,
E
lectronics and
I
nstrumentation
E
ngineering
(An ISO 3297: 2007 Certified Organization) Vol. 5, Issue 5, May 2016
Output:
Variable PWM is subdivided into five subsets as very less, less, medium, high, very high.
Fig. 5 Output membership function (PWM)
The rule base for output is shown in the following table. The premise is determined by minimum operator.
𝒆 𝒕
𝒆
(
𝒕)
n
nz
Z
pz
p
n
very less
less
medium
high
very high
z
very less
less
medium
high
very high
p
very less
very less
medium
high
very high
Table. 1 The rule base
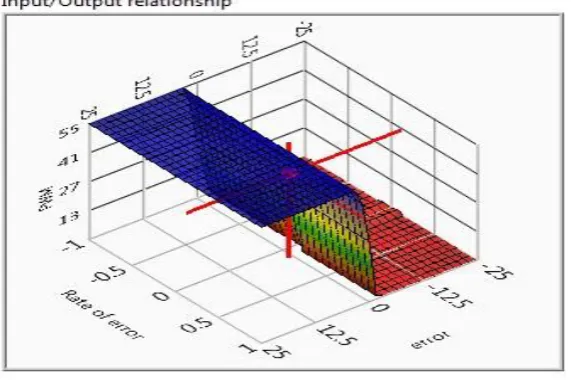
The defuzzification method used is centre of area method. The output function plot with system inputs is shown below.
Fig. 6 Antecedent and Consequent relationship
V. IMPLEMENTATION
Both the controllers are implemented using an Input subVI and an Output subVI. The only difference in between the both scheme is the use of control scheme.
Linear sensor (Input subVI): This VI measures the level of the water using the HC-SR04 ultrasonic sensor.
Fig. 6 (a) Linear Sensor and (b) Pump
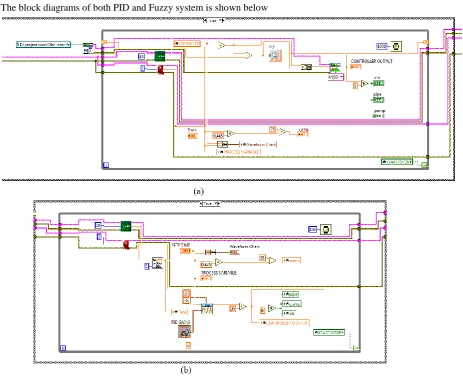
The block diagrams of both PID and Fuzzy system is shown below
Fig. 7 (a) Fuzzy control scheme and (b) PID control scheme
VI. RESULT AND DISCUSSION
ISSN (Print) : 2320 – 3765 ISSN (Online): 2278 – 8875
I
nternational
J
ournal of
A
dvanced
R
esearch in
E
lectrical,
E
lectronics and
I
nstrumentation
E
ngineering
(An ISO 3297: 2007 Certified Organization) Vol. 5, Issue 5, May 2016
The method used for tuning the PID is Cohen and Coon process reaction method. The Set point tracking is done for both the controllers and IAE and ISE is found for both the controllers.
Fig. 8 Set point tracking of (a) Fuzzy controller and (b) PID controller
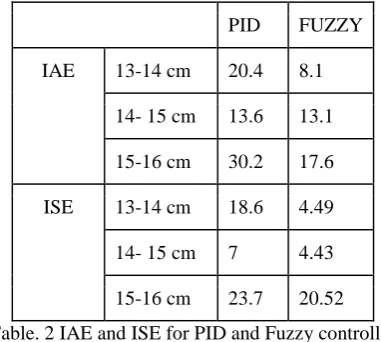
A step change in set point is made to both the controllers and for set point changes from 13-14cms, 14-15cms and 15-16cms and the following results are found.
PID FUZZY
IAE 13-14 cm 20.4 8.1
14- 15 cm 13.6 13.1
15-16 cm 30.2 17.6
ISE 13-14 cm 18.6 4.49
14- 15 cm 7 4.43
15-16 cm 23.7 20.52
Table. 2 IAE and ISE for PID and Fuzzy controller
The maximum IAE for PID is found to be 30.2 whereas for Fuzzy its 17.6. Similarly the maximum ISE for Fuzzy controller is found out to be 20.52 compared to 23.7 for PID scheme.
Parameters PID Fuzzy
Settling time 1% error band(in sec) 40 28
Peak Time (in sec) 28 20
Rise Time (90%) (in sec) 25 19
Table. 3 Transient performances of PID and Fuzzy controller
Percentage peak overshoot is nil for a Fuzzy controller.
VII. CONCLUSION
The results show that a Fuzzy controller shows a better performance in comparison to a conventional PID controller. In case of a large error suppression the Fuzzy controller is a better choice which is evident from low ISE. In situations demanding zero or very less overshoot Fuzzy controller is a better option. Moreover Fuzzy is also able to handle non linearity introduced in a process with actuator wear and tear.
REFERENCES
[1] Asst. Prof. Mrs. Deepa Shivshant Bhandarel and Dr. Prof. Mrs. N. R.Kulkarni “ Performances Evaluation and Comparison of PID Controller and Fuzzy Logic Controller for Process Liquid Level control”, 15th International Conference on Control, Automation and Systems
[2] Laith Abed Sabri, Hussein Ahmed AL-Mshat “Implementation of Fuzzy and PID Controller to Water Level System using LabVIEW” International Journal of Computer Applications (0975 – 8887).
[3] Dharamniwas, Aziz Ahmad, Varun Redhu and Umesh Gupta “Liquid level control by using fuzzy logic controller” IJAET, ISSN: 2231-1963. [4] “LabVIEW PID and Fuzzy Logic Toolkit User Manual by National Instrument”, 2009.
[5] Kevin M. Passino and Stephen Yurkovich “Fuzzy Control”.