Development of an automatic trend exploration system
using the MuST data collection
Masaki Murata1 [email protected]
Qing Ma3,1
Toshiyuki Kanamaru1,4 1[email protected]
Hitoshi Isahara1 [email protected] 1National Institute of Information and Communications Technology 3-5 Hikaridai, Seika-cho, Soraku-gun,
Kyoto 619-0289, Japan 3Ryukoku University Otsu, Shiga, 520-2194, Japan
Koji Ichii2
Tamotsu Shirado1 [email protected]
Sachiyo Tsukawaki1 [email protected]
2Hiroshima University
1-4-1 Kagamiyama, Higashi-hiroshima, Hiroshima 739-8527, Japan
4Kyoto University
Yoshida-nihonmatsu-cho, Sakyo-ku, Kyoto, 606-8501, Japan
Abstract
The automatic extraction of trend informa-tion from text documents such as news-paper articles would be useful for explor-ing and examinexplor-ing trends. To enable this, we used data sets provided by a workshop on multimodal summarization for trend in-formation (the MuST Workshop) to con-struct an automatic trend exploration sys-tem. This system first extracts units, tem-porals, and item expressions from news-paper articles, then it extracts sets of ex-pressions as trend information, and finally it arranges the sets and displays them in graphs. For example, when documents concerning the politics are given, the sys-tem extracts “%” and “Cabinet approval rating” as a unit and an item expression in-cluding temporal expressions. It next ex-tracts values related to “%”. Finally, it makes a graph where temporal expressions are used for the horizontal axis and the value of percentage is shown on the ver-tical axis. This graph indicates the trend of Cabinet approval rating and is useful for investigating Cabinet approval rating. Graphs are obviously easy to recognize and useful for understanding information described in documents. In experiments, when we judged the extraction of a correct
graph as the top output to be correct, the system accuracy was 0.2500 in evaluation A and 0.3334 in evaluation B. (In evalua-tion A, a graph where 75% or more of the points were correct was judged to be cor-rect; in evaluation B, a graph where 50% or more of the points were correct was judged to be correct.) When we judged the extraction of a correct graph in the top five outputs to be correct, accuracy rose to 0.4167 in evaluation A and 0.6250 in eval-uation B. Our system is convenient and ef-fective because it can output a graph that includes trend information at these levels of accuracy when given only a set of doc-uments as input.
1 Introduction
We have studied ways to automatically extract trend information from text documents, such as newspaper articles, because such a capability will be useful for exploring and examining trends. In this work, we used data sets provided by a work-shop on multimodal summarization for trend in-formation (the MuST Workshop) to construct an automatic trend exploration system. This system firsts extract units, temporals, and item expres-sions from newspaper articles, then it extract sets of expressions as trend information, and finally it arranges the sets and displays them in graphs. For example, when documents concerning the politics
are given, the system extracts “%” and “Cabinet approval rating” as a unit and an item expression including temporal expressions. It next extracts values related to “%”. Finally, it makes a graph where temporal expressions are used for the hor-izontal axis and the value of percentage is shown on the vertical axis. This graph indicates the trend of Cabinet approval rating and is useful for inves-tigating Cabinet approval rating. Graphs are obvi-ously easy to recognize and useful for understand-ing information described in documents.
2 The MuST Workshop
Kato et al. organized the workshop on multimodal summarization for trend information (the MuST Workshop) (Kato et al., 2005). In this work-shop, participants were given data sets consisting of newspaper documents (editions of the Mainichi newspaper from 1998 and 1999 (Japanese docu-ments)) that included trend information for vari-ous domains. In the data, tags for important ex-pressions (e.g. temporals, numerical exex-pressions, and item expressions) were tagged manually.1The 20 topics of the data sets (e.g., the 1998 home-run race to break the all-time Major League record, the approval rating for the Japanese Cabinet, and news on typhoons) were provided. Trend infor-mation was defined as inforinfor-mation regarding the change in a value for a certain item. A change in the number of home runs hit by a certain player or a change in the approval rating for the Cabinet are examples of trend information. In the workshop, participants could freely use the data sets for any study they chose to do.
3 System
3.1 Structure of the system
Our automatic trend exploration system consists of the following components.
1. Component to extract important expressions
First, documents related to a certain topic are given to the system, which then extracts im-portant expressions that will be used to ex-tract and merge trend information. The sys-tem extracts isys-tem units, sys-temporal units, and item expressions as important expressions.
1We do not use manually provided tags for important
ex-pressions because our system automatically extracts impor-tant expressions.
Here, important expressions are defined as expressions that play important roles in a given document set. Item expressions are de-fined as expressions that are strongly related to the content of a given document set.
1a. Component to extract important item units
The system extracts item units that will be used to extract and merge trend infor-mation.
For example, when documents concern-ing the home-run race are given, “hon” or “gou” (the Japanese item units for the number of home runs) such as in “54
hon” (54th home run) are extracted.
1b. Component to extract important tempo-ral units
The system extracts temporal units that will also be used to extract and merge trend information.
For example, the system extracts tempo-ral units such as “nichi” (day), “gatsu” (month), and “nen” (year). In Japanese, temporal units are used to express dates, such as in “2006 nen, 3 gatsu, 27 nichi” for March 27th, 2006.
1c. Component to extract important item expressions
The system extracts item expressions that will also be used to extract and merge trend information.
For example, the system extracts expres-sions that are objects for trend explo-ration, such as “McGwire” and “Sosa” as item expressions in the case of docu-ments concerning the home-run race.
2. Component to extract trend information sets
For example, in the case of documents con-cerning the home-run race, the system ex-tracts a set consisting of “item expression: McGwire”, “temporal expression: 11 day” (the 11th), and “numerical expression: 47
gou” (47th home run) as a trend information
set.
3. Component to extract and display important trend information sets
The system gathers the extracted trend infor-mation sets and displays them as graphs or by highlighting text displays.
For example, for documents concerning the home-run race, the system displays as graphs the extracted trend information sets for “McGwire” . In these graphs, temporal expressions are used for the horizontal axis and the number of home runs is shown on the vertical axis.
3.2 Component to extract important expressions
The system extracts important expressions that will be used to extract trend information sets. Im-portant expressions belong to one of the following categories.
• item units
• temporal units
• item expressions
We use ChaSen (Matsumoto et al., 1999), a Japanese morphological analyzer, to extract ex-pressions. Specifically, we use the parts of speeches in the ChaSen outputs to extract the ex-pressions.
The system extracts item units, temporal units, and item expressions by using manually con-structed rules using the parts of speeches. The system extracts a sequence of nouns adjacent to numerical values as item units. It then extracts expressions from among the item units which in-clude an expression regarding time or date (e.g., “year”, “month”, “day”, “hour”, or “second”) as temporal units. The system extracts a sequence of nouns as item expressions.
The system next extracts important item units, temporal units, and item expressions that play im-portant roles in the target documents.
The following three methods can be used to ex-tract important expressions. The system uses one of them. The system judges that an expression producing a high value from the following equa-tions is an important expression.
• Equation for the TF numerical term in Okapi (Robertson et al., 1994)
Score= i∈Docs
T Fi
T Fi+∆li (1)
• Use of total word frequency
Score= i∈Docs
T Fi (2)
• Use of total frequency of documents where a word appears
Score= i∈Docs
1 (3)
In these equations, i is the ID (identification number) of a document,Docsis a set of document IDs, T Fi is the occurrence number of an expres-sion in documenti, lis the length of documenti, and∆is the average length of documents inDocs. To extract item expressions, we also applied a method that uses the product of the occurrence number of an expression in document i and the length of the expression as T Fi, so that we could extract longer expressions.
3.3 Component to extract trend information sets
The system identifies the locations in sentences where a temporal unit, an item unit, and an item expression extracted by the component to extract important expressions appears in similar sentences and extracts sets of important expressions de-scribed by the sentences as a trend information set. When more than one trend information set appears in a document, the system extracts the one that appears first. This is because important and new things are often described in the beginning of a document in the case of newspaper articles.
3.4 Component to extract and display important trend information sets
are used for the horizontal axis and numerical ex-pressions are used for the vertical axis. The system also displays sentences used to extract trend infor-mation sets and highlights important expressions in the sentences.
The system extracts multiple item units, tempo-ral units, and item expressions (through the com-ponent to extract important expressions) and uses these to make all possible combinations of the three kinds of expression. The system extracts trend information sets for each combination and calculates the value of one of the following equa-tions for each combination. The system judges that the combination producing a higher value rep-resents more useful trend information. The fol-lowing four equations can be used for this purpose, and the system uses one of them.
• Method 1 — Use both the frequency of trend information sets and the scores of important expressions
M =F req×S1×S2×S3 (4)
• Method 2 — Use both the frequency of trend information sets and the scores of important expressions
M =F req×(S1×S2×S3)13 (5)
• Method 3 — Use the frequency of trend in-formation sets
M =F req (6)
• Method 4 — Use the scores of important ex-pressions
M =S1×S2×S3 (7)
In these equations,F reqis the number of trend information sets extracted as described in Section 3.3, andS1,S2, andS3are the values ofScoreas calculated by the corresponding equation in Sec-tion 3.2.
The system extracts the top five item units, the top five item expressions, and the top three tem-poral units through the component to extract im-portant expressions and forms all possible combi-nations of these (75 combicombi-nations). The system then calculates the value of the above equations for these 75 combinations and judges that a combina-tion having a larger value represents more useful trend information.
4 Experiments and Discussion
We describe some examples of the output of our system in Sections 4.1, 4.2, and 4.3, and the re-sults from our system evaluation in Section 4.4. We made experiments using Japanese newspaper articles.
4.1 Extracting important expressions
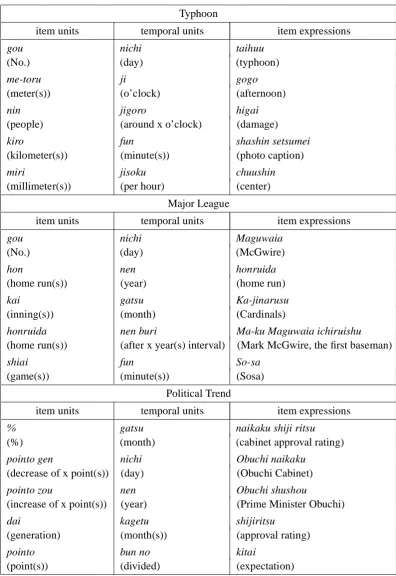
To extract important expressions we applied the equation for the TF numerical term in Okapi and the method using the product of the occurrence number for an expression and the length of the expression as T Fi for item expressions. We did experiments using the three document sets for ty-phoons, the Major Leagues, and political trends. The results are shown in Table 1.
We found that appropriate important expres-sions were extracted for each domain. For ex-ample, in the data set for typhoons, “typhoon” was extracted as an important item expression and an item unit “gou” (No.), indicating the ID num-ber of each typhoon, was extracted as an im-portant item unit. In the data set for the Major Leagues, the MuST data included documents de-scribing the home-run race between Mark McG-wire and Sammy Sosa in 1998. “McGMcG-wire” and “Sosa” were properly extracted among the higher ranks. “gou” (No.) and “hon” (home run(s)), im-portant item units for the home-run race, were properly extracted. In the data set for political trends, “naikaku shiji ritsu” (cabinet approval rat-ing) was properly extracted as an item expression and “%” was extracted as an item unit.
4.2 Graphs representing trend information
Table 1: Examples of extracting important expressions
Typhoon
item units temporal units item expressions
gou nichi taihuu
(No.) (day) (typhoon)
me-toru ji gogo
(meter(s)) (o’clock) (afternoon)
nin jigoro higai
(people) (around x o’clock) (damage)
kiro fun shashin setsumei
(kilometer(s)) (minute(s)) (photo caption)
miri jisoku chuushin
(millimeter(s)) (per hour) (center)
Major League
item units temporal units item expressions
gou nichi Maguwaia
(No.) (day) (McGwire)
hon nen honruida
(home run(s)) (year) (home run)
kai gatsu Ka-jinarusu
(inning(s)) (month) (Cardinals)
honruida nen buri Ma-ku Maguwaia ichiruishu
(home run(s)) (after x year(s) interval) (Mark McGwire, the first baseman)
shiai fun So-sa
(game(s)) (minute(s)) (Sosa)
Political Trend
item units temporal units item expressions
% gatsu naikaku shiji ritsu
(%) (month) (cabinet approval rating)
pointo gen nichi Obuchi naikaku
(decrease of x point(s)) (day) (Obuchi Cabinet)
pointo zou nen Obuchi shushou
(increase of x point(s)) (year) (Prime Minister Obuchi)
dai kagetu shijiritsu
(generation) (month(s)) (approval rating)
pointo bun no kitai
Figure 1: Trend graph for the typhoon data set
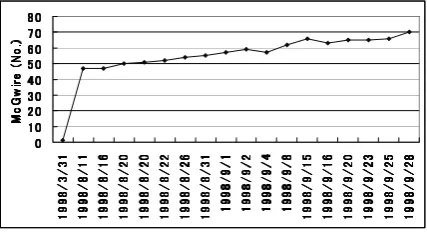
Figure 2: Trend graph for the Major Leagues data set
display a graph where regular temporal intervals are used in the temporal axis.
For the typhoon data set, gou (No.), nichi (day), and taihuu (typhoon) were respectively extracted as the top ranked item unit, temporal unit, and item expression. The system extracted trend in-formation sets using these, and then made a graph where the temporal expression (day) was used for the horizontal axis and the ID numbers of the ty-phoons were shown on the vertical axis. The MuST data included data for September and Octo-ber of 1998 and 1999. Figure 1 is useful for seeing when each typhoon hit Japan during the typhoon season each year. Comparing the 1998 data with that of 1999 reveals that the number of typhoons increased in 1999.
For the Major Leagues data set, gou (No.), nichi (day), and Maguwaia (McGwire) were extracted with the top rank. The system used these to make a graph where the temporal expression (day) was used for the horizontal axis and the cumulative number of home runs hit by McGwire was shown on the vertical axis (Fig. 2). The MuST data included data beginning in August, 1998. The graph shows some points where the cumulative number of home runs decreased (e.g., September
Figure 3: Trend graph for the political trends data set
4th), which was obviously incorrect. This was be-cause our system wrongly extracted the number of home runs hit by Sosa when this was given close to McGwire’s total.
In the political trends data set, %, gatsu (month), and naikaku shiji ritsu (cabinet approval rating) were extracted with the top rankings. The system used these to make a graph where the temporal expression (month) was used for the horizontal axis and the Cabinet approval rating (Japanese Cabinet) was shown as a percentage on the vertical axis. The MuST data covered 1998 and 1999. Figure 2 shows the cabinet approval rating of the Obuchi Cabinet. We found that the overall approval rating trend was upwards. Again, there were some errors in the extracted trend infor-mation sets. For example, although June was han-dled correctly, the system wrongly extracted May as a temporal expression from the sentence “in comparison to the previous investigation in May”.
4.3 Sentence extraction and highlighting display
ap-Sept. 16, 1998 No. 5
Large-scale and medium-strength Typhoon No. 5 made landfall near Omaezaki in Shizuoka Pre-fecture before dawn on the 16th, and then moved to the northeast involving the Koshin, Kantou, and Touhoku areas in the storm.
Sept. 21, 1998 No. 8
Small-scale Typhoon No. 8 made landfall near Tanabe City in Wakayama Prefecture around 4:00 p.m. on the 21st, and weakened while tracking to the northward across Kinki district.
Sept. 22, 1998 No. 7
Typhoon No. 7 made landfall near Wakayama City in the afternoon on the 22nd, and will hit the Kinki district.
Sept. 21, 1998 No. 8
The two-day consecutive landfall of Typhoon No. 8 on the 21st and Typhoon No. 7 on the 22nd caused nine deaths and many injuries in a total of six prefectures including Nara, Fukui, Shiga, and so on.
Oct. 17, 1998 No. 10
Medium-scale and medium-strength Typhoon No. 10 made landfall on Makurazaki City in Kagoshima Prefecture around 4:30 p.m. on the 17th, and then moved across the West Japan area after making another landfall near Sukumo City in Kochi Prefecture in the evening.
Aug. 20, 1999 No. 11
The Meteorological Office announced on the 20th that Typhoon No. 11 developed 120 kilometers off the south-southwest coast of Midway.
Sept. 14, 1999 No. 16
Typhoon No. 16, which developed off the south coast in Miyazaki Prefecture, made landfall near Kushima City in the prefecture around 5:00 p.m. on the 14th.
Sept. 15, 1999 No. 16
Small-scale and weak Typhoon No. 16 became extratropical in Nagano Prefecture and moved out to sea off Ibaraki Prefecture on the 15th.
Sept. 24, 1999 No. 18
Medium-scale and strong Typhoon No. 18 made landfall in the north of Kumamoto Prefecture around 6:00 a.m. on the 24th, and after moving to Suo-Nada made another landfall at Ube City in Yamaguchi Prefecture before 9:00 p.m., tracked through the Chugoku district, and then moved into the Japan Sea after 10:00 p.m.
Sept. 25, 1999 No. 18
Typhoon No. 18, which caused significant damage in the Kyushu and Chugoku districts, weakened and made another landfall before moving into the Sea of Okhotsk around 10:00 a.m. on the 25th.
pear are underlined twice and the other sets are underlined once. (In the actual system, color is used to make this distinction.) The extracted tem-poral expressions and numerical expressions are presented in the upper part of the extracted sen-tence. The graphs shown in the previous section were made by using these temporal expressions and numerical expressions.
The extracted sentences plainly described the state of affairs regarding the typhoons and were important sentences. For the research being done on summarization techniques, this can be consid-ered a useful means of extracting important sen-tences. The extracted sentences typically describe the places affected by each typhoon and whether there was any damage. They contain important descriptions about each typhoon. This confirmed that a simple method of extracting sentences con-taining an item unit, a temporal unit, and an item expression can be used to extract important sen-tences.
The fourth sentence in the figure includes infor-mation on both typhoon no.7 and typhoon no.8. We can see that there is a trend information set other than the extracted trend information set (derlined twice) from the expressions that are un-derlined once. Since the system sometimes ex-tracts incorrect trend information sets, the high-lighting is useful for identifying such sets.
4.4 Evaluation
We used a closed data set and an open data set to evaluate our system. The closed data set was the data set provided by the MuST workshop or-ganizer and contained 20 domain document sets. The data sets were separated for each domain.
We made the open data set based on the MuST data set using newspaper articles (editions of the Mainichi newspaper from 2000 and 2001). We made 24 document sets using information retrieval by term query. We used documents retrieved by term query as the document set of the domain for each query term.
We used the closed data set to adjust our system and used the open data set to calculate the evalua-tion scores of our system for evaluaevalua-tion.
We judged whether a document set included the information needed to make trend graphs by con-sulting the top 30 combinations of three kinds of important expression having the 30 highest values as in the method of Section 3.4. There were 19
documents including such information in the open data. We used these 19 documents for the follow-ing evaluation.
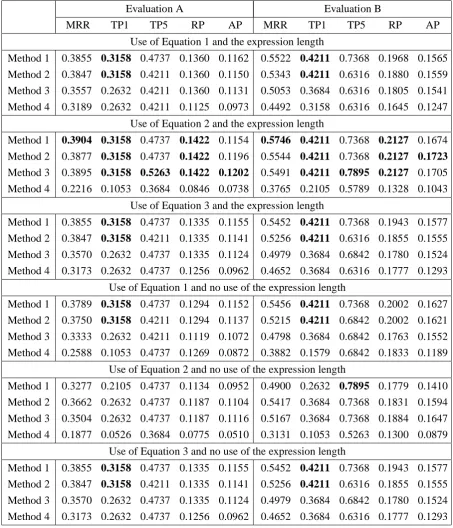
In the evaluation, we examined how accurately trend graphs could be output when using the top ranked expressions. The results are shown in Table 2. The best scores are described using bold fonts for each evaluation score.
We used five evaluation scores. MRR is the av-erage of the score where1/r is given as the score when the rank of the first correct output isr (Mu-rata et al., 2005b). TP1 is the average of the pre-cision in the first output. TP5 is the average of the precision where the system includes a correct output in the first five outputs. RP is the average of the r-precision and AP is the average of the av-erage precision. (Here, the avav-erage means that the evaluation score is calculated for each domain data set and the summation of these scores divided by the number of the domain data sets is the average.) R-precision is the precision of theroutputs where r is the number of correct answers. Average pre-cision is the average of the prepre-cision when each correct answer is output (Murata et al., 2000). The r-precision indicates the precision where the recall and the precision have the same value. The preci-sion is the ratio of correct answers in the system output. The recall is the ratio of correct answers in the system output to the total number of correct answers.
Methods 1 to 4 in Table 2 are the methods used to extract useful trend information described in Section 3.4. Use of the expression length means the product of the occurrence number for an ex-pression and the length of the exex-pression was used to calculate the score for an important item ex-pression. No use of the expression length means this product was not used and only the occurrence number was used.
To calculate the r-precision and average preci-sion, we needed correct answer sets. We made the correct answer sets by manually examining the top 30 outputs for the 24 (= 4×6) methods (the com-binations of methods 1 to 4 and the use of Equa-tions 1 to 3 with or without the expression length) and defining the useful trend information among them as the correct answer sets.
Table 2: Experimental results for the open data
Evaluation A Evaluation B
MRR TP1 TP5 RP AP MRR TP1 TP5 RP AP
Use of Equation 1 and the expression length
Method 1 0.3855 0.3158 0.4737 0.1360 0.1162 0.5522 0.4211 0.7368 0.1968 0.1565
Method 2 0.3847 0.3158 0.4211 0.1360 0.1150 0.5343 0.4211 0.6316 0.1880 0.1559 Method 3 0.3557 0.2632 0.4211 0.1360 0.1131 0.5053 0.3684 0.6316 0.1805 0.1541
Method 4 0.3189 0.2632 0.4211 0.1125 0.0973 0.4492 0.3158 0.6316 0.1645 0.1247
Use of Equation 2 and the expression length
Method 1 0.3904 0.3158 0.4737 0.1422 0.1154 0.5746 0.4211 0.7368 0.2127 0.1674
Method 2 0.3877 0.3158 0.4737 0.1422 0.1196 0.5544 0.4211 0.7368 0.2127 0.1723 Method 3 0.3895 0.3158 0.5263 0.1422 0.1202 0.5491 0.4211 0.7895 0.2127 0.1705
Method 4 0.2216 0.1053 0.3684 0.0846 0.0738 0.3765 0.2105 0.5789 0.1328 0.1043
Use of Equation 3 and the expression length
Method 1 0.3855 0.3158 0.4737 0.1335 0.1155 0.5452 0.4211 0.7368 0.1943 0.1577 Method 2 0.3847 0.3158 0.4211 0.1335 0.1141 0.5256 0.4211 0.6316 0.1855 0.1555
Method 3 0.3570 0.2632 0.4737 0.1335 0.1124 0.4979 0.3684 0.6842 0.1780 0.1524 Method 4 0.3173 0.2632 0.4737 0.1256 0.0962 0.4652 0.3684 0.6316 0.1777 0.1293
Use of Equation 1 and no use of the expression length
Method 1 0.3789 0.3158 0.4737 0.1294 0.1152 0.5456 0.4211 0.7368 0.2002 0.1627 Method 2 0.3750 0.3158 0.4211 0.1294 0.1137 0.5215 0.4211 0.6842 0.2002 0.1621
Method 3 0.3333 0.2632 0.4211 0.1119 0.1072 0.4798 0.3684 0.6842 0.1763 0.1552 Method 4 0.2588 0.1053 0.4737 0.1269 0.0872 0.3882 0.1579 0.6842 0.1833 0.1189
Use of Equation 2 and no use of the expression length
Method 1 0.3277 0.2105 0.4737 0.1134 0.0952 0.4900 0.2632 0.7895 0.1779 0.1410 Method 2 0.3662 0.2632 0.4737 0.1187 0.1104 0.5417 0.3684 0.7368 0.1831 0.1594
Method 3 0.3504 0.2632 0.4737 0.1187 0.1116 0.5167 0.3684 0.7368 0.1884 0.1647 Method 4 0.1877 0.0526 0.3684 0.0775 0.0510 0.3131 0.1053 0.5263 0.1300 0.0879
Use of Equation 3 and no use of the expression length
Method 1 0.3855 0.3158 0.4737 0.1335 0.1155 0.5452 0.4211 0.7368 0.1943 0.1577 Method 2 0.3847 0.3158 0.4211 0.1335 0.1141 0.5256 0.4211 0.6316 0.1855 0.1555
From the experimental results, we found that the method using the total frequency for a word (Equation 2) and the length of an expression was best for calculating the scores of important expres-sions.
Using the length of an expression was impor-tant. (The way of using the length of an expres-sion was described in the last part of Section 3.2.) For example, when “Cabinet approval rating” ap-pears in documents, a method without expression lengths extracts “rating”. When the system tracts trend information sets using “rating”, it ex-tracts wrong information related to types of “rat-ing” other than “Cabinet approval rat“rat-ing”. This hinders the extraction of coherent trend informa-tion. Thus, it is beneficial to use the length of an expression when extracting important item expres-sions.
We also found that method 1 (using both the fre-quency of the trend information sets and the scores of important expressions) was generally the best.
When we judged the extraction of a correct graph as the top output in the experiments to be correct, our best system accuracy was 0.3158 in evaluation A and 0.4211 in evaluation B. When we judged the extraction of a correct graph in the top five outputs to be correct, the best accuracy rose to 0.5263 in evaluation A and 0.7895 in evaluation B. In terms of the evaluation scores for the 24 original data sets (these evaluation scores were multiplied by19/24), when we judged the extraction of a cor-rect graph as the top output in the experiments to be correct, our best system accuracy was 0.3158 in evaluation A and 0.4211 in evaluation B. When we judged the extraction of a correct graph in the top five outputs to be correct, the best accuracy rose to 0.5263 in evaluation A and 0.7895 in evaluation B. Our system is convenient and effective because it can output a graph that includes trend information at these levels of accuracy when given only a set of documents as input.
As shown in Table 2, the best values for RP (which indicates the precision where the recall and the precision have the same value) and AP were 0.2127 and 0.1705, respectively, in evaluation B.
This RP value indicates that our system could extract about one out of five graphs among the cor-rect answers when the recall and the precision had the same value.
5 Related studies
Fujihata et al. (Fujihata et al., 2001) developed a system to extract numerical expressions and their related item expressions by using syntactic infor-mation and patterns. However, they did not deal with the extraction of important expressions or gather trend information sets. In addition, they did not make a graph from the extracted expressions.
Nanba et al. (Nanba et al., 2005) took an approach of judging whether the sentence rela-tionship indicates transition (trend information) or renovation (revision of information) and used the judgment results to extract trend information. They also constructed a system to extract nu-merical information from input nunu-merical units and make a graph that includes trend information. However, they did not consider ways to extract item numerical units and item expressions auto-matically.
In contrast to these systems, our system auto-matically extracts item numerical units and item expressions that each play an important role in a given document set. When a document set for a certain domain is given, our system automati-cally extracts item numerical units and item ex-pressions, then extracts numerical expressions re-lated to these, and finally makes a graph based on the extracted numerical expressions. When a document set is given, the system automatically makes a graph that includes trend information. Our system also uses an original method of pro-ducing more than one graphs and selecting an ap-propriate graph among them using Methods 1 to 4, which Fujihata et al. and Namba et al. did not use.
6 Conclusion
We have studied the automatic extraction of trend information from text documents such as newspa-per articles. Such extraction will be useful for ex-ploring and examining trends. We used data sets provided by a workshop on multimodal summa-rization for trend information (the MuST Work-shop) to construct our automatic trend exploration system. This system first extracts units, tempo-rals, and item expressions from newspaper arti-cles, then it extracts sets of expressions as trend information, and finally it arranges the sets and displays them in graphs.
A and 0.3334 in evaluation B. (In evaluation A, a graph where 75% or more of the points were cor-rect was judged to be corcor-rect; in evaluation B, a graph where 50% or more of the points were cor-rect was judged to be corcor-rect.) When we judged the extraction of a correct graph in the top five out-puts to be correct, we obtained accuracy of 0.4167 in evaluation A and 0.6250 in evaluation B. Our system is convenient and effective because it can output a graph that includes trend information at these levels of accuracy when only a set of docu-ments is provided as input.
In the future, we plan to continue this line of study and improve our system. We also hope to apply the method of using term frequency in doc-uments to extract trend information as reported by Murata et al. (Murata et al., 2005a).
References
Katsuyuki Fujihata, Masahiro Shiga, and Tatsunori Mori. 2001. Extracting of numerical expressions by constraints and default rules of dependency struc-ture. Information Processing Society of Japan, WGNL 145.
Tsuneaki Kato, Mitsunori Matsushita, and Noriko Kando. 2005. MuST: A workshop on multimodal summarization for trend information. Proceedings of the Fifth NTCIR Workshop Meeting on Evaluation of Information Access Technologies: Information Retrieval, Question Answering and Cross-Lingual Information Access.
Yuji Matsumoto, Akira Kitauchi, Tatsuo Yamashita, Yoshitaka Hirano, Hiroshi Matsuda, and Masayuki Asahara. 1999. Japanese morphological analysis system ChaSen version 2.0 manual 2nd edition.
Masaki Murata, Kiyotaka Uchimoto, Hiromi Ozaku, Qing Ma, Masao Utiyama, and Hitoshi Isahara. 2000. Japanese probabilistic information retrieval using location and category information. The Fifth International Workshop on Information Retrieval with Asian Languages, pages 81–88.
Masaki Murata, Koji Ichii, Qing Ma, Tamotsu Shirado, Toshiyuki Kanamaru, and Hitoshi Isahara. 2005a. Trend survey on Japanese natural language process-ing studies over the last decade. In The Second In-ternational Joint Conference on Natural Language Processing, Companion Volume to the Proceedings of Conference including Posters/Demos and Tutorial Abstracts.
Masaki Murata, Masao Utiyama, and Hitoshi Isahara. 2005b. Use of multiple documents as evidence with decreased adding in a Japanese question-answering system. Journal of Natural Language Processing, 12(2).
Hidetsugu Nanba, Yoshinobu Kunimasa, Shiho
Fukushima, Teruaki Aizawa, and Manabu Oku-mura. 2005. Extraction and visualization of trend information based on the cross-document structure. Information Processing Society of Japan, WGNL 168, pages 67–74.