Page 1 of 8 Original Article
Fasting glucose and HbA
1clevels as risk factors for the presence
of intracranial atherosclerotic stenosis
Yan-Li Wang1, Xin-Yi Leng2, Yi Dong3, Xiao-He Hou1, Lin Tong4, Ya-Hui Ma1, Wei Xu1, Mei Cui3, Qiang Dong3, Lan Tan1, Jin-Tai Yu3
1Department of Neurology, Qingdao Municipal Hospital, Qingdao University, Qingdao 266071, China; 2Department of Medicine and Therapeutics, The Chinese University of Hong Kong, Hong Kong, China; 3Department of Neurology and Institute of Neurology, Huashan Hospital, Shanghai Medical College, Fudan University, Shanghai 200040, China; 4Department of Neurology, Yantai Affiliated Hospital of Binzhou Medical University, Yantai 264100, China
Contributions: (I) Conception and design: JT Yu, L Tan, Q Dong; (II) Administrative support: M Cui, W Xu, Y Dong; (III) Provision of study materials or patients: YH Ma, L Tong, XH Hou; (IV) Collection and assembly of data: YL Wang, XY Leng; (V) Data analysis and interpretation: All authors; (VI) Manuscript writing: All authors; (VII) Final approval of manuscript: All authors.
Correspondence to: Prof. Jin-Tai Yu, MD, PhD; Prof. Qiang Dong, MD, PhD. Department of Neurology and Institute of Neurology, Huashan Hospital, Shanghai Medical College, Fudan University, 12th Wulumuqi Zhong Road, Shanghai 200040, China; Prof. Lan Tan, MD, PhD. Department of Neurology, Qingdao Municipal Hospital, Qingdao University, Qingdao 266071, China. Email: jintai_yu@fudan.edu.cn; dong_qiang@fudan.edu.cn; dr.tanlan@163.com.
Background: Intracranial atherosclerotic stenosis (ICAS) is the most common cause of stroke, but the relationship of ICAS with fasting blood glucose (FBG) and glycated hemoglobin A1c (HbA1c) is unclear. This
study aimed to investigate the effects of increased FBG and HbA1c concentration on ICAS.
Methods: A total of 4,012 patients aged over 40 years who underwent cerebral magnetic resonance angiography (MRA) were enrolled in this study, including 1,434 non-stroke controls and 2,578 patients with ischemic stroke. Participants were classified into four groups according to stroke and ICAS status. ICAS was defined as the presence of ≥50% stenosis in any intracranial artery. Multivariate regression analysis was used to evaluate the associations of FBG and HbA1c with ICAS.
Results: Levels of fasting glucose and HbA1c in patients with ICAS were significantly higher than those in
patients without ICAS among both stroke and non-stroke groups. Multivariate regression analysis showed that elevated levels of fasting glucose (OR 1.14, 95% CI, 1.11–1.18, P<0.001) and HbA1c (OR 1.22, 95%
CI, 1.16–1.28, P<0.001) were independent risk factors for ICAS. In addition, patients with the DM (FBG ≥7.0 mmol/L) were at the high risk of ICAS in both non-stroke (OR 2.90, 95% CI, 2.11–3.99, P<0.001) and stroke (OR 1.99, 95% CI, 1.67–2.39, P<0.001) groups. Besides, subjects with the high risk of ICAS were found in the fourth HbA1c quartile in both non-stroke (OR 3.50, 95% CI, 2.23–5.61, P<0.001) and stroke (OR
1.98, 95% CI, 1.50–2.63, P<0.001) groups.
Conclusions: The results suggest that elevated fasting glucose and HbA1c levels are associated with high
risk for ICAS.
Keywords: Fasting glucose; glycated hemoglobin A1c (HbA1c); intracranial atherosclerotic stenosis (ICAS); stroke
Submitted Jul 26, 2019. Accepted for publication Nov 11, 2019. doi: 10.21037/atm.2019.12.56
Introduction
As the leading cause of mortality and adult disability, stroke is a serious health problem in China and worldwide (1-3). Intracranial atherosclerotic stenosis (ICAS) is the most common cerebrovascular lesion in China (4). It has been recognized as a major cause for ischemic stroke in China, accounting for 37–50% of ischemic strokes in the Chinese population (5-7). Besides, stroke patients with ICAS suffer from longer hospital stay and higher rate of stroke relapse than those without ICAS (2,8,9). Therefore, it is important to identify and modify risk factors of ICAS to prevent ICAS and subsequent ischemic strokes. ICAS and stroke share certain modifiable risk factors (4,10). Diabetes mellitus (DM) has been correlated with presence of ICAS and occurrence of ischemic stroke in previous studies (11-13). In addition to DM, pre-diabetic status, such as impaired fasting glucose (IFG) (14), as well as long-term glucose level, usually reflected by the glycated hemoglobin A1c (HbA1c) level, are also associated with ICAS and
stroke. It has been reported that IFG (6.10–6.99 mmol/L) and DM have been associated with a higher prevalence of asymptomatic ICAS in a cohort of 5,309 subjects free of stroke and coronary artery disease (CAD) (15). A history of DM and high HbA1clevel have been associated with presence of ICAS as well, in the Chinese Intracranial Atherosclerosis study (CICAS, a cohort of 2,864 stroke patients with or without ICAS), and in the Kangbuk Samsung Health Study (a health screening program of 10,550 participants in South Korea) (4,16,17).
However, few studies have systematically investigated the associations of different stages of DM, and instant and long-term blood glucose levels, with ICAS in a same cohort. Therefore, in this study, we aimed to investigate the associations of ICAS, as diagnosed by magnetic resonance angiography (MRA), with instant and long-term blood glucose levels, and different stages of diabetes including pre-diabetes in stroke and non-stroke patients.
Methods
Study population
Study subjects were prospectively recruited from January 2014 to June 2018 among patients in the department of neurology for suspected stroke and individuals at the health screening center underwent comprehensive health screening at Qingdao Municipal Hospital. Most of the participants
from the health screening center did not have serious health problems. And the costs of the health screening were paid by their company or by each participant. We enrolled continuous individuals aged over 40 years, who had undergone brain MRI and MRA, and laboratory tests including but not limited to fasting blood glucose (FBG) and HbA1c tests. We excluded individuals in all groups who (I) had incomplete cerebral vascular imaging or laboratory tests; (II) had intracerebral hemorrhage, extracranial atherosclerotic stenosis, atrial fibrillation and possible cardioembolism; (III) had intracranial and/or extracranial artery stenosis due to non-atherosclerotic diseases, such as dissection, arteritis, moyamoya disease, and muscular fiber dysplasia; (IV) had infection, tumor, chronic liver disease and renal insufficiency, which could have influenced the blood glucose levels; (V) did not provide a written informed consent. Written informed consent form was obtained from all participants or their legal representatives. This study was approved by the Institutional Ethics Committees of Qingdao Municipal Hospital.
Ultimately, 4,012 subjects were recruited in the current study, including 1,434 subjects without transient cerebral ischemia (TIA) or ischemic stroke and 2,578 ischemic stroke patients withTIA or magnetic resonance imaging (MRI) confirmed acute ischemic stroke (within 7 days of onset).
Imaging assessment and patient grouping
BA and intracranial section of VA.
Based on imaging and clinical data, the included participants were classified into 4 subgroups as follows: (I) subjects without stroke or ICAS; (II) patients without stroke but having asymptomatic ICAS; (III) patients with stroke but no ICAS; (IV) patients with stroke and ICAS.
Definition of potential risk factors
A variety of demographic data were included: age, sex, hypertension, DM, CAD. In this study, hypertension was defined as a systolic blood pressure ≥140 mmHg, a diastolic blood pressure ≥90 mmHg or using antihypertensive drugs (19); history of DM was defined as self-reported or known DM (20); CAD was defined as a documented previous or newly-diagnosed CAD.
Assessment and classification of FBG and HbA1c levels Blood samples were collected in the morning after an overnight fast. Automated analytical platform (Beckman Coulter AU5800: Beckman Coulter Inc., Brea, CA, USA) was used to measure fasting glucose. Fasting glucose was stratified into four levels: normal fasting glucose (NFG): FBG <5.6 mmol/L; impaired fasting glucose-1 (IFG-1): 5.6 mmol/L ≤ FBG <6.1 mmol/L; IFG-2: 6.1 mmol/L
≤ FBG <7.0 mmol/L; DM: FBG ≥7.0 mmol/L (15). HbA1c
was divided into four levels according to quartiles.
Statistical analysis
Kolmogorov-Smirnov tests were used to test the distributions of continuous variables. One-way ANOVA (analysis of variance) or Kruskal-Wallis test was used to compare intergroup difference for continuous variables, and Chi-square test was used to compare categorical variables. Results were shown as mean ± standard deviation (SD) or median with interquartile range (IQR) and proportions appropriately. Univariate and binary logistic regression analysis were used to calculate odd ratios (ORs) and 95% confidence intervals (CIs) for the effects of risk factors on presence of ICAS. Variables with a P value <0.05 by univariate logistic regression for presence of ICAS were included in binary logistic regression analysis for independent predictors for presence of ICAS. All statistical analyses were performed with R version 1.1.383. A two-tailed P value <0.05 represented statistically significant difference.
Results
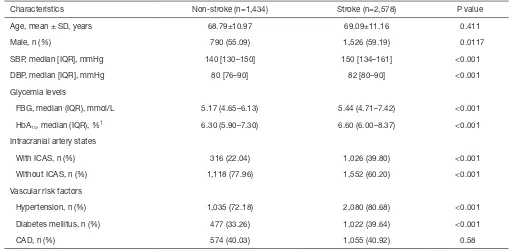
Baseline characteristics of the study subjects
Of all the 4,012 participants, 1,434 (35.7%) were non-stroke individuals and 2,578 (64.3%) were stroke patients. The non-stroke group included 1,118 patients without ICAS and 316 patients with ICAS and the stroke group included 1,552 without ICAS and 1,026 with ICAS. The baseline characteristics of the included subjects based on stroke and ICAS status were summarized in Table 1. In non-stroke and stroke groups, higher prevalence of high levels of SBP, FBG and HbA1c, hypertension, diabetes were observed in patients
with ICAS. Table S1 showed the baseline characteristics of the included subjects based on stroke status.
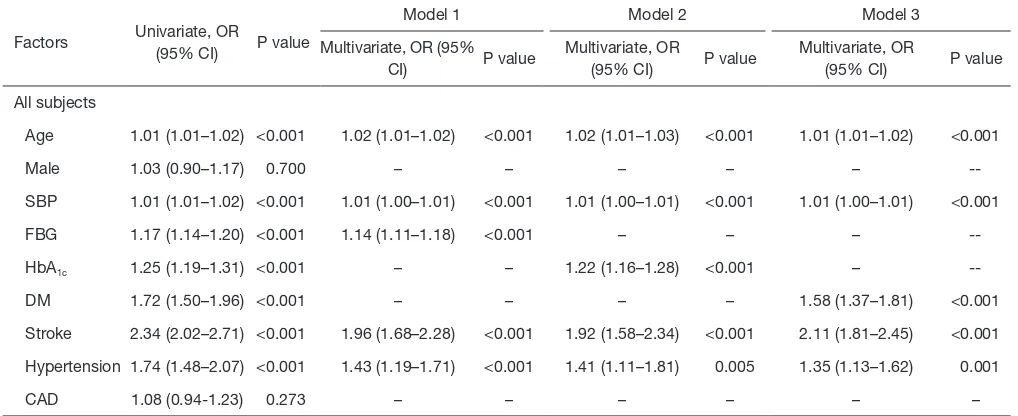
Associations of HbA1c and fasting glucose with ICAS in all
subjects recruited
Table 2 showed that fasting glucose was an independent risk factor for ICAS (OR 1.14, 95% CI, 1.11–1.18, P<0.001) (Table 2, model 1). Besides, HbA1c was also independently
associated with ICAS (OR 1.22, 95% CI, 1.16–1.28, P<0.001) (Table 2, model 2).
Associations of HbA1c and fasting glucose with ICAS in
stroke and non-stroke subjects
In both non-stroke and stroke groups, HbA1c and fasting
glucose were associated with higher risk of ICAS (Table 3,
model 1 and 2). Taking the normal FBG as a reference, there was a significant relationship between DM and ICAS in both non-stroke (OR 2.90, 95% CI, 2.11–3.99) and stroke groups (OR 1.99, 95% CI, 1.67–2.39). However, the positive correlation between IFG-2 and ICAS was only observed in stroke group (Figure 1A,B). In addition, the fourth HbA1c quartile was correlated with ICAS in both
groups (Figure 1C,D).
Discussion
ICAS is more prevalent in China than in populations with white descent. Potential explanations may include different race, diagnostic methods and lifestyle patterns (4). In this study the association of ICAS and glycemia levels in the Chinese population was explored. The results of this study indicate that elevated levels of fasting glucose and HbA1c
analysis.
Compared with fasting glucose, HbA1c testing has
several advantages, including less biologic variability, less
instability and more convenience without requirement for 8-h-fast preparation (21,22). Besides, HbA1c could reflect
the continuous exposure to blood glucose level over the Table 1 Baseline characteristics of participants with ICAS or without ICAS
Characteristics
Non-stroke (n=1434) Stroke (n=2578)
P value* P value** Without ICAS
(n=1,118)
With ICAS (n=316)
Without ICAS (n=1,552)
With ICAS (n=1,026)
Age, mean ± SD, years 68.21±10.86 71.50±11.11 68.46±11.10 70.05±11.18 <0.001 <0.001
Male, n (%) 616 (55.10) 174 (55.06) 931 (59.99) 595 (57.99) 0.991 0.313
SBP, median [IQR], mmHg 140 [128–150] 146 [130–160] 147 [130–160] 150 [138–167] <0.001 <0.001
DBP, median [IQR], mmHg 80 [75–90] 84 [80–90] 81 [80–90] 84 [80–90] 0.001 0.111
Glycemia levels
FBG, median (IQR), mmol/L 5.11 (4.64–5.93) 5.42 (4.68–7.32) 5.25 (4.65–6.83) 5.85 (4.80–8.21) <0.001 <0.001
HbA1c, median (IQR), %† 6.20 (5.80–7.00) 6.9 (6.07–8.8) 6.40 (5.90–7.90) 7.00 (6.05–8.90) <0.001 <0.001
Vascular risk factors
Hypertension, n (%) 778 (69.59) 257 (81.33) 1,214 (78.22) 866 (84.41) <0.001 <0.001
Diabetes mellitus, n (%) 337 (30.14) 140 (44.30) 546 (35.18) 476 (46.39) <0.001 <0.001
CAD, n (%) 441 (39.45) 133 (42.09) 627 (40.40) 428 (41.72) 0.397 0.506
†, totally 1,503 patients missed HbA
1c data: non-stroke without ICAS subgroup missed 447; non-stroke with ICAS subgroup missed 120;
stroke without ICAS subgroup missed 561; stroke with ICAS subgroup missed 375. P value* was for patients with or without ICAS in non-stroke group; P value** was for patients with or without ICAS in non-stroke group. SBP, systolic blood pressure; DBP, diastolic blood pressure; FBG, fasting blood glucose; HbA1c, hemoglobin A1c; CAD, coronary artery disease; IQR, interquartile range; SD, standard deviation.
Table 2 Multivariable analysis of risk factors associated with ICAS in all subjects
Factors Univariate, OR (95% CI) P value
Model 1 Model 2 Model 3
Multivariate, OR (95% CI) P value
Multivariate, OR
(95% CI) P value
Multivariate, OR
(95% CI) P value
All subjects
Age 1.01 (1.01–1.02) <0.001 1.02 (1.01–1.02) <0.001 1.02 (1.01–1.03) <0.001 1.01 (1.01–1.02) <0.001
Male 1.03 (0.90–1.17) 0.700 – – – – –
--SBP 1.01 (1.01–1.02) <0.001 1.01 (1.00–1.01) <0.001 1.01 (1.00–1.01) <0.001 1.01 (1.00–1.01) <0.001
FBG 1.17 (1.14–1.20) <0.001 1.14 (1.11–1.18) <0.001 – – –
--HbA1c 1.25 (1.19–1.31) <0.001 – – 1.22 (1.16–1.28) <0.001 –
--DM 1.72 (1.50–1.96) <0.001 – – – – 1.58 (1.37–1.81) <0.001
Stroke 2.34 (2.02–2.71) <0.001 1.96 (1.68–2.28) <0.001 1.92 (1.58–2.34) <0.001 2.11 (1.81–2.45) <0.001
Hypertension 1.74 (1.48–2.07) <0.001 1.43 (1.19–1.71) <0.001 1.41 (1.11–1.81) 0.005 1.35 (1.13–1.62) 0.001
CAD 1.08 (0.94-1.23) 0.273 – – – – – –
SBP, systolic blood pressure; FBG, fasting blood glucose; HbA1c, hemoglobin A1c; CAD, coronary artery disease; IQR, interquartile range;
previous 8 to 12 weeks (23).
Several possible mechanisms can explain the association of hyperglycemia with atherosclerosis. Inflammation and immunity connect atherosclerosis with DM (24). Hyperglycemia may induce formation of reactive oxygen species, oxidative stress increased microvessels in plaques and increased tissue factors (25). Reactive oxygen species, induced by hyperglycemia, can cause endothelial damage, increase vascular permeability, and promote synthesis of vasoconstrictor prostanoids and endothelin, further leading to the formation of high-risk atherosclerotic plaques (26). Generally, oxidative stress causes inflammation, and adventitial inflammation in turn results in intraplaque hemorrhage, macrophage activation and lipid core expansion, promoting the formation of atherosclerotic lesions (27). Microvessels at the base of the plaque increase in patients with diabetes, causing plaque instability and
intraplaque hemorrhage (25). In addition, tissue factors, the most potent trigger of coagulation-mediated thrombosis, are increased in patients with diabetes (25). Thrombus forms after rupture of an atherosclerotic plaque, leading to stroke (28). What’s more, insulin resistance, a major feature of type 2 diabetes, is strongly linked to vascular dysfunctions, including cardiovascular disease, intracranial atherosclerosis and ischemic stroke (29,30). Insulin resistance can enhance both atherogenesis and advanced plaque progression of atherosclerosis and it can promote platelet adhesion, activation and aggregation which are related to ischemic stroke (29,31).
In order to reduce the risk of intracranial atherosclerosis and stroke by managing the blood sugar, our study further explored the associations of stratified glycemic levels with ICAS and stroke. Our results show that distinctly the elevated fasting glucose between 6.1 and 6.9 mmol/L, Table 3 Multivariable analysis of risk factors associated with ICAS in stroke and non-stroke subjects
Factors Univariate, OR
(95% CI) P value
Model 1 Model 2 Model 3
Multivariate, OR
(95% CI) P value
Multivariate, OR
(95% CI) P value
Multivariate, OR
(95% CI) P value
Non-stroke patients
Age 1.02 (1.01–1.03) <0.001 1.02 (1.01–1.03) <0.001 1.03 (1.01–1.05) <0.001 1.02 (1.01–1.03) 0.001
Male 1.00 (0.78–1.29) 0.991 – – – – – –
SBP 1.02 (1.01–1.03) <0.001 1.01 (1.01–1.02) <0.001 1.01 (1.00–1.02) 0.002 1.02 (1.01–1.02) <0.001
FBG 1.26 (1.18–1.35) <0.001 1.24 (1.16–1.33) <0.001 – – – –
HbA1c 1.47 (1.32–1.63) <0.001 – – 1.45 (1.30–1.61) <0.001 – –
DM 1.84 (1.43–2.38) <0.001 – – – – 1.58 (1.21–2.05) <0.001
Hypertension 1.90 (1.40–2.61) <0.001 1.51 (1.09–2.13) 0.015 1.39 (0.89–2.21) 0.153 1.39 (1.00–1.94) 0.053
CAD 1.11 (0.86–1.44) 0.397 – – – – – –
Stroke patients
Age 1.01 (1.00–1.02) <0.001 1.01 (1.00–1.02) <0.001 1.02 (1.01–1.03) <0.001 1.01 (1.00–1.02) <0.001
Male 1.08 (0.92–1.27) 0.313 – – – – – –
SBP 1.01 (1.00–1.01) <0.001 1.00 (1.00–1.01) 0.003 1.00 (1.00–1.01) 0.035 1.01 (1.00–1.01) 0.001
FBG 1.12 (1.09–1.16) <0.001 1.12 (1.09–1.16) <0.001 – – – –
HbA1c 1.16 (1.10–1.23) <0.001 – – 1.16 (1.10–1.23) <0.001 – –
DM 1.59 (1.36–1.87) <0.001 – – – – 1.56 (1.32–1.83) <0.001
Hypertension 1.51 (1.23–1.86) <0.001 1.37 (1.10–1.70) 0.005 1.42 (1.07–1.90) 0.017 1.31 (1.06–1.63) 0.014
CAD 1.06 (0.90–1.24) 0.506 – – – – – –
SBP, systolic blood pressure; FBG, fasting blood glucose; HbA1c, hemoglobin A1c; CAD, coronary artery disease; IQR, interquartile range;
a pre-diabetes status, is associated with a higher ICAS risk of stroke patients, and hyperglycemia could promote the atherosclerotic process (18). A prospective cohort study demonstrated that fasting glucose had a J-shaped association with the risk of stroke in patients with pre-existing atherothrombotic disease, and the risk increased among both patients with fasting glucose levels >5.6 mmol/L and those with fasting glucose levels <4.4 mmol/L (32). Severe hypoglycemia may induce white cell activation, platelet aggregation, release of cytokines and mediators, subsequently leading to vasoconstriction and ischemia (17,32). Wang et al. reported that the elevated fasting glucose ≥5.6 mmol/L was a predictor of ICAS (15). However, our study shows that the elevated fasting glucose ≥7.0 mmol/L is a predictor of ICAS in non-stroke group, while in stroke group the elevated fasting glucose
≥6.1 mmol/L is a predictor of ICAS. The differences may be partly explained that some ICAS patients may be categorized into non-ICAS group in the previous study due to poor temporal window for transcranial Doppler ultrasound (TCD) (33). Consistent with previous studies, our study demonstrates that there is a positive association of HbA1c with multiple intracranial stenoses and stroke (34,35).
The strength of our study is that stenosis degree is assessed by MRA which is more accurate than TCD (36). In addition, blood glucose test is relatively inexpensive, widely measured and more convenient than oral glucose tolerance
test (OGTT), which needs sampling at 30 minutes, 1 hour and 2 hours (37). Furthermore, the results in this study demonstrate that the patients with the IFG2 (FBG
≥6.1 mmol/L) level are at higher risk of ICAS in stroke group, while DM (FBG ≥7.0 mmol/L) level are at higher risk of ICAS in non-stroke group. However, our study has several limitations. First, this is a cross-sectional study. Therefore, we cannot get any information about the development or prognosis of ICAS and stroke. Second, our findings may not be generalizable to different populations, as the current study included only Chinese adults living in Qingdao. Despite these limitations, our study has significance for the management of blood glucose in patients with ICAS. Further studies, which include more populations and more detailed categories, are essential for confirming our findings.
Conclusions
In this large Chinese cohort, our study demonstrates that the elevated fasting glucose and HbA1c levels are independent risk
factors for ICAS and ischemic stroke. Hyperglycemia may be controlled to decrease the risk of ICAS.
Acknowledgments
We thank all the study participants for their assistants and Figure 1 Multinomial-adjusted OR and 95% CI for ICAS according to FBG (FBG <5.6 mmol/L as the reference) and HbA1c levels in non-stroke and non-stroke groups. (A) Adjusted OR and 95% CI for ICAS according to glucose levels in non-non-stroke group; (B) adjusted OR and 95% CI for ICAS according to glucose levels in stroke group; (C) adjusted OR and 95% CI for ICAS according to HbA1C levels in non-stroke group; (D) adjusted OR and 95% CI for ICAS according to HbA1C levels in stroke group. IFG1: 5.6 mmol/L ≤ FBG <6.1 mmol/L; IFG2: 6.1 mmol/L ≤ FBG <7.0 mmol/L; DM: FBG ≥7.0 mmol/L.
A
B
C
supports.
Funding: This study was supported by grants from
the Taishan Scholars Program of Shandong Province (ts201511109 and tsqn20161079) and Qingdao Key Health Discipline Development Fund, Shanghai Municipal Science and Technology Major Project (No. 2018SHZDZX01) and ZHANGJIANG LAB, Tianqiao and Chrissy Chen Institute, and the State Key Laboratory of Neurobiology and Frontiers Center for Brain Science of Ministry of Education, Fudan University.
Footnote
Conflicts of Interest: The authors have no conflicts of interest to declare.
Ethical Statement: The authors are accountable for all
aspects of the work in ensuring that questions related to the accuracy or integrity of any part of the work are appropriately investigated and resolved. This study was approved by the Institutional Ethics Committees of Qingdao Municipal Hospital (No. QDSSLYY-2014-034) and written informed consent form was obtained from all participants or their legal representatives.
References
1. Yang G, Wang Y, Zeng Y, et al. Rapid health transition in China, 1990–2010: findings from the Global Burden of Disease Study 2010. Lancet 2013;381:1987-2015.
2. Liu L, Wang D, Wong KS, et al. Stroke and stroke care in China: huge burden, significant workload, and a national priority. Stroke 2011;42:3651-4.
3. Liu M, Wu B, Wang WZ, et al. Stroke in China: epidemiology, prevention, and management strategies. Lancet Neurol 2007;6:456-64.
4. Wang Y, Zhao X, Liu L, et al. Prevalence and outcomes of symptomatic intracranial large artery stenoses and occlusions in China: the Chinese Intracranial Atherosclerosis (CICAS) Study. Stroke 2014;45:663-9. 5. Qian Y, Pu Y, Liu L, et al. Low HDL-C level is associated
with the development of intracranial artery stenosis: analysis from the Chinese IntraCranial AtheroSclerosis (CICAS) study. PLoS One 2013;8:e64395.
6. Zhang J, Li Y, Wang Y, et al. Arterial stiffness and asymptomatic intracranial large arterial stenosis and calcification in hypertensive chinese. Am J Hypertens 2011;24:304-9.
7. Holmstedt CA, Turan TN, Chimowitz MI. Atherosclerotic intracranial arterial stenosis: risk factors, diagnosis, and treatment. The Lancet Neurology 2013;12:1106-14. 8. Weber R, Kraywinkel K, Diener HC, et al. Symptomatic
intracranial atherosclerotic stenoses: prevalence and prognosis in patients with acute cerebral ischemia. Cerebrovasc Dis 2010;30:188-93.
9. Pan Y, Meng X, Jing J, et al. Association of multiple infarctions and ICAS with outcomes of minor stroke and TIA. Neurology 2017;88:1081-8.
10. Sacco RL, Wolf PA, Gorelick PB. Risk factors and their management for stroke prevention: outlook for 1999 and beyond. Neurology 1999;53:S15-24.
11. Banerjee C, Chimowitz MI. Stroke Caused by
Atherosclerosis of the Major Intracranial Arteries. Circ Res 2017;120:502-13.
12. Zhai FF, Yan S, Li ML, et al. Intracranial Arterial Dolichoectasia and Stenosis: Risk Factors and Relation to Cerebral Small Vessel Disease. Stroke 2018;49:1135-40. 13. Sarwar N, Gao P, Seshasai SR, et al. Diabetes mellitus,
fasting blood glucose concentration, and risk of vascular disease: a collaborative meta-analysis of 102 prospective studies. Lancet 2010;375:2215-22.
14. Barlow PN. Complement and disease: better no factor H than bad factor H. Transl Cancer Res 2017;6:S606-9. 15. Wang J, Wu J, Zhang S, et al. Elevated fasting glucose
as a potential predictor for asymptomatic cerebral artery stenosis: a cross-sectional study in Chinese adults. Atherosclerosis 2014;237:661-5.
16. Oh HG, Chung PW, Rhee EJ. Increased risk for intracranial arterial stenosis in subjects with coronary artery calcification. Stroke 2015;46:151-6.
17. Oh HG, Rhee EJ. Blood Pressure Is the Determinant for the Increased Risk for Intracranial Arterial Stenosis in Subjects with Elevated Glycated Hemoglobin Levels: The Kangbuk Samsung Health Study. J Stroke Cerebrovasc Dis 2016;25:2729-34.
18. Samuels OB, Joseph GJ, Lynn MJ, et al. A standardized method for measuring intracranial arterial stenosis. AJNR Am J Neuroradiol 2000;21:643-6.
19. Zhu YC, Tzourio C, Soumare A, et al. Severity of dilated Virchow-Robin spaces is associated with age, blood pressure, and MRI markers of small vessel disease: a population-based study. Stroke 2010;41:2483-90. 20. Di Castelnuovo A, Veronesi G, Costanzo S, et al.
NT-proBNP (N-Terminal Pro-B-Type Natriuretic Peptide) and the Risk of Stroke. Stroke 2019;50:610-7.
variability of fasting plasma glucose in newly diagnosed type 2 diabetic subjects. Diabetes Care 1999;22:394-8. 22. International Expert Committee. International Expert
Committee report on the role of the A1C assay in the diagnosis of diabetes. Diabetes Care 2009;32:1327-34. 23. Nathan DM, Turgeon H, Regan S. Relationship between
glycated haemoglobin levels and mean glucose levels over time. Diabetologia 2007;50:2239-44.
24. Major AS, Harrison DG. What fans the fire: insights into mechanisms of inflammation in atherosclerosis and diabetes mellitus. Circulation 2011;124:2809-11. 25. Moreno PR, Fuster V. New aspects in the pathogenesis
of diabetic atherothrombosis. J Am Coll Cardiol 2004;44:2293-300.
26. Ceriello A, Motz E. Is oxidative stress the pathogenic mechanism underlying insulin resistance, diabetes, and cardiovascular disease? The common soil hypothesis revisited. Arterioscler Thromb Vasc Biol 2004;24:816-23. 27. Zhang L, Zalewski A, Liu Y, et al. Diabetes-induced
oxidative stress and low-grade inflammation in porcine coronary arteries. Circulation 2003;108:472-8.
28. Tatsumi K, Mackman N. Tissue Factor and
Atherothrombosis. J Atheroscler Thromb 2015;22:543-9. 29. Deng XL, Liu Z, Wang C, et al. Insulin resistance in
ischemic stroke. Metab Brain Dis 2017;32:1323-34.
30. Paneni F, Beckman JA, Creager MA, et al. Diabetes and vascular disease: pathophysiology, clinical consequences, and medical therapy: part I. Eur Heart J 2013;34:2436-43. 31. Bornfeldt Karin E, Tabas I. Insulin Resistance,
Hyperglycemia, and Atherosclerosis. Cell Metabolism 2011;14:575-85.
32. Tanne D, Koren-Morag N, Goldbourt U. Fasting plasma glucose and risk of incident ischemic stroke or transient ischemic attacks: a prospective cohort study. Stroke 2004;35:2351-5.
33. Ryu WS, Park SS, Kim YS, et al. Long-term natural history of intracranial arterial stenosis: an MRA follow-up study. Cerebrovasc Dis 2014;38:290-6.
34. Choi N, Lee JY, Sunwoo JS, et al. Recently Uncontrolled Glycemia in Diabetic Patients Is Associated with
the Severity of Intracranial Atherosclerosis. J Stroke Cerebrovasc Dis 2017;26:2615-21.
35. Zhao W, Katzmarzyk PT, Horswell R, et al. Sex differences in the risk of stroke and HbA(1c) among diabetic patients. Diabetologia 2014;57:918-26.
36. Brinjikji W, Huston J, 3rd, Rabinstein AA, et al.
Contemporary carotid imaging: from degree of stenosis to plaque vulnerability. J Neurosurg 2016;124:27-42. 37. American Diabetes Association. (2) Classification and
diagnosis of diabetes. Diabetes Care 2015;38 Suppl:S8-16.
Cite this article as:Wang YL, Leng XY, Dong Y, Hou XH, Tong L, Ma YH, Xu W, Cui M, Dong Q, Tan L, Yu JT. Fasting glucose and HbA1c levels as risk factors for the presence
Table S1 Baseline characteristics of the study population
Characteristics Non-stroke (n=1,434) Stroke (n=2,578) P value
Age, mean ± SD, years 68.79±10.97 69.09±11.16 0.411
Male, n (%) 790 (55.09) 1,526 (59.19) 0.0117
SBP, median [IQR], mmHg 140 [130–150] 150 [134–161] <0.001
DBP, median [IQR], mmHg 80 [76–90] 82 [80–90] <0.001
Glycemia levels
FBG, median (IQR), mmol/L 5.17 (4.65–6.13) 5.44 (4.71–7.42) <0.001
HbA1c, median (IQR), %† 6.30 (5.90–7.30) 6.60 (6.00–8.37) <0.001
Intracranial artery states
With ICAS, n (%) 316 (22.04) 1,026 (39.80) <0.001
Without ICAS, n (%) 1,118 (77.96) 1,552 (60.20) <0.001
Vascular risk factors
Hypertension, n (%) 1,035 (72.18) 2,080 (80.68) <0.001
Diabetes mellitus, n (%) 477 (33.26) 1,022 (39.64) <0.001
CAD, n (%) 574 (40.03) 1,055 (40.92) 0.58
†, totally 1,503 patients missed HbA
1c data: non-stroke group missed 567; stroke group missed 936. SBP, Systolic blood pressure; FBG,