Mathematical Methods for the Analysis of Polycrystal Phase
Evolutions
V. B. Zlokazov a, I. A. Bobrikov b, and A. M. Balagurov c
1Joint Institute for Nuclear Research, Joliot-Curie 6, 141980 Dubna, Russia
Abstract. Two methods for an automatic analysis of the temporal evolution of a multi-phase polycrystalline sample are described:
• The Upeak method, analyzing the spectra formally, i.e., carrying the peak search in
them, and so describing the evolution in terms of spectral peaks, or having made addi-tionally the autoindexing of the found peaks, preparing the crystallographic informa-tion for the Rietveld analysis.
• The Rietveld method, using an already available crystallographic information about
the phase reflections, and describing the unit cell and atomic characteristics of each phase, and the mutual phase contributions to the total intensity for each item of the analyzed sequence of neutron scattering spectra.
The paper describes difficulties of an automatic analysis securing the convergence of a
non-linear and at the same time non-stationary fitting.
The evolution of the polycrystalline compound CuFe2O4 with the temperatureT in the
range from 300 to 500 degrees Celsius illustrates the performance of the methods.
1 Introduction
In real-time experiments a multi-phase polycrystalline sample is step-wise exposed to external impacts (heat, mechanical ones, etc.). A sequence of neutron-diffraction spectra from this sample is measured and, analyzed in an automatic mode, displays a picture of the crystallographic phase evolution of this sample in terms of the external influences.
Mathematically this involves the analysis of the temporal evolution of a non-stationary regression, strongly nonlinear with respect to parameters and independent variables and, besides, containing in-tuitively clear but, strictly speaking, informal elements.
This paper is a description of the mathematical part of these experiments (DELPHI program SPEVA).
ae-mail: [email protected] be-mail: [email protected] ce-mail: [email protected]
2 Diffraction on crystals
Formally the crystal is an atomic structure in which we can select a base configuration – the unit cell, periodically repeated in all directions in the space. The unit cell is uniquely related to the crystal and is described by the setC– valuesa,b,c, α, β, γin the direct space and the related onesC−1 = a∗,b∗,c∗, α∗, β∗, γ∗in the reciprocal one. Each phase of a polycrystal is a kind of a ‘subcrystal’ with its own unit cell, i.e.,C andC−1. The diffraction scattering on a multiphase crystal is considered as an additive superposition of scatterings on all the phases, provided that they constitute periodic structures.
A diffraction pattern consists of reflections characterized by
1. coordinates in the crystal reciprocal space – integer numbersh,k,l=H(Miller indices), which form a normal vector to the corresponding system of crystallographic planes. For a givenHthe plane system is uniquely defined by the interplanar spacingdH
dH=1/(H,H), (1)
where the scalar product (H,H) is written in the reciprocal space as follows:
(H,H)=a∗2h2+b∗2k2+c∗2l2+2a∗b∗cos(γ∗)hk+2a∗c∗cos(β∗)hl+2b∗c∗cos(α∗)kl; (2)
2. the structure factor F(H) (or F(dH)), which is connected with the scattering intensity on the system of the crystal planesH,
FH= j
t
bj·Nj·exp(2πi(H,Ut·Xj))·exp(−Bj·(UtH,Ut∗H)). (3)
HereXj, bj, Nj, Bj denote the atomic coordinates, the coherent scattering length, the
occu-pancy and the thermal parameter of the jth atom of the unit cell, respectively. Ut are unitary transformations from a space group, specific for each type of the crystal symmetry.
In the diffraction pattern a visual illustration of a reflection is a peak-like figure with the center con-nected to the corresponding unit cell characteristics (1) and the area – with the atomic ones.
There are two ways of the diffraction evolution analysis.
1. The procedure of Upeak auto-indexing – to find peaks in an analyzed diffraction spectrum, sort them to phases, assign them their Miller indices, and estimate the parameters of the unit cells;
2. The Rietveld procedure – to fit the diffraction spectrum using an a priori information about the polycrystal (or powder) and estimate both cell and atomic parameters.
3 The Upeak method
Mathematically the problem of a spectrum analysis is the decomposition of the spectrum into its com-ponents – peaks and the background. Yet, the single strict method for the decomposition of a function
• a satisfactory number of physically meaningful parameters needs to be taken into account in order to make the component description as thorough as possible;
• the parameters should be uncorrelated and their total number should be as small as possible so that the decomposition, performed through a fitting, would be successful.
In the present paper the method described in [1] was used. We assume that the peak shape preserves its main geometric properties along the spectrum, except for such fundamental characteristics as the amplitudeA, the positionc, and the widthW[2]. If a functionm(x) represents a typical peak shape, then each peakf(x) is connected withm(x) by
f(x)=A·m((x−c)/W) (4)
and thus the peak function is parametrized to f(x,A,c,W). The perfect and widely used peak shapes asA·exp(−((x−c)/W)2) (Gaussian) andA/(1+((x−c)/W)2) (Lorentzian) satisfy the formula (4).
However,m(x) can have quite an arbitrary irregular form too, with the single requirement that it must adequately describe the form of the real peaks.
Such functions can be differentiated with respect to the parametersA,c, andW:
∂f(z)
∂A =m(z);
∂f(z)
∂c =−m
z(z)(1/W);
∂f(z)
∂W =−m
z(z)(z/W);
wherez=(x−c)/Wandm(z) denotes the first order derivative with respect toz.
However, the real peaks quite often significantly deviate from the ideal shape and to find other formulae with only 3 physically meaningful parameters is a difficult task. This task can be solved, e.g., by taking a curvem(x) which is a typical representation of the real peak shape and to parametrize it following (4). Ifm(x) is given numerically, it can be completed to a full analytical function by means of spline interpolation. A peak model with a minimum number of parameters is very important because the problem of function decomposition is, as a rule, an ill posed one and the the restriction of the number of parameters to minimum is an efficient means to substantially improve the matrix invertibility in the fitting procedure.
This approach can be applied to the model of the background as well, but usually it is easier to use polynomials as background model.
4 Auto-indexing of a neutron-diffraction spectrum
The first step in the spectrum analysis is the peak search – the identification of characteristic parts of the spectrum and the approximate evaluation of their TOF positions – parameterstj, j= 1, . . . ,n. It
is intuitively clear what a peak is, but it is difficult to define a peak formally. In mathematical terms the whole problem is that of the recognition of statistically distorted patterns.
Along with a peak there is another fundamental constituent of a spectrum – the background (which is also an informal notion and requires a formalization too).
The peaks can overlap with each other and with the background as well. The widely used methods of visual recognition based on neural networks meet here additional difficulties due to the fact that the essential properties of these objects relate not only to their geometry and topology but also to their statistics.
This paper is based on the peak and background formalization described in [2], which treat both of them as combinations of special points of a functionQc(t) – quasi-curvature, which for a spectrum
s(t) is defined asQc(t)=s(t)/√1+s(t)2.
The outcome of this step produces peaks and estimates of their centerstjand the errors of these
At the next step we must perform the autoindexing (often called powder indexing) – sort out the peaks in phases (a particular peak may belong to different phases) and assign them the Miller indices (a given peak may point to different indices), and estimate the unit cell parameters.
The solution is obtained by the minimization of the autoindexing quality measures with respect to the unit cell parametersCiofnphases andmMiller indicesHi jin the following functional,
n
i=1 m
j=1
wj[dj−d(Ci,Hi j)2]. (5)
Heredjplays the role of an experimentald-spacing which is connected with the corresponding peak
centertjby the relationship
tj=505.556·L·sin(θ)dj/r−t0, (6)
whereris the channel width, t0is the time delay, Lis the flight path,θis the Bragg angle, and the
d(Ci,Hi j) are calculated from the equations (1) and (2).
The parameters such asL,θ, andt0are known from an experiment with a standard sample; this is a separate preliminary task.
The equation for the search of the minimum of (5) hasmknown variables (peaks) and (3m+6)·n
unknowns, which must be determined (the indices and parameters of the cells).
The solution is not unique. To secure the uniqueness, we have to reduce the search region with the help of the restrictions on the maximum value of the direct unit cell volume, the maximum size of its edges, and the region of the admissible hkl-indices. Additionally one can profit from the fact that the Miller indices are integer numbers.
The method used to solve it is a combination of trials of integer Miller indices and an iterative process of the analytical minimization of the residual (5).
The autoindexing yields approximate estimates of the cell parameters and the setdHi j. The peak areas are connected with the atomic structure of the studied sample and can be used for the observation of the phase evolution; however, a much more powerful tool for the evaluation of the atoms is the Rietveld method.
5 The Rietveld method
An experimental time-of-flight diffraction spectrumy(t)) is written as follows:
y(t)=
n
i=1
ai·Ri(t)+B(t). (7)
Heretis the flight time channel,Riis the contribution of theith phase, andB(t) is the background.
Ri= nri
Hik
μHik·d
4
Hik· |FHik |
2·Mi
t−tHik
Wi+ci·d
. (8)
HereHikis the Miller index of thekth reflection of theith phase, andFHik is its structure factor (3); μHik is the multiplicity of theHikth reflection. Mi(t) is the intensity function of a reflection of theith
phase, andWiandciare parameters of its half-width.
With this parametrization we can now proceed to the parameter refinement by fitting the diffraction profile based on formula (8), i.e., minimizing the following functional for eachkth spectrum in the evoluting sequenceyk(t),
S2(Pk)= n
i=1 mi
j=1
in the available (from both sides) range of the cell and atomic parameters, as well as of other parame-ters – background, kinematic, accounting for absorption and extinction ones, half-widths of the peaks, magnetic, etc.
At each stagekof the evolution and at each iteration of the minimization process, we get from (9) a system of equations for the changes of the parametersΔP:
Mi jΔpi=Bj,
whereMi jis the matrix of the system, and the vectorBjis the antigradient of the functional (9). This
system is ill-conditioned, i.e., it is unstable to the data errors and to the inadequacy of the data models, which leads to a poor convergence of the iterations.
The following procedural steps can be undertaken to improve the output quality.
• Optimization of the parameter definitions. The replacement of the conventional unit cell param-eters by the modified ones,
p1i=a∗i2, p2i=b∗i2, p3i=c∗i2,p4i=2a∗i ·b∗icos(γ∗i), p5i=2a∗ic∗icos(β∗i), p6i=2b∗ic∗icos(α∗i),
results in a better conditionned matrix of normal equationsMi j.
• The condition of phase separability. Mathematically, this means that a successful phase sepa-ration by the fitting leads to minimal correlatedness of the phase reflections (in the ideal case the orthogonality), i.e., to the minimum of the expression
min(ni,nj)
l=1
wi jHilHjl,
whereHilandHjlare Miller indices of theith and the jth phases, andwi jare the weights, which are
inversely proportional to the reflection errors.
• Optimum control of the process of the analysis. There should be a preliminary qualitative sce-nario of the structural evolution of the sample. Particularly, it is assumed that the initial sample state is known, and also it is known which structural phases can appear and/or disappear in the process of the evolution. All this information should be stored in a special ini-file – a compact base of crystallographic data, and the management process itself should contain elements of an artificial intelligence system.
• Choice of the initial parameters for Rietveld analysis.There are three typical options:
– use of known a priori information (given within a certain confidence interval); this mode is suit-able if the non-stationary features are not too strongly pronounced in the process,
– the parameters of the current step of the evolution can be taken as initial values for the parameters of the next step. Such method allows larger fluctuations of the phase evolution than in the former case; here every previous evolution stage is preparatory to each subsequent one. Here the problem of reflection identification arises because slow peak fluctuations due to the cumulative effect can no longer correspond to the identifiers.
– In the case of a strongly nonstationary evolution a special algorithm is needed for generating initial values based on the detailed analysis of the physical contents of the data.
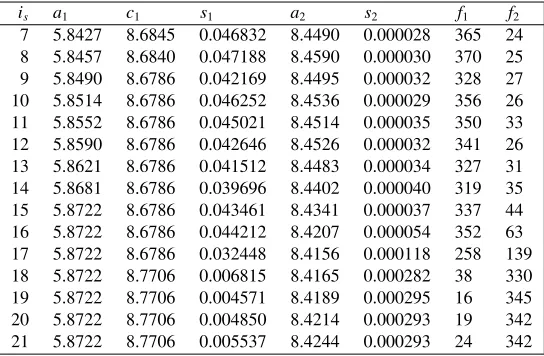
Table 1.Characteristics of the spectrumis
is a1 c1 s1 a2 s2 f1 f2
7 5.8427 8.6845 0.046832 8.4490 0.000028 365 24
8 5.8457 8.6840 0.047188 8.4590 0.000030 370 25
9 5.8490 8.6786 0.042169 8.4495 0.000032 328 27
10 5.8514 8.6786 0.046252 8.4536 0.000029 356 26
11 5.8552 8.6786 0.045021 8.4514 0.000035 350 33
12 5.8590 8.6786 0.042646 8.4526 0.000032 341 26
13 5.8621 8.6786 0.041512 8.4483 0.000034 327 31
14 5.8681 8.6786 0.039696 8.4402 0.000040 319 35
15 5.8722 8.6786 0.043461 8.4341 0.000037 337 44
16 5.8722 8.6786 0.044212 8.4207 0.000054 352 63
17 5.8722 8.6786 0.032448 8.4156 0.000118 258 139
18 5.8722 8.7706 0.006815 8.4165 0.000282 38 330
19 5.8722 8.7706 0.004571 8.4189 0.000295 16 345
20 5.8722 8.7706 0.004850 8.4214 0.000293 19 342
21 5.8722 8.7706 0.005537 8.4244 0.000293 24 342
6 Results of the analysis
We obtain the picture of the crystallographic phase evolution of the sample on the time (or directly on the external impacts – temperature, pressure, etc.), i.e. changes in the parameters of the unit cells, the atomic and thermal parameters, and the evolution of the different phase contributions to the total diffraction intensity.
The evolution of the magnetic moments of the atoms and the half-widths of the reflections may be of further interest.
As an example, we consider [3] the evolution of the polycrystalline compound in terms of the temperatureT in the range from 300 to 500 degrees Celsius. The table 1 shows how the evolution was proceeding. Here{a1,c1}and{a2}are parameters of the tetragonal and cubic unit cell respectively;s1
ands2are weights in the total scattering; f1, f2are their relative structure factors.
The table 1 points that the atoms of the both phases keep their characteristics approximately un-changed until the 17th spectrum where the tetragonal phase suddenly becomes insignificant, and a structural phase transition to the cubic phase occurs.
Acknowledgements
The work has been supported by the Russian Science Foundation (project N
14-12-References
[1] V.B. Zlokazov, Nuclear Instruments and Methods143, 1, 151–156 (1977)
[2] V.B. Zlokazov, V.K. Utyonkov, and Yu.S. Tsyganov, Computer Physics Communic.184, 428–431 (2013)
[3] A.M. Balagurov et al., Crystallography Reports58, 5, 710–717 (2013)