Characterization o f CD3^CD4CDS' (double negative) T cells
in patients with systemic lupus erythematosus (SLE).
b y
Arthi Anand
Department of Immunology
University College London Medical School
ProQuest Number: U643894
All rights reserved
INFORMATION TO ALL USERS
The quality of this reproduction is dependent upon the quality of the copy submitted. In the unlikely event that the author did not send a complete manuscript and there are missing pages, these will be noted. Also, if material had to be removed,
a note will indicate the deletion.
uest.
ProQuest U643894
Published by ProQuest LLC(2016). Copyright of the Dissertation is held by the Author. All rights reserved.
This work is protected against unauthorized copying under Title 17, United States Code. Microform Edition © ProQuest LLC.
ProQuest LLC
789 East Eisenhower Parkway P.O. Box 1346
ABSTRACT.
Systemic lupus erythematosus (SLE) is an autoimmune rheumatic disease
characterized serologically by B cell hyperactivity and a panoply of autoantibodies against nuclear, cytoplasmic and cell surface antigens. It is thought that T cells are involved in this process and more recently it has been suggested that the CD4 CDS', i.e.double negative (DN) T cells, might be important.
As a start to understanding the contribution of DN T cells to disease pathogenesis in SLE, the percentages of DN T cells were determined and it was found that a p but not yô DNT cells were significantly increased in patients with SLE when compared to rheumatoid arthritis (RA) (autoimmune controls) and healthy controls.
To further establish their participation in the autoimmune reactions in SLE, the activation markers expressed by the DN T cells were examined. It was found that HLA-DR and CD69, and co-stimulatory molecules CD28 and CTLA-4 were all expressed by
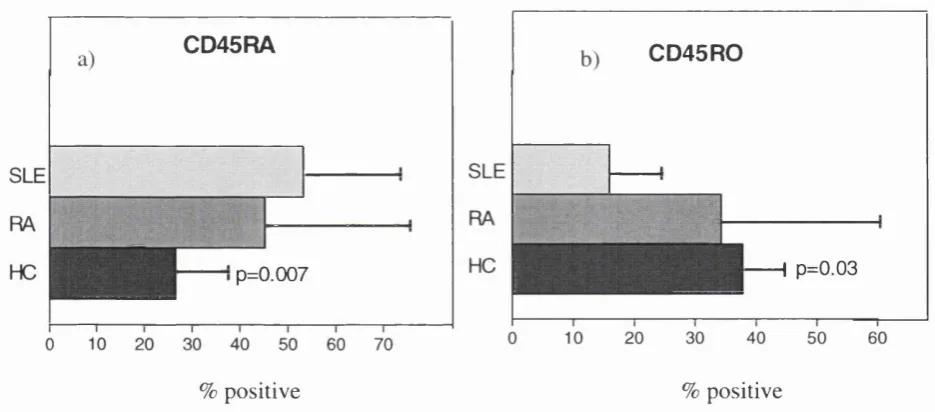
significantly higher percentages of DNT cells from patients with SLE, than those with RA or healthy controls (HC). More DN T cells from SLE patients were CD45RA^ than from
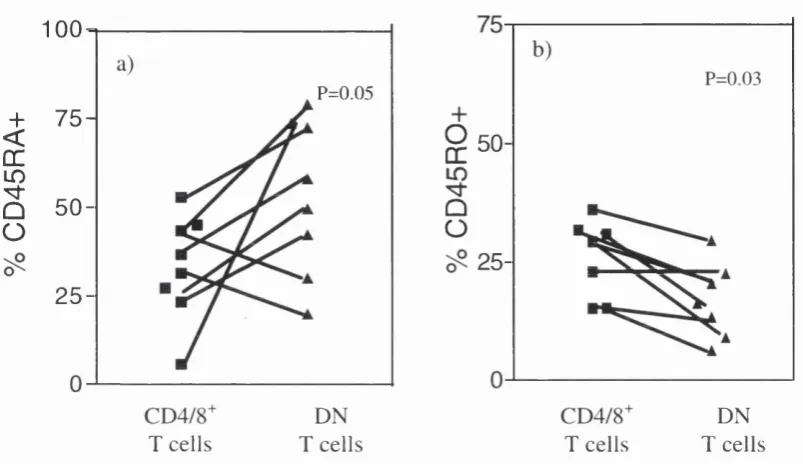
controls, while CD45R0^ were reduced. DN T cells in patients with SLE also showed a more activated phenotype than their CD4V CD8^ counterparts.
To understand the functional significance in SLE DNT cells, the percentages of SLE a p TCR^ DN T cells containing intracellular IL-4, a Th2 cytokine was determined. Higher percentages of SLE aP TCR DN"^ T cells contained IL-4 constitutively than RA or HC.
CONTENTS.
ABSTRACT
CONTENTS
TABLE OF CONTENTS
LIST OF FIGURES
LIST OF TABLES... 11
ABBREVIATIONS... 12
ACKNOWLEDGEMENTS... 14
REFERENCES... 161
TABLE OF CONTENTS.
CHAPTER 1
GENERAL INTRODUCTION
1.1 SYSTEMIC LUPUS ERYTHEMATOSUS... 16
1.1.1 Genetic factors... 17
1.1.2 Environmental factors... 21
1.2 CLINICAL ASSESSMENT OF S L E... 23
1.2.1 Clinical feature of S L E ... 24
1.2.2 Immunopathology... 25
1.2.3 Treatment of patients with S L E ... 26
1.3 AUTOANTIBODY PRODUCTION AND DISEASE MANIFESTATION... 28
1.3.1 Anti-DNA antibodies... 29
1.4 CELLULAR ABNORMALITIES IN S L E... 31
1.4.1 Role of B cells in S L E ... 33
1.4.2 Role of T cells in S L E ... 34
1.4.3 Primary T cell disorders in S L E ... 34
1.4.4 T cell-Antigen presenting cell interactions... 35
1.5 CYTOKINES IN SLE... 35
1.5.1 The Thl/Th2 paradigm: role in S L E ... 37
1.6 NUCLEOSOMES AS AUTOANTIGENS IN S L E... 38
1.7 APOPTO SIS... 40
1.7.1 Regulation of A poptosis... 42
1.7.2 Apoptosis dysregulation in S L E ... 44
1.7.3 The Fas receptor in S L E ... 44
1.7.4 Fas ligand in S L E ... 45
1.8 BCL-2 FAMILY OF GENES IN S L E... 45
1.9 IMPACT OF DEFECTIVE APOPTOSIS IN S L E ... 46
1.9.1 Impaired tolerance... 46
1.9.2 Activation induced cell d e a th ... 47
1.9.3 Clearence of apoptotic cells in S L E ... 47
1.10 DOUBLE NEGATIVE T C E LLS... 48
1.10.1 a p TCR^ double negative T c e lls ... 49
1.10.2 Functional characteristics of double negative T c e lls ... 51
1.10.4 Cytotoxic activity of a|3 TCR^ DN T c e lls ... 52
1.10.5 Suppressor/regulatory function of a p TCR^ DN T c e lls ... 53
1.10.6 Developmental origin of a p TCR^ DN T cells 54 1.11 apTC K " D N T CELLS: DO THEY HAVE A ROLE IN 55 SLE... 1.12 MAJOR AIMS OF THE TH ESIS... 56
CHAPTER 2 MATERIAL AND METHODS 2.1 M ATERIALS... 58
2.1.1 R eagents... 58
2.1.2 Monoclonal antibodies... 59
2.1.2.1 H ybridom as... 59
2.1.2.2 Directly conjugated antibodies... 59
2.1.2.3 Un-conjugated antibodies... 59
2.1.2.4 Isotype controls... 60
2.1.3 P lastics... 60
2.2. M ETH O D S... 61
2.2.1 Cell source... 61
2.2.1.1 Patients and controls... 61
2.2.1.2 Preparation of human peripheral blood mononuclear cells using density gradient separation... 62
2.2.2 Enrichment of double negative T c e lls ... 62
2.2.3 Immunofluorescence staining and flow cytom etry... 63
2.2.3.1 Double immunofluorescence staining of cells for flow cytometric analysis... 63
2.23.2 Three colour immunofluorescence staining... 64
2.2.3.3 Intracellular staining for bcl-2 family of proteins... 64
2.2.4 Measurement of apoptosis... 64
2.2.5 Flow cytometric analysis of mononuclear c e lls ... 65
2.2.6 Confocal microscopy of stained c e lls ... 65
2.2.7 T cell activation assays... 65
2.2.8 Intracellular staining for IL -4 ... 66
2.2.8.1 Constitutive levels of IL -4 ... 66
2.2.8.2 IL-4 levels after PHA stim ulation... 66
2.2.9 Statistical analysis... 67
CHAPTER 3 DN T CELLS IN PATIENTS WITH SLE 3.1 INTRODUCTION AND A IM S... 69
3.1.1 Introduction... 69
3.2 R ESU LTS... 72
3.2.1 Patients used in this stu d y ... 72
3.2.2 Enrichment of double negative T cells from P B M C ... 74
3.2.3 Confocal microscopy images of DN T c e lls ... 75
3.2.4 The total T cell population is not expanded in patients with SLE when compared to patients with RA or healthy controls... 77
3.2.5 Quantitation of double negative T cells in patients with SLE, RA and healthy controls... 78
3.2.6 Expanded population of circulating a p TCR expressing DN T cells in patients with S L E ... 79
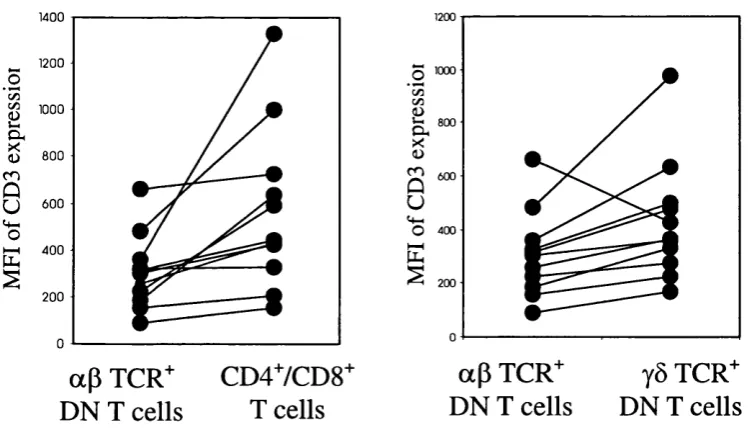
3.2.7 Density of CD3:TCR expression in DN T c e lls ... 81
3.2.8 Levels of yô"^ T cells in patients with SLE remain unchanged when compared to patients with RA and healthy controls... 82
3.2.9 Summary of results from chapter 3... 84
3.3 DISCUSSION... 85
3.3.1 T cells and DN T cells in S L E ... 85
3.3.2 a p TCR^ DN T cells in S L E ... 86
3.3.3 CD3:TCR complex on aP TCR^ DN T c e lls ... 86
3.3.4 yô T cells in S L E ... 87
3.4 CONCLUDING REMARKS... 87
CHAPTER 4 ACTIVATION STATUS OF DN T CELLS IN PATIENTS WITH SLE INTRODUCTION AND A IM S... 89
Introduction... 89
Expression of activation markers by T cells in SLE patients 89 C D 6 9 ... 90
H LA -D R... 91
CD28/B7 system of T cell costimulation... 91
C D 4 5 ... 92
In vitro T cell activation in S L E ... 93
A im s... 93
RESU LTS... 93
Patients used in this stu d y ... 93
Expression of surface markers on DN T cells of patients with S L E ... 96
DN T cells from patients with SLE are hypo-responsive to stimulation with phytohaemaglutinin(PHA) in in-vitro cultures.... 103
Summary of results from chapter... 106
4.3 DISCUSSION... 107
4.3.1 Activation status of SLE DN T c e lls ... 107
4.3.1.2 C D 6 9 ... 108
4.3.1.3 C D 2 8 ... 108
4.3.1.4 CTLA -4... 109
4.3.1.5 CD45RA and CD 45R 0... 110
4.3.2 DN T cells from patients with SLE are hypo-responsive to PHA 110 stim ulation... 4.4 CONCLUDING 110 REMARKS... CHAPTER 5 CYTOKINE SECRETION BY SLE DN T CELLS 5.1 INTRODUCTION AND A IM S... 112
5.1.1 Introduction... 113
5.1.1.1 Double negative T cells in SLE:cytokine p ro file... 113
5.1.1.2 Intracellular cytokine staining... 113
5.1.2 A im s... 114
5.2 RESU LTS... 114
5.2.1 Patients used in this stu d y ... 114
5.2.2 Production of IL-4 by a(3 TCR+ DN, CD4+ and CDS'" T c e lls 117 5.2.3 Quantitation of aP TCR'" DN T c e lls... 120
5.2.4 No correlation of IL-4 production with cell surface m arkers 121 5.2.5 IL-4 production and disease activity... 123
5.2.6 No association of constitutive IL-4 production with drug treatm ent... 123
5.2.7 IL-4 levels did not correlate with levels of plasma C3 or circulating anti ds DNA antibodies in patients with S L E ... 124
5.2.8 No association of IL-4 production with HLA phenotype... 124
5.2.9 Summary of results from chapter 5 ... 125
5.3 DISCUSSION... 126
5.4 CONCLUDING REMARKS... 129
CHAPTER 6 APOPTOSIS IN SLE DN T CELLS 6.1 INTRODUCTION AND A IM S... 131
6.1.1 Introduction... 131
6.1.1.1 Apoptosis in S L E ... 131
6.1.2 A im s... 133
6.2 RESU LTS... 133
6.2.2 Apoptosis in conventional (CD4^ /CD8^ ) T cells of patients with
SLE and healthy controls... 134
6.2.3 Apoptosis in DN T cells of patients with SLE and healthy controls... 135
6.2.4 There was no difference in the expression of surface Fas molecules between patients with SLE, RA and H C ... 137
6.2.5 Bcl-2 family of proteins: expression in double negative T cells ... 138
6.2.6 Bcl-2 expression... 139
6.2.7 Bcl-2/Bax ra tio ... 140
6.2.8 Bcl-x expression... 142
6.2.9 Summary of results from chapter 6 ... 144
6.3 DISCUSSION... 145
6.3.1 Apoptosis in DN T c e lls ... 145
6.3.2 Regulation of apoptosis in DN T c e lls ... 146
6.4 CONCLUDING REM ARKS... 148
CHAPTER 7 GENERAL DISCUSSION 7.1 T CELLS IN S L E... 150
7.2 DN T CELLS IN S L E... 151
7.3 ACTIVATION STATUS AND CYTOKINE PROFILE OF DN T CELLS IN S L E... 153
7.4 DN T CELLS IN SLE: APO PTO SIS... 156
7.5 THE ROLE OF DOUBLE NEGATIVE T CELLS IN SLE: FRIENDS OR F O E ?... 158
7.6 MODEL FOR PARTICIPATION OF DN T CELLS IN SLE DISEASE PATHOGENESIS... 160
LIST OF FIGURES.
Figure 1.1 Hypothetical pathway proposed by Wakeland et ah, illustrating SLE
susceptibility genes... 20 Figure 1.2 Model of interrelationship of Bcl-2 and Bax and the regulation of
programmed cell d eath ... 43 Figure 3.1 Representative fluorescence profiles of lymphoid cells stained for
CD3, CD4 and CDS markers, before and after enrichment of DN T
c e lls... 74 Figure 3.2 Confocal Images of enriched DN T cell populations stained with anti-
CD4 and anti-CDS-CyChrome (blue), and anti CD3-PE (red)
antibodies... 76 Figure 3.3 Percentage of total T cells in SLE, RA and healthy controls measure
by flow cytom etry... 77 Figure 3.4 The percentages of blood DN T cells in patients with SLE, RA and
H C ... 78 Figure 3.5 Representative histograms showing a p and yô TCR expression on
DN T cells 79
Figure 3.6 The percentages of a p TCR^ DN T cells are increased in SLE
patients compared with RA and H C ... 80 Figure 3.7 Mean fluorescence intensity (MFI) of CD3 expression on a p TCR^
DN T cells from patients with SLE was lower than values for yô
TCR^ DN T cells and C D 47 CDS" T cells 81
Figure 3.8 Percentages of yô TCR T cells are similar in patients with SLE, RA
and H C ... 82 Figure 3.9 Percentages of yô TCR^ DN T cells are reduced in patients with SLE
and RA compared to 83
H C... Figure 4.1 HLA-DR expression on DN T cells and C D 47 CDS" T cells in
p a tie n ts w ith SLE, RA a n d H C 97
Figure 4.2 CD69 expression on DN T cells and CD4"/ CDS" T cells in
p a tie n ts w ith SLE, RA a n d H C 99
Figure 4.3 CD28 expression on DN T cells and CD4"/ CDS" T cells in
p a tie n ts w ith SLE, RA a n d H C 100
Figure 4.4 CTLA-4 expression on DN T cells and CD4"/ CDS" T cells in
p a tie n ts w ith SLE, RA a n d H C 101
Figure 4.5 CD45 RA and CD45 RO expression on DN T cells in p a tie n ts w ith
SLE , RA a n d H C 102
T cells in patients with SLE 103
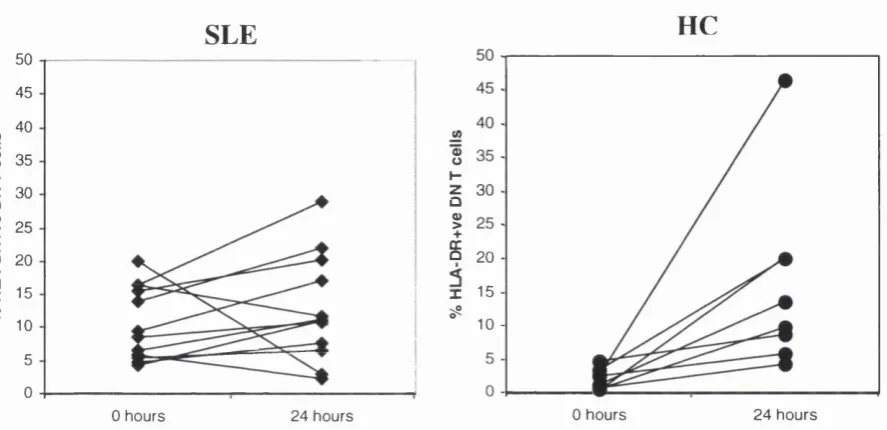
Figure 4.7 Percentages of HLA-DR^ DN T cells from patients with SLE and HC
24 hours after stimulation with P H A ... 104 Figure 4,8 Percentage increase in HLA-DR^ DN T cells from patients with SLE
and HC in culture, 24 hours after PHA stim ulation... 105 Figure 5.1 IL-4 production by a p TCR^ DN T cells in patients with SLE, RA
and H C ... 118 Figure 5.2 aP TCR^ DN T cells from patients with SLE, RA and HC expressing
IL-4 before and after stimulation with PHA in v itro... 119 Figure 5.3 Percentages of aP TCR^ DN T cells in patients with high and low
numbers of IL-4 producing c e lls ... 121 Figure 5.4 Relationship between activation marker expression and numbers of
high and low IL-4 expressing aP TCR^ DN T cells in patients with
S L E ... 122 Figure 6.1 Percentage apoptotic T cells in patients with SLE, RA and HC at
times 0, 24 and 48 h o u rs... 134 Figure 6.2 Programmed cell death in DN T cells in culture over 48 hours in
patients with SLE and H C ... 136 Figure 6.3 Fas^ DN T cells in patients with SLE, RA and H C... 137 Figure 6.4 Representative histograms of DN T cells stained for Bax, Bcl-x and
Bcl-2 proteins using intracellular staining techniques... 138 Figure 6.5 Percentages of Bcl-2^ cells in patiemts with SLE, RA and HC as
determined by intracellular immunofluoresence staining... 139 Figure 6.6 Mean fluoresence intensity (MFI) of Bcl-2 expression determined by
flow cytometry, in SLE, RA and HC DN T c e lls ... 140 Figure 6.7 Bcl-2/Bax MFI ratios of DN T cells from patients with SLE and HC
at time points 0, 24 and 48 hours in culture... 141 Figure 6.8 Bcl-x expression (MFI) by DN T cells from patients with SLE and
HC at time points 0, 24 and 48 hours in culture... 143 Figure 7.1 Proposed model describing the possible ways of DN T cell
LIST OF TABLES.
Table 1.1 Table 1.2 Table 1.3 Table 1.4 Table 1.5 Table 1.6 Table 1.7 Table 1.8 Table 3.1
Table 4.1 Table 4.2 Table 4.3 Table 5.1
Table 6.1 Table 6.2
Criteria for the diagnosis of S L E ... 16
Candidate genes and pathways implicated in S L E ... 19
Environmental factors that might play a role in S L E ... 23
Prevalence of autoantibodies in patients with S L E ... 28
Some major cellular abnormalities in S L E ... 32
Morphological and biochemical differences between apoptotic and necrotic cell d eath ... 41
The Bcl-2 family of pro- and anti- apoptotic proteins 42 Double negative TCR a p expressing peripheral T c e lls ... 51
Disease activity (global score) of patients with SLE studied in chapter 3 ... 73
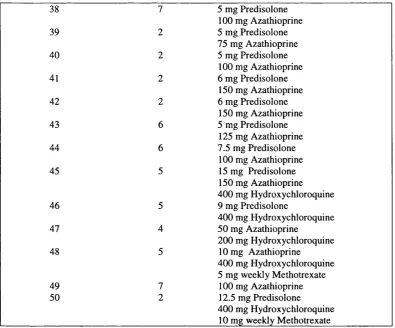
SLE patients and their treatm ents... 95
Correlation between HLA-DR expression and SLE patient criteria .... 98
Correlation between CD69 expression and SLE patient criteria 100 Disease activity (global score) of patients with SLE studied in chapter 5 ... 116
Percentages of apoptotic cells in culture at times 0, 24 and 48 hours ... 135 P-values for the lower cell death in the DN T cell population from
both SLE patients and healthy controls 136
ABBREVIATIONS.
a alpha
aP alpha beta
ACR American congress of Rheumatology
AICD Activation induced cell death
AITD Autoimmune thyroid disease
ALPS Autoimmune lymphoproliferative syndrome
AMP Adenosine mono phosphate
ANA Anti nuclear antibody
AO Acridine orange
APC Antigen presenting cell
ARA American Rheumatology Association
ATL Adult T cell leukemia
BSA Bovine serum albumin
C Complement protein
Ca Calcium
°C Degree Celsius
CD Cluster of differentiation
CTLA-4 Cytotoxic T lymphocyte Associated Antigen 4
DN Double negative
DNA Deoxy-ribonucleic-acid
ds Double stranded
ELISA Enzyme Linked Immunosorbent Assay
FI First generation
FACScan Fluorescence activated cell scanner
Fc Crystallizable fragment of the immunoglobulin molecule FcR Receptor for Fc region of immunoglobulin
FCS Foetal calf serum
FITC Fluorescein Isothiocyanate
FSC Forward light scatter
Y gamma
yô gamma delta
g Gravity
G Cell cycle growth phase
GBM Glomemlar Basement Membrane
GLU L-Glutamine
HC Healthy control
HIV Human immunodeficiency virus
HLA Human leukocyte antigen
Ig Immunoglobulin
IgG Immunoglobulin G
IgM Immunoglobulin M
IFN Interferon
IL Interleukin
kDa KiloDalton
M Mitosis
MFI Mean Fluorescence Intensity
MHC Major histocompatability complex
ml Millilitre
l^g Microgram
Microlitre
MoAb Monoclonal antibody
mRNA Messenger ribonucleic acid
NGF Nerve growth factor
NK Natural Killer
NKT Natural killer T cell
NMS Normal mouse serum
NSAIDs Non-steroidal anti-inflammatory drugs
NZB New Zealand Black
NZW New Zealand White
PBMC Peripheral blood mononuclear cell
PBS Phosphate buffered saline
PD-1 Programmed death 1 receptor
PHA Phytohaemagglutinin
PKA Protein kinase A
PMA Phorbol myristic acetate
RA Rheumatoid arthritis
RNA Ribonucleic acid
rpm Revolutions per minute
S Synthesis
SAP Serum amyloid P
sd Standard deviation
SLE Systemic lupus erythematosus
SS Single stranded
SSC Side scatter (90° light scatter)
TCR T cell receptor
Th T helper
TNF-a Tumour necrosis factor a
UV Ultra Violet
Yaa Y linked autoimmune accelerator
AKNOWLEDGEMENTS.
This work would not have been possible without the help and guidance of Professor Peter Lydyard, whose encyclopædic knowledge of immunology gave me an enthusiasm for the subject. My gratitude to Dr Mark Bodman Smith for teaching me the correct approach to practical bench work. A special thank you to Dr Gillian Dean for providing some of the data included in the chapter measuring IL-4 in double negative T cells. I am also deeply grateful to Professor David Isenberg for providing all the clinical blood samples, listening patiently to my results every week during the Monday evening meetings and also for kindly providing the financial support I needed to complete this work.
To everyone in the Bloomsbury Rheumatology unit I must say a huge “Thank You” for the enormous help in finding clinical samples for me. To Avery and Abigail, the nurses, for putting up with my constant interruptions into their busy Thursday morning clinics,
pestering for more samples, a mere thank you will not suffice. Special mention must also go to Jonathan Tyrell-Price for patiently collecting blood for all the research studies and all the
‘discussions’ which saw me through the PhD.
The whole of the Department of Immunology at UCLMS deserves my gratitude, for stoically allowing me to borrow consumables and reagents, and generously teaching me new techniques. They made it all fun. Special Thanks to Dr. Yvette Latchmann and Dr Peter Delves for going through the thesis and their helpful and encouraging suggestions.
To the British Council Overseas Research Scholarship Awards scheme for Universities and Colleges in the United Kingdom and The Arthritis Research Campaign for providing the funding which enabled me to pursue my PhD degree, I am deeply grateful.
My parents, who put up with my endless reading and questions, must take credit for instilling in me the importance of knowledge, and giving me a good education. Special thanks also to Ms.V. Bhuvaneshwari for nurturing my interest in biology.
Chapter 1.
General Introduction,
1.1: System ic lupus erythematosus.
Systemic lupus erythematosus is considered to be the prototypic systemic autoimmune rheumatic disease (Kotzin, 1996). It is a syndrome of complex multifactorial origin
characterised by inflammation and has the potential to involve any of the body’s organs or systems (Isenberg, 1993). The American Congress of Rheumatology (ACR) revised
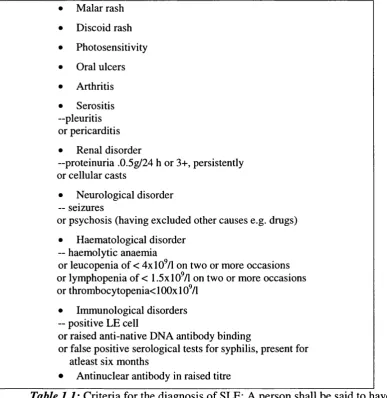
classification criteria were originally formulated to classify the heterogenous population of SLE patients: it is widely used as a diagnostic standard. A patient can be diagnosed with SLE if they serially or simultaneously exhibit four of these criteria. This classification ‘set’ gives a correct definition of SLE with 95% sensitivity and 85% specificity (Hahn, 1998). The criteria are summarised in table 1.1:
• Malar rash • Discoid rash • Photosensitivity • Oral ulcers • Arthritis • Serositis —pleuritis or pericarditis • Renal disorder
—proteinuria .0.5g/24 h or 3+, persistently or cellular casts
• Neurological disorder — seizures
or psychosis (having excluded other causes e.g. drugs) • Haematological disorder
— haemolytic anaemia
or leucopenia of < 4x 10^/1 on two or more occasions or lymphopenia of < 1.5x10^/1 on two or more occasions or thrombocytopenia< 100x10^/1
• Immunological disorders — positive LE cell
or raised anti-native DNA antibody binding
or false positive serological tests for syphilis, present for atleast six months
• Antinuclear antibody in raised titre
SLE is a disease that affects predominantly women (female to male ratio- 9:1) of childbearing age (peak age of onset is between 20 and 40) with an incidence of approximately
1:4000 in Caucasians. The incidence of SLE displays wide ethnic variations. For example, in the Birmingham area (circa 1995) the prevalence of SLE in females was 20.6:10,000 in Afro-Caribbeans, 9.1:10,000 in Asians and 3.6:10,000 in Caucasians (Johnston et a l, 1995). The equivalent ratios for males were 0.93:10,000, 2.6:10,000 and 3.4:10,000 respectively. Similar ratios have been described by other groups who sampled patient populations in the USA and Europe (Fessel, 1974; Hochberg and Petri, 1993). Studies in twins suggest a
concordance rate of between 30-70% for monozygotic twins compared to 3-15% for dizygotic twins. The fact that the concordance rate for monozygotic twins is not 100%, suggests that environmental factors have a role to play in addition to genetic factors in disease development (Isenberg, 1993; Isenberg and Horsfall, 1998).
1.1.1: Genetic Factors.
The genetic basis of lupus-like disease is remarkably complex, involving contributions from multiple genes in addition to the Class II MHC genes (Kotzin, 1996)
Multiple ethnic populations have been analysed for SLE susceptibility genes and three principles have
emerged:-a) For most ethnic populations, many susceptibility genes differ from those of other populations.
b) There are some single genes that predispose to disease across various ethnic groups.
c) Genetic predisposition is linked to auto antibody repertoires and clinical subsets of disease (Wakeland et a l, 2001 ).
The best-defined genes linked to SLE in humans are located on Chromosome 6 in the region that encodes the HLA genes. For example:
-HLA alleles A l, B8, DR3 - associated with lupus in Caucasians. HLA DR2 - associated with lupus in Japanese
Some non- HLA genes and inherited complement deficiencies also predispose to lupus, as does IgA deficiency (Isenberg and Horsfall, 1998). Deficiencies in the early classical pathway complement components C lq, C2 and C4 are strongly associated with the
development of a lupus like disease (Haq et al., 2002). Immunoglobulin G (IgG) receptors on mononuclear cells clear IgG and IgG containing immune complexes from the circulation. In Afro-American patients, associations have been found between SLE and the presence of low- affinity IgG receptors (Haq et al., 2002).
Proposed Mechanism Murine SLE Human SLE Antigen/Immune complex C lq knockout C lq
clearance
C2, C3 knockout C2, C3, C4
SAP knockout Mannose binding protein DNAase I knockout FcyRIIA
Serum IgM knockout FCyRIIIA
Fcy common chain DNAase I
knockout
Mer Knockout T cell receptor Ç chain
Lymphoid signalling SHP-1 knockout TNF-a
Lyn Knockout IL-10
Apoptosis
Lyn/Fyn double knockout CD22 knockout
BlyS transgenic PDl knockout IL-2 knockout CD45 E613R point mutation
G2A knockout IFN-y transgenic Fas knockout
Epitope modification
Fas-L knockout Bcl-2 transgenic Pten heterozygous deficiency
P21 cyclin dependent kinase knockout
a-Mannoside II knockout
Table 1.2: Candidate genes and pathways implicated in SLE. (Wakeland et a l, 2001)
Pathway 1
Loss of tolerance to nuclear antigens
Susceptible individuals
Slel, C lq, C4, SAP, DNAase
V
Anti-nuclear antibodies
Pathway 2
Dysregulation of the immune system
Sle2, Sle3, Fas, Fas-L, Yaa, Lyn, BlyS, IL-2, PD-1
Pathogenic autoinununity
Pathway 3
End organ targeting
Vasculitis
V
Fcylll, Sleld, Sle6
Nephritis Neurological Arthritis
disorders
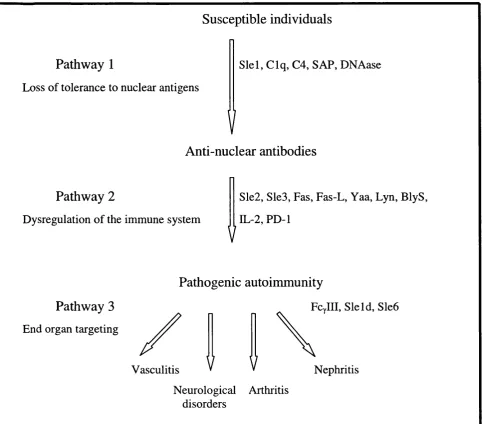
Figure 1.1: Hypothetical pathway proposed by Wakeland et al., illustrating the manner in which individual susceptibility genes interact to potentiate severe autoimmunity.
Sle: Systemic lupus erythematosus susceptibility foci. C: complement protein.
SAP: Serum amyloid P component. Yaa: Y-linked autoimmune accelerator. Lyn: Src family tyrosine kinase.
BlyS: B lymphocyte stimulator. PD-1: Programmed death 1 receptor. IL-2: Interleukin 2.
1.1.2: Environmental factors.
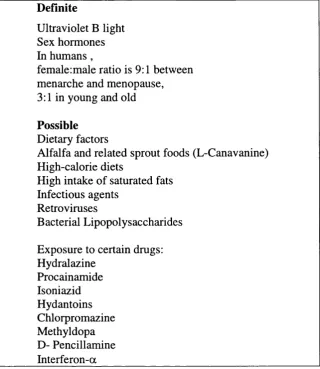
Environmental influences on the expression of disease manifestations are clearly seen in SLE and those that may play a role are summarised in table 1.3. Of these factors the two most influential are UV light and sex hormones. It has been reported that up to 70% of SLE patients have disease flared by exposure to UV light (Kelley, 1990). A possible explanation for this is that UV light increases thymine dimérisation, which renders the DNA more
immunogenic. More recently the ability of UV light to trigger apoptosis has been highlighted (discussed in section 1.9.3).
The predisposition of the disease to affecting women of child bearing age is not well understood. Estrogens are believed to play a role in the etiology of both human and murine SLE (Lahita, 1999). Sex hormones have been shown to augment CDS and CD4 lymphocyte- mediated cytolysis, to enhance production of IFN-y and IL-10 by Thl and Th2 cells,
respectively (Kammer et al, 1998). Rider et al, have reported that T cells from patients with SLE, but not normal or disease control cells, responded to estrogen by significantly increasing the amounts of calcineurin transcripts and calcineurin phosphatase (CN) activities (Rider et a l, 1998). Calcineurin is a pivotal phosphatase in the biochemical cascade that conveys a signal from the T cell antigen receptor to the nucleus. The hypothesis proposed is that altered
calcineurin regulation is a component of a primary T cell disorder encoded by multiple abnormal genes, manifested by T cell dysfunction, and resulting in increased autoimmunity (Kammer et a l, 1998). Recent research also suggests that estrogen acting through the estrogen receptor, enhances T cell activation in women with lupus resulting in amplified T-B cell interactions, B cell activation and autoantibody production (Rider and Abdou, 2001). Studies in mice also show that estrogen administration activates extrathymic T cell differentiation in the liver (Okuyama et a l, 1992). The resulting T cells have unique characteristics such as autoreactivity and might in part, explain the female predominance of autoimmune diseases (Okuyama e ta l , 1992).
Drug-induced lupus was first recognised almost 50 years ago in association with hydralazine therapy, and numerous medications have been implicated in the de novo induction of rheumatological symptoms (Rubin, 1999). Drug-induced lupus has some features common with SLE and characteristically develops in people who have no history of systemic rheumatic disease. Medications currently in use and associated with at least several reports of lupus like syndrome are listed in table 1.3. The highest risk drugs are procainamide and hydralazine
(Rubin, 1999, loannou et al, 2002). In vivo metabolites of the drugs rather than ingested medication are thought to be responsible for the initiation of autoimmunity. The proposed mechanisms for autoantibody induction by lupus-inducing drugs
include-• Drug-altered B cell and/or T cell autoepitope, • Drug directly activates B and /or T lymphocytes,
• Drug-specific T cells activate autoreactive B cells presenting drugs, and • Drug prevents establishment of immune self-tolerance (Rubin, 1999).
Definite
Ultraviolet B light Sex hormones In humans ,
female:male ratio is 9:1 between menarche and menopause, 3:1 in young and old
Possible
Dietary factors
Alfalfa and related sprout foods (L-Canavanine) High-calorie diets
High intake of saturated fats Infectious agents
Retroviruses
Bacterial Lipopolysaccharides Exposure to certain drugs: Hydralazine
Procainamide Isoniazid Hydantoins Chlorpromazine Methyldopa D- Pencillamine Interferon-a
Table 1.3: Environmental factors that may play a role in SLE (Kelley, 1990)
1.2: C linical assessm ent o f SLE.
SLE is a complex multi-system disease. This complexity makes the disease difficult to monitor. In particular, there are problems in quantifying disease activity in the various
organs/systems, and in differentiating potentially reversible organ dysfunction (due to active disease) from irreversible organ damage (Hay et a l, 1993). More than 60 scales for measuring clinical disease activity in patients with SLE have been developed and used in a variety of studies but few have been validated ot shown to be reliable (Hay et a l, 1993). Some of the most frequently used, validated global score systems are: the European Consensus lupus activity measure (ECLAM), systemic lupus erythematosus disease activity index (SLEDAI), systemic lupus activation measure (SLAM), and lupus activity index (LAI). In contrast the
British Isles Lupus Assessment group (BILAG) index provides an ‘at a glance’ view of activity in eight organs/systems. It is based on the ‘physicians intention to treat’ principle.
A number of studies of the SLEDAI, SLAM and BILAG disease activity indices have shown that the three indices are comparable and reproducible for evaluating disease in SLE (Gladman et a l, 1992; Vitali et a l, 1992). Most recently, when all these scores were used to assess a cohort of 19 patients, who were assessed fortnightly for 40 weeks, there was a statistically significant correlation between the results obtained from each score. During the study, 16 of the patients experienced a 96% or greater change in their disease activity as measured by the BILAG score (Ward et a l, 2000).The BILAG score was used to assess each patient included in this thesis (Hay et a l, 1993). The BILAG index is a computerised index for measuring clinical disease activity in SLE. The index allocates alphabetic scores (A-E) to each of the eight organs/systems (general, muco-cutaneous, neurological, musculoskeletal,
cardiorespiratory, vasculitis and thrombosis, renal, haematological). The most active state is given an A grade while the complete absence of disease activity during the course of the disease gets an E. These individual organ grades were converted into a global score, with grade A=9, B=3, C=1 and D&E =0. A patient with a global score of more than or equal to 6 is
regarded as having active disease and 0-5 inactive disease.
1.2.1: Clinical feature o f SLE.
SLE has the potential to involve multiple organ systems directly, and its clinical manifestations are extremely diverse and variable. Musculoskeletal and dermatological
involvement are the most common manifestations of lupus, with more than 90% of the patients having one or both systems affected (Haq et a l, 2002).
Arthralgia (90%), myalgia (50%), and tenosynovitis (20%) are common features in the musculoskeletal system. Avascular necrosis of the bone causes major morbidity in SLE and is associated with corticosteroid use. Osteoporosis is another major complication of SLE. It may result from lack of vitamin D caused by sun avoidance, menstrual cycle dysfunction from disease or treatment, corticosteroid use or lack of exercise (Haq et a l, 2002).
The heart and lungs are often involved - shortness of breath, pleurisy and pleural effusions are seen in about half of patients (Kelley, 1990). Pulmonary hypertension in SLE may result from multiple factors such as vasculitis, thrombosis and pulmonary artery
is associated with the presence of lupus anticoagulant and antiphospholipid antibodies and patients may need lifelong anticoagulation (Haq et a l, 2002).
Gastrointestinal system symptoms are common in SLE. Anorexia, nausea and vomiting occur in up to half of the patients (Haq et a l, 2002). Sjogren’s syndrome may coexist with SLE and can cause gingivitis, accelerated dental caries and oral infections such as candidiasis (Haq et a l, 2002). Patients with SLE are at risk of peptic ulcer disease from the use of non steroidal anti-inflammatory drugs (NSAIDs) and corticosteroids (Haq et a l, 2002).
Until recently, renal disease was the major cause of death in SLE, and 30% of patients develop significant renal disease (Haq et a l, 2002). Symptoms can be minimal until substantial kidney damage has occurred (Haq et a l, 2002). The immunosuppressive therapies used to treat the involvement of the kidneys add greatly to the morbidity and mortality of SLE patients (Zimmerman et a l, 2001).
Skin involvement is another conunon occurrence and up to 40% of patients have characteristic butterfly rash- essentially a photosensitive vasculitis over the malar bones and bridge of the nose. Patients also show maculopapular discoid lesions and vasculitis lesions on fingers and toes (Haq et a l, 2002). The commonest causes of death from SLE are infection, malignancy or atherosclerosis (Kelley, 1990).
1.2.2: Immunopathology.
The result of interactions between susceptibility genes and triggering environmental factors is the development of an abnormal immune response characteristic of SLE. The primary pathogenic components responsible for causing SLE are elusive, because the primary immunogens that trigger the auto-immune response in the disease have not been clearly identified (Datta, 1998).
The common denominator among SLE patients is Immunoglobulin G (IgG)
autoantibody production, and in particular the elevated serum levels of antibodies to nuclear constituents (i.e., anti-nuclear antibodies or ANAs)(Kotzin, 1996). Raised dsDNA antibody titres were found in 60% of the patients in a study of a cohort of 300 patients by Isenberg et al (Haq et a l, 2002). dsDNA antibodies are closely related to renal disease and an increase in titre, particularly if it is associated with decreasing C3 levels, alerts the clinician to a possible flare of disease (Haq et a l, 2002). These pathogenic autoantibodies are an effect of hyper
activity of auto-reactive B and T cells and the failure of the immunoregulatory circuits to control their activity (Kotzin, 1996).
1.2.3: Treatment o f patients with SLE.
Successful therapy of patients with SLE depends upon targeting both the symptoms and the underlying infection. Both pharmacological and non-pharmocological therapies are used to treat patients with SLE (loannou et al., 2002). The pharmacological management of patients with SLE presently revolves around four main classes of drugs, often in combination. These are:
• Non-steroidal anti-inflammatory drugs (NSAIDs).
• Anti-malarials.
• Corticosteroids.
• Cytotoxic drugs.
Patients with mild lupus are generally treated with a combination of NSAIDs and antimalarial drugs such as a hydroxychloroquine (Plaquenil) (loannou et al, 2002). Low doses of
corticosteroids are used when NSAIDs and antimalarials have failed to control symptoms of arthralgia/arthritis or rash sufficiently (loannou et al., 2002). Treatment of patients with major organ involvement involves broad spectrum immunosuppression with cytotoxic agents
(Zimmerman et al, 2001). The drugs most frequently employed are azathioprine or cyclophosphamide together with corticosteroids, often in high doses. The use of
cyclophosphamide, however, is limited by its side effect profile of profound nausea, alopecia, infertility especially in patients over the age of 30 and bone marrow suppression (loannou et al, 2002). The Bloomsbury rheumatology clinic, attended by patients studied in this thesis were treated with oral prednisolone, with azathioprine in mild to moderately active lupus, reserving pulsed cyclophosphamide (intravenous pulses of cyclophosphamide) for severe renal involvement (loannou et a l, 2002).
conclusive advantage of this form of treatment has emerged from clinical studies, and limitations in its use include a “rebound” synthesis of autoantibodies, technical difficulties requiring central venous access with associated complications, patient discomfort and being an expensive form of therapy (Zimmerman et al, 2001, loannou et al, 2002). Dietary therapy in the form of calorific and in particular fat restriction is beneficial to patients, as is total zinc reduction (loannou et a l, 2002). Studies have also shown the beneficial effects of a diet low in saturated fat combined with fish oil supplementation over a six-month period (Walton et al,
1991). Calorie restriction, however, has no place in the patient with severely active lupus with major organ damage, as these patients tend to be acutely unwell and hence in a hypercatabolic state (loannou et a l, 2002). Intravenous immunoglobulin therapy has an established role in lupus patients with severe thrombocytopenia or immune neutropenia (loannou et al, 2002). The intravenous administration of human immunoglobulin (Ig) could ameliorate symptoms by solubilizing immune complexes deposited in the kidney or by blocking Fc receptors on
immune effector cells or mesangial cells of the kidney glomerulus (Zimmerman et al, 2001). Recent evidence has also demonstrated that cyclosporin (CsA) in low doses (2.5-5mg/kg/day) may provide reasonable disease control and offer the opportunity for reduction in steroid over long term follow up (loannou et a l, 2002). Cyclosporin selectively inhibits T-cell function by blocking transcription of specific cytokines such as IL-2 and IFN-y (Marilyn et al., 2002). The primary concern about the use of cyclosporin has been the potential for long-term
nephrotoxicity, although other reversible side effects include hypertension, gingival hyperplasia and hypertrichosis (Zimmerman et al, 2001).
Greater understanding of the immunopathogenic dysregulation characterising lupus in recent years, has enabled the development of targeted therapy to interfere with this
dysregulation at various levels. Reagents near or at clinical trial phase include biological treatments developed to modulate or inhibit T cell activation (CTLA-4Ig, anti-CD40 ligand, anti-B7 monoclonal antibodies), T and B cell collaboration, anti-dsDNA antibody production (anti-CD20 mouse/human chimeric antibody monoclonal antibody), deposition of anti-dsDNA antibody complexes (DNase), complement activation/deposition (anti-complement 5
monoclonal antibody), and cytokine activation (anti-IL-10 antibody, recombinant IL-1) (loannou et a l, 2002, Marilyn et al., 2002).
1.3: A utoantibody production and disease manifestation.
The principle targets for the autoantibodies produced in SLE include protein-nucleic acid complexes, notably ds and ss DNA, histones and nucleosomes, the U 1 and Sm small nuclear ribonucleoprotein(snRNP) particles and the Ro/SSA and La/SSB RNP complexes(Tan,
1989). Autoantibodies to phospholipids (complexed to p2 glycoprotein 1) are also relatively frequent and associated with thrombotic complications. A separate group of autoantibodies in SLE are directed to cell surface molecules, causing haemolytic anaemia and platelet
destruction (thrombocytopenia)(Kotzin, 1996). The mechanisms by which most autoantibodies in lupus may cause disease is unclear. Anti-nuclear antibodies may on occasion penetrate cellular membranes and cause disease by binding to their intracellular targets (Alarcon-Segovia
et al, 1979). More often it is believed that, the disease manifestations such as lupus nephritis, arthritis, and vasculitis may due to the formation of immune complexes.
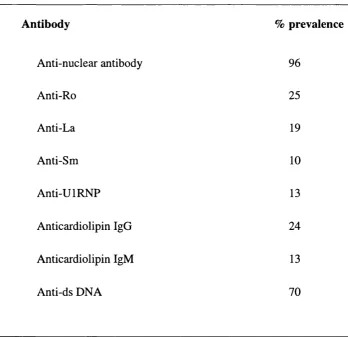
Antibody % prevalence
Anti-nuclear antibody 96
Anti-Ro 25
Anti-La 19
Anti-Sm 10
Anti-UIRNP 13
Anticardiolipin IgG 24
Anticardiolipin IgM 13
Anti-ds DNA 70
Anti-double stranded DNA (anti-ds DNA abs) antibodies are the most prevalent form of anti-nuclear antibody (ANA) in SLE patients (Table 1.4). Genetic studies indicate that anti- dsDNA antibodies derive from an antigen selective stimulus (Radie and Weigert, 1994). These antibodies are usually oligoclonal, somatically mutated, and their V regions contain structures that are selected by, and bind to, double stranded DNA (Rekvig et a l, 1997). In contrast to anti-single stranded DNA antibodies (anti-ssDNA abs), anti-ds DNA antibodies are very rarely found in any disease other than SLE (Koffler et a l, 1971; Isenberg and Collins, 1985). Since, anti-dsDNA antibodies are common in, and specific to, SLE they represent a good candidate as a pathogenic factor in SLE. Therefore, their structure and relationship with disease activity needs to be characterised. The association of anti-ds DNA antibodies as one of the pathogenic factors in SLE is well established although while some studies find a strong correlation, particularly with vasculitis and glomerulonephritis, others find a weaker link (Esdaile et a l,
1996; Petri et a l, 1991). The disparity in the results of the various studies may be due to:
1. the differences in the detection methods used,
2. missing the expansion in antibody levels as they are sequestered to target organs (e.g., kidney) or
3. that in a particular cohort of patients tested there is no association.
It is however, generally agreed that rising anti-ds DNA titres increase the risk of disease exacerbation in the following 8-10 weeks by a factor of 2-3 (Hahn, 1998).
13.1: Anti-DNA antibodies.
Normal individuals produce “natural” anti-DNA antibodies of IgM class in high frequency (Datta et a l, 1986). In drug-induced lupus or patients with macroglobulinaemia, high levels of anti-DNA antibodies usually binding to ssDNA rather than dsDNA are produced with no disease manifestations as in SLE (Lahita et a l, 1979; Pisetsky et a l, 1990). Anti- histone antibodies are also a common feature of drug-induced lupus (Rubin, 1999).
In contrast to the natural (IgM) antibodies, pathogenic (e.g., nephritogenic) anti-DNA antibodies are of the IgG class (Theofilopoulos et a l, 1989). These IgG antibodies are cationic as described in murine models and accompany the onset of murine lupus nephritis (Furukawa,
1997; Datta et a l, 1987). The cationic anti-DNA antibodies and or cationic immune complexes
may form persistent immune deposits in glomeruli when injected into normal mice whereas the anionic (or neutral) antibodies and immune complexes do not persist (Shivakumar et a l, 1989). Thus, deposition of immune complexes consisting of cationic anti-DNA autoantibodies may initiate the renal lesions of lupus nephritis, which may then be followed by the deposition of anionic or neutral autoantibodies (Gavalchin and Datta, 1987). The nephritogenic potential of cationic anti-DNA antibodies or cationic immune complexes probably arises from their affinity for the glomerular anionic sites that are constituted by negatively charged proteoglycans (Datta
et a l, 1987). Deposition of antibodies on the glomerular basement membrane results in
recruitment of complement components and engagement of Fc receptors either on renal cells or on circulating monocytes (Schiffer et a l, 2002). This deposition precipitates an inflammatory cascade in which upregulation of adhesion molecules and renal inflammatory chemokines attracts more lymphoid cells upregulation of lymphoid derived chemokines enhances influx of cells into the kidney. Release of cytokines and other inflammatory mediators results in tissue damage that finally leads to irreversible cell death (Schiffer et al, 2002).
Isolated B cells from both active and inactive lupus patients spontaneously produced markedly increased levels of total polyclonal IgG as compared to normal subjects but only B cells from active patients could produce pathogenic (cationic) anti-DNA autoantibodies with the help of autologous T helper cells (Shivakumar et a l, 1989). These cationic anti-DNA antibodies produced by B cells (cultured in-vitro) isolated from patients with SLE with active disease (lupus nephritis) are found to be strikingly restricted in spectrotype. This observation indicates that the Th cells (T helper cells) help an oligoclonal population of B cells that are committed to produce this pathogenic variety of autoantibodies in patients with active disease. Studies in murine models of lupus nephritis have also shown that the pathogenic (cationic) variety of anti-DNA antibodies share a common antigenic specificity pattern and cross-reactive idiotype. These antibodies are distinct from nonpathogenic (natural) autoantibodies, indicating that they are produced by a select and oligoclonal population of B cells (Gavalchin and Datta,
1.4: C ellular abnorm alities in SLE.
Studies show that the cellular immune disorder of SLE is complex including
multicellular dysfunction of all mononuclear leukocytes, including monocytes, macrophages, natural killer cells, B lymphocytes and T lymphocytes (Dayal and Kammer, 1996). Some of the major cellular and cytokine abnormalities in SLE are briefly summarised in table 1.5. In general, T and B cells manifest evidence of intense in vivo activation, but are hypo-responsive to exogenous antigens in vitro (Cohen, 1993).
Cells
Monocytes/Macrophages
Lymphocytes
B cells
T cells
Defect
Decreased TN F-a production
Increased numbers of activated B cells
Hypergammaglobulinaemia, with a wide range of autoantibodies
Increased CD25 expression
Decreased CRl expression
Increased cytoplasmic and surface expression of hsp90
Decreased numbers of CD4^ CD45RA^cells
Increased numbers of activated T cells (HLADR^)
Increased numbers of a p TCR^ DN (CD3^CD4 CDS ) T cells
Increased and prolonged expression of CD40L on T cells
Defective supression/regulation
Impaired cytotoxicity
1.4.1: Role o fB cells in SLE.
B cells play a pivotal role in SLE. They are the source of the pathogenic autoantibodies, some of which may be harmful, others may serve as potentially useful
diagnostic markers (Cohen, 1993). Their role is not limited to secretion of autoantibodies and it seems unlikely that SLE is solely an immune complex mediated disease. Under certain conditions, B cells can activate memory T cells, and process and present self antigens to naïve T cells, implying the existence of an antibody-independent mechanism for tissue injury in systemic autoimmune diseases, such as lupus (Zouali, 2002 ).
It is evident that switching of both antibody isotype and idiotype may be involved in the immunopathology of lupus. IgG antibodies are more pathogenic than IgM and certain idiotypes (e.g. Id 16/16) have been found in the serum of the majority of lupus patients and in many renal biopsies (Haq et al, 2002).
There is often a marked increase in the numbers of plasma cells in the peripheral blood and in the numbers of B cells at all stages of activation (Kelley, 1990). Studies of twins and family members have shown that such increased numbers can precede a clinical disease (Kelley, 1990).
In mice, polyclonal activation of B cells precedes the accumulation of high avidity single autoantigen specific B cell repertoire that characterises well-developed disease (Kelley, 1990). This suggests that B cells in mice are subject to both increased polyclonal and specific activation (Dziarski, 1988). Individual autoantibody repertoires vary from person to person- although all have ANA’s, some have anti-dsDNA antibodies, others have anti-Ro antibodies etc (Kelley, 1990). Hence it is likely that many B cells are activated by specific autoantigens although the basis for this hyperactivity is unknown. However, it has been reported that SLE B cells are more easily activated and driven to mature by cytokine stimulation than B cells from normal individuals. For example, B cells from SLE patients are more easily driven to
differentiate by IL-6 than are normal B cells (Kelley, 1990).
1.4.2: Role o f T cells in SLE.
B cell hyperactivity and autoantibody production are considered to be central to the pathophysiology of SLE. T cells have been postulated to have a major role in driving the SLE associated B cell hyperactivity based on observations that:
• Much of the pathology in SLE is mediated by autoantibodies of the IgG class, a T cell dependent response (Cohen, 1993; Via et al., 1993; Spronk et al., 1996)
• In vivo manipulations in murine SLE which reduce or inhibit T cell numbers and /or function have been shown to improve disease parameters (Via et al., 1993; Wang et al.,2002 )
• There is an association of SLE with particular class II major histocompatability complex (MHC) alleles (Kotzin, 1996)
The specificities of the autoreactive T cells, however have not been well characterised and the nature of T cell help in SLE may differ from conventional responses. The emergence of these autoimmune T and B cells in SLE is probably determined by genetically programmed defects of the immune system. Environmental and other endogenous factors may play a secondary role in lupus as non-autoimmune subjects are also exposed to the same factors (Datta, 1998). The question remains whether the T cell dysfunction in SLE reflects an intrinsic disorder(s) and/or a faulty interaction between antigen presenting cell (APC) and T cell.
1.4.3: Primary T cell disorders in SLE.
Studies demonstrating both biochemical and functional abnormalities in T cells from patients with SLE have led to the hypothesis of a primary T cell disorder in SLE. This primary T cell disorder could result in altered regulation and/or expression of genes that impair T cell immune effector functions. Although substantial gaps in the knowledge of the primary T cell disorders remain, dysfunctional signalling has been identified in both the adenyl
altered PKA function or decreased IL-2 production reported in SLE (Tsokos, 1996). The presence of these defects in the T cell signal transduction system could significantly modify the T cell’s capacity to express particular genes in response to certain stimuli resulting in altered gene expression. Altering gene expression of cytokines for example, could potentially lead to a shift in the predominant T cell cytokine pattern (e.g., T hO ^ Th2 switch), hindering
physiological T cell effector and regulatory function.
1.4.4: T cell -Antigen presenting cell (APC ) interactions in SLE.
Defects in antigen presenting cell surface molecule expression and function have been reported in patients with SLE (Tsokos et al., 1996). Abnormal APC function has been supported by studies evaluating the response of T cells from patients with SLE to the recall antigen influenza virus and alloantigens (Via et a i, 1993). Studies showing that the need for APC delivered co-stimulation is bypassed by effectively cross-linking CD28 or CD26 T cell surface molecules also point to impaired APC function (Sfikakis et al., 1994; Plana et al., 1994). APCs from patients with SLE have also been found to be defective in their expression of the B7-1 (CD80) costimulatory molecule. Resting normal APCs do not express B7-1, but treatment with interferon gamma (IFN-y) induces its expression. APCs from SLE patients failed to express surface B7-1 following stimulation with IFN-y and this defective expression is thought to be responsible for the decreased response of lupus T cells to recall antigens (Tsokos et a l, 1996; Scheinecker et al., ).
1.5: Cytokines in SLE.
The development of an effective immune response involves lymphoid cells,
inflammatory cells, and haematopoietic cells. The complex interactions among these cells are mediated by a group of secreted low-molecular weight proteins that are collectively called cytokines to denote their role in cell to cell communication.
Cytokines play an essential role in moulding the quality of immune response to foreign or self-antigens. These mediators have been classified according to their cellular source and effector functions, with the Thl and Th2 families best illustrating this division of labour. The Thl cytokines include IL-2 and interferon-y (IFN-y), which in general promote delayed-type hypersensitivity responses by induction of T cell proliferation and monocyte activation. The
Th2 cytokines include IL-4, IL-5, IL-6 and IL-10 and promote humoral immune responses (Singh et a l, 1999; Van Eden et a l, ). T cells expressing cytokines of both patterns have been designated ThO. ThO cells represent a heterogeneous population of partially differentiated effector cells comprising multiple discrete subsets that can secrete Thl and Th2 cytokines (Romagnani, 1997). Furthermore, T cells producing transforming growth factor-^ (TGF-P), IL-4 and IL-10 have been described as Th3 cells, and are considered regulatory cells that can act to induce immune tolerance (Dean et a l, 2000 )
Cytokines have been suggested to play an important role in the immune dysregulation observed in patients with SLE and murine lupus prone strains. The abundant data on the expression, activity, or response to different cytokines in patients or murine models have been controversial (Horwitz and Jacob, 1994; Singh et a l, 1999; Dean et a l, 2000 ).The analysis of cytokines in disease states, in general, has been complicated by variable results derived from studying serum levels, secretion into culture supernatants or ex vivo analysis of intracellular mRNA or proteins (Horwitz, Stohl,Gray, 1997). Cytokine abnormalities in patients with SLE were first documented in studies of D F N - a , the first cytokine to be described. IFN-a now has been shown by several groups to be elevated in sera from patients with SLE, although the cellular source and stimulus for the production of that cytokine are not yet defined (Hooks et a l, 1982). It is important to note that cytokine production is not only changed in patients with SLE when compared with autoimmune disease controls (RA) or healthy subjects, but also changes with different disease phenotypes. For example, IL-6 seems to be increased in the cerebrospinal fluid (CSF) of patients with central nervous system (CNS) involvement in SLE but not in patients with SLE who lack neurological symptoms (Dean et a l, 2000 ). It may be that as in other inflammatory diseases, the balance of cytokines is more important in
1.5.1: The Thl/Th2 paradigm : role in SLE.
Thl and Th2 T cells were first described by Mosmann et ah, who discovered that T cells could be conveniently divided into two subsets, Thl and Th2, with distinct arrays of cytokine secretion patterns and functions (Mosmann et ah, 1996; Mosmann et al., 1986). A hypothesis was subsequently formulated according to which cell-mediated autoimmune diseases such as insulin-dependent diabetes mellitus are induced by Thl cells and their cytokines and humoural-mediated autoimmune diseases are mediated by Th2 cells and their cytokines.
The respective contributions of Thl and Th2 cytokines to the pathogenesis of SLE are still a matter of debate. Several Th2 cytokines, e.g., IL-6 and IL-10, are known to promote antibody formation by B cells, supporting the hypothesis that Th2 cells play an active role in the development of autoantibody-mediated autoimmune diseases such as SLE (Romagnani,
1997; Kirou and Crow, 1999; Horwitz and Jacob, 1994; Dean et a l, 2000 ). Further,
treatment of MRL-lpr lupus prone mice with IL-4R or anti-IL-4 antibodies resulted in reduced mortality and disease (Nakajima et a i, 1997; Schorlemmer et a l, 1995). In addition,
administration of IL-6 promoted and anti IL-6 inhibited disease in the MRL-lpr lupus prone mice (Ryffel et a l, 1994; Finck et a l, 1994). However, immune responses involving the Thl phenotype have also been found in the both patients with SLE and in murine models of lupus (Theofilopoulos et a l, 2001 ; Kirou and Crow, 1999). For example, exacerbation of SLE by repeated injections of IFN-y, and inhibition by anti-IFN-y antibodies in (NZBxNZW) Fi hybrid mice, suggest the involvement of Th-1 type cells in the spontaneous development and
progression of SLE (Jacob et a l, 1987). Further support for a pathogenic role for the Thl cytokine IFN-y was the demonstration that MRL/lpr mice lacking IFN-y or IFN-y receptor had no glomerulonephritis (Schwarting et a l, 1998). A kinetic study of disease progression in various strains of MRL mice correlated disease with increased expression of IFN-y, a relative decrease in production of IL-4, and IgG2a and IgG3, compared with IgG l, autoantibody levels. (Takahashi et a l, 1996; Reininger et a l, 1996). Taken together these findings have led to the suggestion that Thl cytokines may initiate disease, followed by production of
autoantibodies and secretion of proapoptotic and proinflammatory cytokines, mainly derived from monocytes. Th2 cytokines, while potentially protective, may be inadequate in lupus mice (Santiago e ta l , 1997).
Recent studies in patients with SLE also indicate a role for monocytes in the generation of potentially pathogenic cytokines such as IL-6 and IL-10, known to enhance B cell growth and differentiation and contribute to autoantibody formation (Linker-Israeli et a l, 1991; Linker-Israeli et a l, 1999). Regulation of IL-6 expression is achieved through positive and negative signals. Studies have shown that some cytokines particularly IL -lp and TNF-a stimulate IL-6 while IL-4, IL-10 and TGF-p inhibit IL-6 secretion by PBMC from patients with SLE in vitro (Linker-Israeli et al, 1999).
Therefore it is likely that both Thl and Th2 cytokines can modify a given autoimmune disease such as SLE depending on various factors such as stage of disease, local versus
systemic expression and genetic background and without strict adherence to the Thl versus Th2 dualism.
1.6: N ucleosom es as autoantigens in SLE
The cardinal feature of systemic lupus erythematosus is the formation of anti-nuclear antibodies notably those directed against DNA. Some of these antibodies react with the native (double-stranded) B helical form of DNA, while others only react with denatured (single stranded) DNA(ssDNA). Most healthy subjects have a natural autoantibody repertoire including anti-DNA antibodies (Pisetsky et a l, 1990). The anti-DNA antibodies in healthy subjects show only a weak affinity for DNA and wide cross-reactivity for other antigens, and are mostly of the IgM isotype. In contrast, anti-DNA antibodies involved in the pathogenesis of SLE are of the IgG isotype and display high affinity for DNA. These antibodies bear all the characteristics of an antigen driven, T cell dependent immune response (Desai-Mehta et a l,
1995).
The role of nucleosome as an autoantigen in SLE is further strengthened by the presence of nucleosome specific T helper cells and the high prevalence of nucleosome specific antibodies in patients with SLE (Bruns et a l, 2000 )
T cell autoimmunity to nucleosomes may be a latent property of the immune system, but the spontaneous expansion of nucleosome-reactive T cells is a lupus specific event (Lu et a l, 1999; Bruns et a l, 2000; Andreassen et a l, 2002 ). A recent hypothesis by Datta et al, proposes that a sustained hyper-expression of CD40 ligand by lupus T cells, instigates
tolerogenic dendritic cells or resting B cells to present nucleosomes in an immunogenic fashion (Kaliyaperumal et a l, 2002). Only certain epitopes in nucleosomes have been found to be dominantly recognised by the autoimmune T and B cells of SLE patients. By testing overlapping synthetic peptides spanning the core histones in nucleosomes, autoepitopes for murine and human lupus were identified. Autoimmune T cells from lupus prone mice, as well as patients with SLE were shown to be spontaneously primed to these disease relevant epitopes (Lu et a l, 1999). Anti-dsDNA and anti-ssDNA antibodies were found to be cross reactive with nucleosome antigens and conversely, antinucleosome antibodies with DNA. This cross reactivity of the antibodies is commonly explained by epitope spreading (Monneaux et al,
2001).
The pathogenic impact of antinucleosome antibodies in human SLE is highlighted by a strong correlation with a more severe disease course, namely nephritis. Nucleosomes have been shown to bind to the glomerular basement membrane (GBM), via their histone proteins. Glomerulonephritis is then caused by the formation of nucleosome-anti-nucleosome antibody immune complexes (Van Bruggen et a l, 1997).
Nucleosomes in vivo are generated by the process of apoptosis. There is growing evidence that in systemic lupus erythematosus, apoptosis is disturbed, leading to the release of nucleosomes. Moreover, the immunogenicity of these autoantigens might be enhanced by apoptosis induced modifications. Impaired clearance of apoptotic cells might be another factor contributing to the abundance of autoantigens (e.g., nucleosomes) in SLE (Bruns et a l, 2000).
1.7: A poptosis
Apoptosis from the Greek meaning “falling o ff’ refers to the morphological
appearance of cells dying by default (e.g. in embryogenesis) or following active initiation of a programmed pathway by a variety of soluble and surface signals. The importance of
programmed (apoptotic) versus toxic (necrotic) cell death is that the former results in the ordered fragmentation of the cell. Cell fragments are degraded and phagocytosed by neighbouring cells or professional phagocytes, which are not activated and therefore do not cause inflammation.
Multiple signalling and effector pathways that mediate active responses to external growth, survival, or death factors control apoptosis. The defining characteristic of apoptosis is a complete change in cellular morphology. Cells undergo shrinkage, chromatin margination, membrane blebbing, nuclear condensation and then segmentation, and division into apoptotic bodies which may be phagocytosed, often within several hours (Cohen, 1993). Apoptosis or programmed cell death is distinct from accidental cell death (necrosis). Numerous
Apoptosis Necrosis
Morphologie criteria
Deletion of single cells Death of cell groups
Membrane blebbing, but no loss of integrity Loss of membrane integrity Cells shrink, ultimately forming apoptotic bodies Cells swell and lyse
No inflammatory response Significant inflammatory response Phagocytosis by adjacent normal cells. Phagocytosis by macrophages and some macrophages
Lysosomes intact Lysosome leakage
Compaction of chromatin into Clumpy, ill-defined aggregation uniformly
dense masses of chromatin
Biochemical Criteria
Induced by physiological stimuli disturbances Evoked by nonphysiological disturbances
Tightly regulated process with synthetic Loss of regulation of and ion activation
steps homeostasis
Requires energy No energy requirements
Requires macromolecular synthesis No requirements for protein or nucleic acid synthesis
De novo gene transcription No new gene transcription
Non-random oligonucleosomal length Random digestion of fragmentation of
DNA DNA
Table 1.6: Morphological and biochemical differences between apoptotic and necrotic cell death. Table adapted from (Elkon, 1994; Seki et a i, 1998).
1.7.1: Regulation o f apoptosis
Over the past decade, our understanding of apoptosis, or programmed cell death, has increased greatly, with the identification of some of the major components of the apoptotic program and the processes regulating their activation. Although apoptosis is an intrinsic process present in all cells, it can be regulated by extrinsic factors, including growth factors, cell surface receptors, cellular stress and hormones.
Bcl-2 and related cytoplasmic proteins are key regulators of apoptosis, the cell suicide program critical for development, tissue homeostasis, and protection against pathogens. The
bcl-2 gene was originally identified at the chromosomal breakpoint of t(14;18) -bearing B-cell lymphomas. The Bcl-2 family of proteins can somehow register diverse forms of intracellular damage, gauge whether other cells have provided a positive or negative stimulus, and integrate these competing signals to determine the cell’s fate. Members of the Bcl-2 protein family most similar to Bcl-2 promote cell survival by inhibiting adapters needed for the activation of proteases (caspases) that dismantle the cell. More distant relatives instead promote apoptosis, apparently through mechanisms that include diplacing adapters from the pro-survival proteins (Reed, 1997; Adams and Cory, 1998). Pro- and anti-apoptotic family members can
heterodimerize and seemingly titrate one another’s functions, suggesting that their relative concentration may act as a rheostat for the suicide program (Oltvai et a l, 1993). At least 15 Bcl-2 family members have been identified in mammalian cells and several others in viruses. A list of some of the better known members of the Bcl-2 family is given below in table 1.7.
Pro-apoptotic BCl-2 family members
Anti-apoptotic Bcl2 family members
Bax Bcl-2
Bak Bc1-x l
Bok Bcl-w
Bad Mcl-l
Bim Bid
Elegant studies by Oltvai et al., have demonstrated that Bax counters the death repressor activity of Bcl-2 and proposed a model in which the inherent ratio of Bcl-2 to Bax determines the susceptibility to death following an apoptotic stimulus (Figure 1.2) (Oltvai et a l, 1993).
SURVIVAL
BCL-2 BCL-2
BCL-2
BAX BAX
DEATH
Figure 1.2: Model of interrelationship of Bcl-2 andBax and the regulation of programmed cell death (Oltvai et a l, 1993).
In 1993, Boise et al., reported the isolation of Bcl-x, a Bcl-2 related gene that could function as a Bcl-2-independent regulator of apoptosis. Alternative splicing of the Bcl-x mRNA was found to result in two distinct forms of the mRNA. The protein product of the larger mRNA, B c 1 - x l , was similar in size and predicted structure to Bcl-2. Surprisingly, the
second mRNA species bcl-xs, encodes a protein that inhibits the ability of Bcl-2 to enhance the survival of growth factor-deprived cells. Thus, the authours concluded that Bcl-x plays an important role in both positive and negative regulation of apoptosis (Boise et a l, 1993).
1.7.2: A poptosis D ysregulation in SLE
Recent research shows that the genes with a distinct expression pattern in autoimmunity are not necessarily “immune response” genes, but are genes that encode proteins involved in apoptosis, cell cycle progression, cell differentiation, and cell migration. A large number of genes that encode proteins involved in multiple apoptosis pathways were found to be under expressed in PBMC’s of patients with SLE, when compared to healthy controls(Maas et al., 2002). These findings highlight the impact of defective apoptosis pathways on the pathogenesis of autoimmune disorders such as SLE.
Several molecules known to influence the induction of apoptosis have been studied in patients with SLE to evaluate their role in disease pathogenesis. The molecules studied in most detail are the Fas-FasL apoptotic pathway and the Bcl-2 family of genes.
The study of spontaneous and induced apoptosis in SLE lymphocytes has yielded conflicting results. Earlier studies indicated accelerated in vitro and in vivo apoptosis of lymphocytes from patients with SLE although, a more recent study reports lack of consistent abnormalities (Emlen W. et a i, 1994; Lorenz et a i, 1997; Pemiok et a l, 1998; Caricchio and Cohen, 1999)
1.7.3: The Fas receptor in SLE
Fas/APO-1 (CD95) is a 48 kDa cell surface glycoprotein receptor belonging to the tumour necrosis factor(TNF)/ nerve growth factor (NGF) rceptor family(Nagata and Golstein,
1995). Cross-linking of Fas by Fas ligand (FasL), a 40 kDa membrane glycoprotein, triggers apoptotic cell death in many cell types.
Increased Fas expression has been documented on peripheral blood mononuclear cells (PBMC) of patients with SLE when compared to healthy control individuals. The increased Fas expression was observed in both B and T cells although expression was higher on C D 8 \e T cells (Mysler et al., 1994; Lorenz et a l, 1997; Bijl et a l, 2001). Conversely, other reports suggest that most patients with SLE do not appear to have a defect in Fas expression or