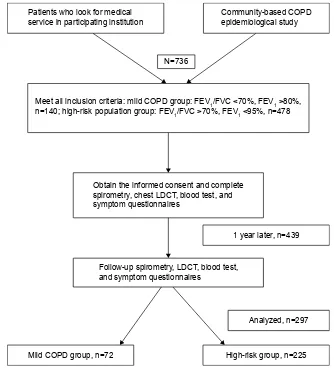
Risk factors for FEV<sub>1</sub> decline in mild COPD and high-risk populations
Full text
Figure


Related documents
However, no homologs to ctx toxin genes were present (Figure 1A).. Genomic organization of zot-encoding prophages in Vibrio species A) Diagrammatic representation of
Figure 3.7: (a): Theoretical and the compensated signals, (b): averaged signal and its Prony estimation which are overlapping (c): transient signal constructed by the
change in internal rotation. The standard deviation is represented by the bars. Figure 4.10: The average effect on the pes planus and pes cavus populations while wearing
The proposed integrated circuit allows the permanent magnet synchronous motor to operate in motor mode or acts as boost inductors of the boost converter, and
The clients issues for security should be rectified first to make cloud environment reliable, so that it helps theusers and manufacturer to undertake it on massive scale
This thesis presents the method to convert an existing double circuit EHVAC line into a simultaneous AC-DC transmission line.Double circuit line is compared with AC DC line Sending
The load flow solution for the modified network is obtained by the proposed power flow algorithm and the Matlab program is used to find the control setting of UPFC for the
To build on the improvement in utilization of health facility services Society for Family Health with funding from Bill and Melinda Gates Foundation upgraded all the