POSITRON INDUCED
IONIZATION PROCESSES
A thesis submitted to the University of London for the degree of Doctor of Philosophy
Marta Sduinska
Department of Physics and Astronomy University College London
ProQuest Number: U641872
All rights reserved
INFORMATION TO ALL USERS
The quality of this reproduction is dependent upon the quality of the copy submitted.
In the unlikely event that the author did not send a complete manuscript and there are missing pages, these will be noted. Also, if material had to be removed,
a note will indicate the deletion.
uest.
ProQuest U641872
Published by ProQuest LLC(2015). Copyright of the Dissertation is held by the Author.
All rights reserved.
This work is protected against unauthorized copying under Title 17, United States Code. Microform Edition © ProQuest LLC.
ProQuest LLC
789 East Eisenhower Parkway P.O. Box 1346
Ahs/racf
ABSTRACT
In this work, a monoenergetic positron beam obtained from a radioactive source and
guided by a magnetic field has been used to study ionization processes, such as
positronium formation and annihilation, induced by positron collisions with atoms and
molecules.
Precise total ionization cross-sections for Ne and Xe have been performed in the
course o f the present work in order to aid the extraction o f the positronium formation
cross-sections by subtracting direct ionization cross-sections. In the case o f Xe, the energy
dependence o f the total ionization and positronium formation cross-sections has been
scrutinized. No evidence o f a structure around 80eV, predicted by a theoretical calculation,
has been found. However, the positronium formation cross-sections in the noble gases have
revealed a double-peak structure, which might be related to the positronium formation in
its various quantum states. The double peak structure has also been confirmed by direct
measurements for Ar and Xe described in this thesis. This type o f investigation has also
been extended to He. The finding o f a simple scaling formula for positron- and electron-
impact ionization cross-sections, also described in this thesis, has enabled the estimation o f
the contribution o f the excited state positronium formation in the noble gases. These
estimates suggest that excited state positronium might occur much more abundantly than
previously thought.
Despite a comparatively poor energy resolution, low beam intensity and an
uncertainty in the absolute energy calibration o f the positron beam, the energy dependence
o f the annihilation cross-sections below the positronium formation threshold in Ne, Xe and
O2 has been investigated by measuring coincidence yields between y-rays and ions. This
study has been prompted by the observation o f a residual ion yield in the total ionization
cross-sections for Ne below the positronium formation threshold. Whilst in the case o f Ne
and O2, the annihilation cross-sections suggest some increase significantly below the
positronium formation threshold, for Xe the increase is ambiguous.
It is anticipated that this work will stimulate further experimental and theoretical
Conte/Ils
CONTENTS
Page
Abstract 2
Contents 3
Figure Captions 6
Table Captions 12
Acknowledgements 13
CHAPTER 1: INTRODUCTION 15
1.1. Historical background 15
1.2. Fundamental properties o f positrons and positronium 16
1.2.1. Positron 16
1.2.2. Positronium 18
1.3. Positron sources and interaction with solids 20
1.4. Positron interactions with atoms and molecules 25
1.4.1. Total cross-sections 25
1.4.2. Elastic scattering 28
1.4.3. Positronium formation 30
1.4.4. Target excitation 32
1.4.5. Direct ionization 34
1.4.6. Annihilation 35
1.4.7. Formation o f compounds 36
1.5. Positronium scattering 37
1.6. Aim and motivation o f the present work 39
CHAPTER 2: THE EXPERIMENTAL APPARATUS 41
2.1. Introduction 41
2.2. The positron beam production 41
2.3. The vacuum system and the positron beam transport 45
2.4. The interaction region 49
2.5. Computer simulation o f the performance o f the ion extractor 51
_____________________________________________________________________Conic 111 s
CHAPTER 3 : POSITRON IMPACT TOTAL IONIZATION CROSS- 55
SECTIONS FOR NE AND XE AND ESTIMATES OF THE POSITRONIUM
FORMATION CROSS-SECTIONS FOR THE INERT ATOMS
3.1. Introduction 55
3.2. Experimental and theoretical overview 55
3.2.1. Positronium formation 55
3.2.2. Direct ionization 65
3.3. Positron impact total ionization cross-sections for Ne and Xe and the extracted 68
positronium formation cross-section for Xe
3.3.1. Overview 68
3.3.2. The experimental method and systematic effects 69
3.3.3. Results and discussion 71
3.4. An empirical scaling and estimates for the excited-state positronium formation 74
cross-sections o f the inert atoms
3.4.1. Introduction 74
3.4.2. Excited-state positronium formation 75
3.4.3. Further work 80
3.5. Summary 81
CHAPTER 4: ENERGY DEPENDENCE OF THE ANNIHILATION 83
CROSS-SECTION FOR NE, XE AND O2 BELOW THE POSITRONIUM
FORMATION THRESHOLD
4.1. Introduction 83
4.2. Theoretical and experimental overview 83
4.3. Determination o f the energy dependence o f the annihilation cross-sections for 93
Ne, Xe and O2 below positronium formation threshold
4.3.1. Modifications to the experimental apparatus and data acquisition 93
4.3.2. Experimental method and systematic effects 95
(i) Energy resolution o f the positron beam 95
(ii) Absolute energy calibration o f the positron beam 97
(iii) Beam perturbation due to weak static electric field 98
(iv) Annihilation signal fi*om residual gases and gas contaminants 100
(v) Epithermal positron contribution 100
(vi) Dependence o f the coincidence yields on the strength o f the
magnetic field 101
4.3.3. Results and discussion
4.4. Conclusions 103
______________________________________________________________________________________________________ C o i Ile ni.s
CHAPTER 5: DIRECT MEASUREMENTS OF THE POSITRONIUM 111
FORMATION CROSS-SECTIONS IN HE, AR AND XE
5.1. Introduction 111
5.2. Experimental method and systematic effects 112
5.3. Energy dependence o f the positronium detection efficiency 114
5.4. Results and discussion 118
5.5. Comparison o f the direct and the extracted Qps for He 122
5.6. Conclusions 123
CHAPTER 6: CONCLUSIONS AND OUTLOOK 125
Appendix: Estimation of the contribution from contaminants in the gas 128
cylinders used in chapter 4
Fiiiiire Captions
Figure Caption Page
CHAPTER 1
1.1 Feynman diagrams for: (a) one; (b) two; (c) three and (d) four photon 17
decay modes.
1.2 The energy distribution o f y-rays emitted in o-Ps decay. 19
1.3 Comparison o f the energy level diagrams for hydrogen and positronium. 19
1.4 The energy distribution o f positrons emitted from a W(110) moderator in 20
comparison to those emitted from a ^^Co radioactive source.
1.5 Simplified illustration o f the interaction o f positrons at a metal surface 22
(from Mills, 1983).
1.6 The single-particle potential for a thermalized positron near a metal 22
surface. is due to correlation with the conduction electrons and
is due to the ion cores.
1.7 The variation o f the slow positron yield from A1 and Cu, with changing 23
positron work fimction, (Murray and Mills, 1980).
1.8 Schematic illustration o f a buffer accumulator o f Greaves and Surko 24
(2002), showing the three stages o f differential pumping and the
electrostatic potential.
1.9 Total scattering cross-section by positron- and electron-impact on the 26
noble gases (from Kauppila and Stein, 1982). The arrows indicate
thresholds for positronium formation, excitation and ionization in order
o f increasing energy.
1.10 Schematic illustration o f the behaviour o f the e^-He and e'-He total 27
scattering cross-section.
1.11 Comparison o f the experimental and theoretical total cross-sections for 28
e^+H scattering (from Zhou et al, 1997).
1.12 Relative differential cross-section for e^-CH# elastic scattering (from 29
Kaupilla et al, 2002).
1.13 Positronium formation cross-sections for K and Na (from Zhou et al, 31
F inure C a pi ions
1.14 Fraction Fps(9) o f positrons scattered by He and emitted as positronium 31
within 5, 10 and 20° angular ranges about the incident positron direction.
The experimental points - Laricchia et al (1987); theory - Mandai et al
(1979).
1.15 Schematic diagram o f the apparatus and the associated potential profile 32
used for measurements o f elastic scattering, vibrational and electronic
excitations and positronium formation (Sullivan et al, 2002a).
1.16 Absolute integral cross-sections for the excitation o f the v=l vibrational 33
mode o f H2. Experimental data o f Sullivan et al (2002a) compared to
various theories: long-dashed curve - Sur et al (1985); short-dashed curve - Baille and Darewych (1974); solid line - Gianturco and
Mukheijee (2001). From Sullivan et al (2002a).
1.17 Absolute integral cross-sections for the excitation o f the 34
3p^(^P3/2,i/2)4s(J=l) states o f Ar fi-om threshold to 30eV compared to
theories. Solid symbols refer to cross-sections by positron impact,
whereas open symbols to the electron impact (fi"om Sullivan et al,
2002a).
1.18 The triply differential electron-spectrum: (a) at 0° in lOOeV e^+Hi 35
collisions (Kôvér and Laricchia, 1998); (b) at 0° in 50eV e’^+H2 collisions
(Kôvér et al, 2002).
1.19 Schematic diagram o f the apparatus and the associated potential profile 36
used for annihilation measurements (Gilbert et al, 2002).
1.20 Cross-section for the production o f CH4^ and ions in positron 37
collisions with C H 4 gas (fi*om Schrader et al, 1992).
1.21 Positronium scattering cross-sections for He. 38
1.22 Longitudinal energy spreads o f the positrons released fi*om positronium 38
break-up (fi*om Armitage et al, 2002).
CHAPTER 2
2.1 The decay schemes and branching ratio o f ^^Na. 42
2.2 A cutaway schematic o f the housing chamber for the source and the 42
moderator assembly.
2.3 A schematic diagram o f the ^^Na source and the moderator holder (to 44
Figure Ccfplions
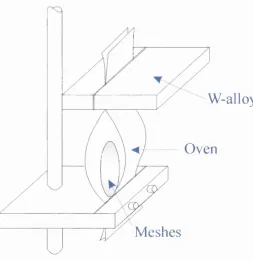
2.4 The moderator annealing oven. 44
2.5 Schematic o f the vacuum system and the beam transport (not to scale). 46
2.6 a) Planar geometry ExB filter; b) Distortion o f the positron beam profile 47
passing through a planar (left) and cylindrical geometry (right) filter
(fi'om Hutchins et al, 1986).
2.7 a) The circuit used to monitor the intensity o f the positron beam; b) 49
Typical variation o f the positron beam intensity versus the moderator
voltage.
2.8 a) General view o f the scattering gas cell; b) Schematic o f the scattering 50
gas cell and the ion detector (to scale).
2.9 The dependence o f the potential on the distance fi'om the centre o f the 52
extracting lens along the central axis o f the gas cell.
2.10 Trajectories o f Xe^ as simulated with Simion 6.0. 52
2.11 Arrivals times and time spreads for Ar^’ and Xe"^’ as simulated with 53
Simion 6.0. The peak heights have been normalized for comparison o f
the respective widths.
2.12 Dependence o f the Ne^ extraction efficiency upon the magnetic field 54
intensity.
CHAPTER 3
3.1 Comparison o f experimental and theoretical results for Qp^ in He. 57
3.2 Comparison o f experimental and theoretical results for Qp^ in H2. 59
3.3 Comparison o f experimental and theoretical results for in H. 60
3.4 Comparison o f Qp^ for the noble gases (fi'om Laricchia et al, 2002). 63
3.5 Comparison o f experimental and theoretical results for in He. 6b
3 .6 Con^arison o f experimental and theoretical results for Q* for the noble 67
gases (Van Reeth et al, 2002).
3.7 Schematic diagram o f the electronic circuit used to measure ion yields. 69
3.8 Total ionization cross-section o f Ne. 71
3.9 Total ionization cross-section o f Xe. 72
3.10 Ionization cross-sections o f Xe. 73
Figure Captions
3.12 Scaled positronium formation cross-section )max versus 76
for He and H. Here is the Ps formation threshold energy.
Ground state positronium formation cross-section a), excited states
positronium formation cross-sections b) 2s and c) 2p (from Szhiihska et ah 2002).
3.13 Scaled positronium formation cross-section / ( & )max versus 77
EjE^f, for the noble gases and He. Here E,^ is the Ps formation threshold energy (from Szhiihska et al, 2002).
3.14 Positronium formation cross-sections for Ne, Ar, Kr and Xe (see 78
caption).
3.15 Energy dependence o f the relative contributions from Ps* to the total 79
positronium formation cross-section (from Szhiihska et al, 2002).
3.16 Maximum value o f the cross-section plotted versus relevant threshold 81
energy, E,f, : (a) direct ionization o f the inert atoms by positron impact; (b) Ps formation for the inert atoms; (c) single ionization by electron
impact for the inert atoms, halogens and atoms belonging to the IV, V
and VI columns (from Szhiihska et al, 2002).
CHAPTER 4
4.1 Schematic o f a positron lifetime spectrometer. The star indicates the ^^Na 84
source and only one o f the 0.51 IMeV annihilation photons is shown; Sc,
scintillator; CFD, constant fraction discriminator; TAG, time-to-
amplitude converter; MCA, multichannel analyser; PMT,
photomultiplying tube (from Charlton and Humberston, 2001).
4.2 Positron lifetime spectrum for Xe at 9.64 Amagat and T=297K with 85
0.109ns per channel. The inset shows the fast component (from Wright et
al, 1985).
4.3 Positron annihilation rates on the noble gases, normalized to unity at 87
room temperature: o, He; #, Ne; ■, Ar; A, Kr; 0, Xe. Solid line,
I'l^urc ( \fpliotis
4.4 Qualitative illustration o f the variation o f the ratio {R = Q ann/Q c) o f the 89
annihilation to elastic collision cross-sections plotted versus the incident
positron for H, He, H2, Xe and C14H10. Also shown are the contributions
to Qann arising from virtual positronium formation and in-flight
annihilation for He (from Laricchia and Wilkin, 1998).
4.5 (a) The efrective number Z ^ o f electrons fr)r annihilation in 91
collisions below the Ps(ls) threshold {Eps(ls)^6.%oW): solid curve - calculation o f Igarashi et al (2002); dotted curve - Laricchia and Wilkin (1997); hollow circles - Van Reeth and Humberston (1998); hollow
triangles - Ryzhikh and Mitroy (2000).
(b) Partial-wave cross-sections for annihilation in e^(E)+H(ls) collisions near the Ps(ls) threshold Eps(ls): solid curves - Qam(L), Igarashi et al
(2002); hollow triangles - Qam(L) obtained from eq. 1.4, Igarashi et al
(2002); dotted curve - Qps(L) for Ps(ls) formation (the total cross-section is indistinguishable from Qps( L = 0 ) , Igarashi et al (2002); hollow circles -
analytical S-wave threshold law (Gribakin and Ludlow, 2002)
normalized to the results o f Igarashi et al (2002) at E-Eps(ls)=0 (from Igarashi et al, 2002).
4.6 Positron annihilation rate, Zeff, as a function o f positron energy for: (a) 92
butane, (b) propane, and (c) ethane. Vertical bars along the x-axis
indicate the strongest infrared-active vibrational modes. Arrows on the
y-axis indicate Zeff for Maxwellian distribution o f positrons at 300K (from Gilbert et al, 2002).
4.7 The apparatus used for the measurement o f the annihilation cross- 93
sections.
4.8 Electronic circuit used for the measurement o f the annihilation cross- 94
sections.
4.9 The measured energy distribution o f the positron beam. Vm and Vr3 are 96
the potentials applied to the moderator and R3, respectively. The red
arrow indicates a cut-off voltage.
4.10 Schematic representation o f the positron beam cross-section used to 98
simulate the mean energy o f the beam within the scattering gas cell with
C api ions
4.11 Perturbation on the positron beam due to the voltage applied to the ion- 99
extracting lens.
4.12 Normalization for the present below , and above it, o f the sum o f 104
Qann + Qps '
4.13 The measured energy distributions o f the positron beam compared to 106
their Gaussian/Weibull fits. and are the potentials applied to the
moderator and R3 grids, respectively.
4.14 The energy dependence o f below Ep^ and Qa„„-^Qps above Eps. 107
The vertical dotted lines indicate the positronium formation thresholds
( Ep^ ) and the vertical dot-dashed line the electronic excitation threshold (E ^ )fi)r0 2 .
4.15 The energy dependence o f below and, above it, -^Qps for
Ne.
CHAPTER 5
5.1 Total ionization cross-section for Ar. 113
5.2 Variation o f the energy dependence o f the coincidence yield with 114
magnetic field strength for He.
5.3 Illustration o f Ps trajectories originating along the centre o f the beam 115
axis. For clarity only three starting positions are shown, the central and
the two most extreme ones (to scale).
5.4 The energy dependence o f the probability o f o-Ps reaching the walls o f 116
the gas cell.
5.5 The energy dependence o f the positronium detection efficiency for the 117
geometry o f the present gas cell.
5.6 Positronium formation cross-section for He. 118
5.7 Positronium formation cross-section for He near Ep^. 119
5.8 Positronium formation cross-section for Ar. 120
5.9 Positronium formation cross-section for Xe. 121
5.10 Total ionization cross-section for He. 122
5.11 Ionization cross-sections for He. The extracted were obtained by 123
Table Caption
Table Caption Page
CHAPTER 1
1.1 Ground-state positronium properties C Al-Ramadhan and Gidley, 18
1994; ^ Khriplovich and Yelkhovsky, 1990; ^ Asai et al, 1995; ^
Adkins et al, 1992).
1.2 Properties o f some emitting isotopes (from Dupasquier and Zecca, 20
1985).
1.3 Time scales for positrons and Ps (from Schultz and Lynn, 1988). 21
1.4 Status on experimental collision studies with positrons (Laricchia, 25
2002).
CHAPTER 4
4.1 Experimental and theoretical values o f Zgff for the noble gases at low 86
densities and room temperature (® Coleman et al, 1975; ^ Van Reeth et
al, 1996; ^ McEachran et al, 1978; d McEachran et al, 1979; ®
McEachran et al, 1980).
A chuy\ I lecl^emciils
ACKNOWLEDGEMENTS
I would like to express my gratitude to my supervisor, Dr Nella Laricchia, for
giving me the opportunity, all the support and guidance as well as her endless enthusiasm
and perseverance. Thanks are also due to Dr Peter Van Reeth for his useful comments,
words o f encouragement and proof reading o f this thesis. This work would not be possible
without the technical assistance o f Ted Oldfield and Ivan Rangué who went out o f their
way to offer always the most practical solutions to a variety o f my problems. For the
ir/relevant entertainment in the ofiQce as well as aU the possible help (in the lab and
otherwise) I would like to thank Davm, Cristiana and Simon (who is also appreciated for
proof reading this work). All the members o f my family and my close fiiends are very dear
to me but here I would especially like to thank my Parents for their unconditional love and
bringing me up just the way I am; my “little” brother, Andrzej, for always being there; and
my wonderful Grandparents, who have played an important role in my life since the day I
was bom. Those who know me would feel that these acknowledgements are incomplete
without me mentioning my beloved dog, Rzepa, who showed me the world fi’om an
entirely different perspective. Lastly, but by no means the least, I would like to thank Tam,
to whom this work is dedicated, for his fi*iendship, unselfish support and for never giving
Chapter 1_______________________________________________________Introduclion
CHAPTER 1
INTRODUCTION
1.1. Historical background
The existence o f the positron, the antiparticle o f an electron, was predicted by
Dirac (1930a) through the negative solution to his relativistic wave equation describing
the motion o f free electrons in the presence o f an electromagnetic field. In his “hole
theory”, Dirac assumed the vacuum to consist o f an infinite sea o f electrons occupying
all negative energy states (from -moc^ to -o o ) in accordance with the Pauli exclusion
principle. If an electron from the “negative energy sea” were excited into a positive
energy level, it would leave a hole behind, which would act exactly like a positively
charged electron with a positive energy. Initially, Dirac believed that this positive
particle was a proton, however it was soon shown by Weyl (1931) that the masses o f
particle and antiparticle had to be equal.
Experimental confirmation o f the existence o f the positron followed swiftly. It
was first observed in cosmic-ray tracks in a cloud chamber by Anderson (1932a, 1932b,
1933). Later, Blackett and Occhialini (1933) confirmed that the mass-to-charge ratio for
a positron was o f the same magnitude as that o f an electron, as predicted by Weyl
(1931).
The discovery o f the positron was followed by the prediction o f Mohorovicic
(1934) o f a bound state o f a positron and an electron, called positronium (Ps). The Bohr
spectroscopic structure o f Ps was qualitatively discussed by Ruark (1945), whilst its
binding energy and lifetimes were calculated by Wheeler (1946). The first observation
o f positronium was made by Deutsch (1951) through the measurement o f positron
lifetimes in gases.
Subsequent advancements in the understanding o f the interactions o f positrons
with matter have resulted in a plethora o f applications o f positrons in numerous
branches o f science. In solid-state physics, positrons may be used as a non-destructive
bulk and surfece probe o f many materials, especially in the detection o f structural
Chapter 1_______________________________________________________Introductioa
molecular physics, comparative studies o f positron, electron, proton and antiproton
scattering from various gaseous targets can provide valuable information on the effect
o f mass, charge, electron exchange, polarisation and electron-capture processes (for a
review see e.g. Knudsen and Reading, 1992). In astrophysics, positron-electron
annihilation radiation is an important probe o f energetic events in our Galaxy since it
provides unique information about the environment o f the annihilation region and the
sources o f positrons (Brown and Leventhal, 1987; Kinzer et al, 2001). In medicine, positron emission tomography is a well-established technique to image functioning
organs, which can be used to detect amongst other conditions, coronary heart diseases,
tumours and brain seizures (Ott, 2003).
Recently, cold antihydrogen atoms (bound states o f positrons and antiprotons)
have been produced and detected by two independent groups (Amoretti et al, 2002 and
Gabrielse et al, 2002). From the CPT theorem, which requires that the laws o f physics are invariant under the combined operations o f charge conjugation, parity and time
reversal, antihydrogen is expected to have spectroscopic properties identical to that of
atomic hydrogen. The latest advances in cold antihydrogen production bring the
stringent tests o f CPT, such as comparison o f frequencies for the electronic transition
from the ground-state to the first excited state in antihydrogen and atomic hydrogen, a
step closer.
The following sections present some o f the fimdamental properties o f the positron
and the Ps atom, an overview o f their production and application as well as the
motivation for this work.
1.2. Fundamental properties of positrons and positronium
1.2.1. Positron
The positron is stable in vacuum with lifetime o f 2x10^^ years (Bellotti et al,
1983). Within the experimental limits, it has the same mass as the electron (511.0034 ±
0.0014)keV/c^ (Cohen and Taylor, 1973) and the same spin, but opposite charge and
thus magnetic moment. A positron can annihilate with an electron resulting in an
emission o f a number o f photons. The total energy o f the photons, in the rest-j&ame, is
equal to the total mass energy o f the positron-electron pair, 1.022MeV. The total
number o f photons is ruled by the charge parity, Pc, o f the annihilating system and must be conserved throughout the interaction. Charge parity for a single photon is -1 and so
Chaplcr I Inlroduclion
^ .= ( - 1 ) " (1.1)
By symmetry arguments Yang (1950) has shown that the charge parity for a positron-
electron system is given by:
Pc = ( -1)L+ S (1.2)
where L and S are the total orbital angular momentum and total spin o f the system, respectively. Hence, it can be seen that the number o f photons into which a positron-
electron pair will annihilate is dictated by the quantum state o f the system prior to
annihilation. In figure 1.1, the Feynman diagrams for annihilation into one to four
photons are shown. In the case o f the single quantum emission the presence o f a nearby
third body is required to conserve momentum. The cross-section o f a given decay mode
is directly proportional to cr'” , where m is the number o f photon interactions, which
corresponds to the number o f vertices in the Feynman diagrams, and
a = e^ IlE^hc = 1/137 is the fine structure constant. Here, e is the electron charge, so is the vacuum permittivity, h is the Planck constant and c is the speed o f light. Therefore, the most probable decay mode, if allowed by the charge parity conservation, is mode (b)
with only two vertices. All the modes presented in figure 1.1 have been observed ((a)
Palathingal et al, 1991; (b) Klemperer, 1934; (c) Chang et al, 1982 and 1985; (d) A dachie/a/, 1990).
The cross-sections for 2-y annihilation in the non-relativistic limit o f a positron
and an electron in a singlet state was expressed by Dirac (1930b) as:
Qir = (1.3)
where v is the velocity o f the positron with respect to the electron and
r ^ - e ^ ! ATte^m^c^ is the classical electron radius, where mo is the mass o f the electron.
( liapter / huroduclioii
When applied to annihilation with atomic or molecular targets, this equation is usually
expressed in terms o f the dimensionless parameter that represents the effective
number of electrons per atom or molecule available for annihilation:
= (1.4)
In the energy range typically employed for positron scattering measurements, Bransden
(1969) determined this cross-section to be o f the order o f 10‘^^m^. Thus, direct
annihilation may, in general, be assumed to be negligible as compared with other
scattering processes such as ionization or Ps formation. We shall return to this process
in chapter 4, where investigations o f annihilation below the positronium formation
threshold for Ne, Xe and O2 are discussed.
1.2.2. Positronium
Positronium (Ps) is the bound state of a positron and an electron. The ground
singlet-state (para-Ps or p-Ps) has a vacuum lifetime of approximately 125ps and decays
predominantly into two -51 IkeV y-rays emitted back-to-back. The lifetime of the l^S,
state (ortho-Ps or o-Ps) is approximately 142ns and it decays predominantly into three
coplanar y-rays. The characteristics of the two spin states o f ground-state Ps are given
in table 1.1.
The continuous energy distribution arising from o-Ps decay was first predicted by
Ore and Powell (1949). This is shown in figure 1.2, where it is compared with the more
recent calculation of Adkins (1983) and the measurement o f Chang et al (1985).
Recently, rare positronium decay modes into four- and five-photon final states
have been measured using an efficient detector (Vetter and Freedman, 2002). No events
violating charge-conjugation symmetry have been observed, thus setting new limits on
Name State Sub-state Ground-state decay rates (ps^)
Experiment Theory
No. and energy of annihilation
quanta p-Ps
o-Ps
I'So
I'S ,
m=0
m=0, ±1
7990.9 ± 1.7 “ 7989.5'’
7.0398 ± 0.0029' 7.0420**
even (2x511 keV)
odd (3, 0-511keV)
(liup/er I Inlroduclion as 0.35 0.30 0.25 0.20 0.15 0.10 0.05 0.00
Ore - Powell phase-space prediction (1949) (Linear) Adkins phase-^ace prediction (1983) QED spectrum with 0 ( a ) correction (Adkins 1983) Experim ental data, Chang et a l ( \985)
0 50 100 150 200 250 300 350 400 450 500 550
Photon energy (keV)
Figure 1.2. The energy distribution o f y-rays emitted in o-Ps decay.
branching ratios for o-Ps decaying into four y’s (<3.7x10"^) and p-Ps decaying into
five y’s ( < 2.7x10"^).
Ps is structurally equivalent to the hydrogen atom with half the reduced mass,
binding energy (6.8eV) and, hence, twice the Bohr radius. The large magnetic moment
o f the positron (657 times larger than that of a proton) makes the magnetic spin-spin
interaction in Ps comparable with the spin-orbit interactions thus removing the
distinction between the fine and the hyperfine structure observed in the H atom. The
energy levels for Ps (calculated by Fulton and Martin, 1954) and H are compared in
figure 1.3.
H Y D R O G EN POSITRONIUM
3/2
1/2“
1.057 G H z
Lam b Shift Lyman-a
1 0 . 2 e V I 2 1 5 Â
'1/2
-1/2 p-Ps Singlets o-Ps Triplets 2 1 I 0
8.6 28(5) G H z
1
0 1233608(1) GHz
1233713(8) GHz ' > 3
‘ 2 03.389(1) GHz
}
Lifetimes
1.14 ps (3 - y decay)
3.18 ns (LymanAX em ission)
LOO ns (2-7 decay)
141.8(1) ns (3-y decay)
125 ps (2-y decay)
( liaptcr / Inlroduclion
1.3. Positron sources and interaction with solids
Fast positrons (P^) may be obtained from the nuclear decay of radioactive
isotopes (such as those listed along with their properties in table 1.2) or from pair
production at particle accelerators. As illustrated in figure 1.4 for ^*Co, positrons are
produced with a large energy spread, which limits their use in controlled
experimentation. However, as also shown in figure 1.4, moderation allows a
compression of phase space. The slowing down process, which leads to this through the
emission of positrons with a few eV of energy, is discussed briefly below.
When a positron from a radioactive source enters a solid, it rapidly loses its
kinetic energy (~10ps) to inelastic processes until it reaches its thermal energy. Most of
the positrons from radioactive sources typically reach equilibrium within 0.1 to 1mm in
a defect-free solid. A significant number o f positrons thermalize near the surface, with
Isotope Half-life Fraction (%) Max. activity (Cig *)
’"Co 71 days 15 16.6
"'Na 2.6 yrs 90 1.25
"’Cu 12.8 hrs 19 600
“ Ge 288 days 88 6
" c
20 min 99-Table 1.2. Properties o f some j f emitting isotopes (from Dupasquier and Zecca, 1985).
Moderated positrons
Emitted positron spectrum from ’*Co
10-«
1 0' 10® 10» 1 0’
Energy(eV)
( liaplcr I Inlroduclion
~1% of positrons stopping within 1500Â of the surface (Schultz and Lynn, 1988). This
is comparable to the average distance that a thermalized positron will difiuse in a
defect-free solid during one mean lifetime. After thermalization, the positron motion
continues as a quantum diffusion process during which the positron scatters off host
atoms and effectively behaves like a propagating wave in the solid. The typical time
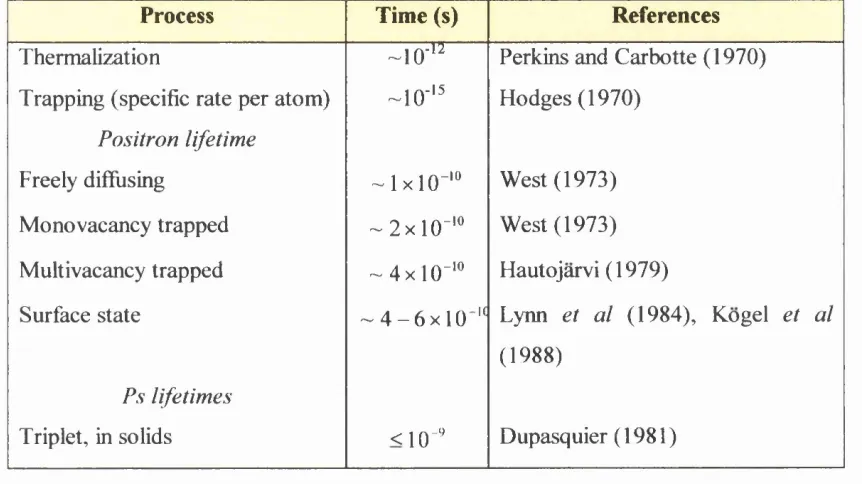
scales for positrons are summarized in table 1.3.
Process Time (s) References
Thermalization - 1 0 '" Perkins and Carbotte ( 1970)
Trapping (specific rate per atom) - i c ' ’ Hodges (1970)
Positron lifetime
Freely diffusing - I x l Q - '" West (1973)
Mono vacancy trapped - 2 x 1 0 " West (1973)
Multi vacancy trapped - 4 x 1 0 " Hautojarvi (1979)
Surface state - 4 - 6 x 1 0 ' " Lynn et al (1984), Kogel et al
(1988)
Ps lifetimes
Triplet, in solids < 10'’ Dupasquier (1981)
Table 1.3. Time scales fo r positrons and Ps (from Schultz and Lynn, 1988).
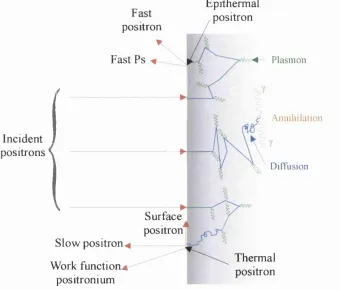
The possible fates o f positrons that have diffused to a metal surface are shown
schematically in figure 1.5. An incident positron may return to the surface as a thermal
or epithermal positron or it may be annihilated within the metal. Thermal positrons that
are ejected from a metal surface may contribute to a slow positron beam. Although the
epithermal positron emission from a tungsten surface at incident positron beam energy
o f 3keV has been found to be negligible (Goodyear et al, 1994), generally, slow positron beams may contain small amounts o f unmoderated positrons. Their
contribution to the measured spectra may be significant as discussed further in chapter 4
o f this work.
In figure 1.6, a one-dimensional representation of the single-particle potential
energy for a positron near a metal surface is shown in the case of a negative positron
( liaptcr I Inlroduclion
Incident positrons \
Epithermal positron
Slow positron
Work function^ positronium
positron
Fast Ps mp<4 — Plasnioii
A n n ih ilation
V, ' DilTusion
Surface positron
Thermal positron
Figure 1.5. Simplified illustration o f the interaction o f positrons at a metal surface (from Mills, 1983).
" ^Potential
Total Po tertial
Image Potential corr
Metal
( 'haplcr I IiUroduction
energetically allowed. The work function of a particular surface has two contributing
factors, the relevant chemical potential (//^) and the surface dipole The positron
work function can be written, following Tong (1972), as (f>^ = . The chemical potential contains terms due to the electron and positron interactions with the other
electrons and with the ion cores. The surface dipole is primarily caused by tailing of the
electron distribution into the vacuum for a distance ~10’*^m. The fact that the surface
dipole is attractive for positrons enables to be negative for certain materials.
Clean single crystal moderators with known lattice orientations were first studied
by Mills et al (1978). It was found that the variation of the temperature of the moderator resulted in the change o f the slow positron beam yield. Muray and Mills (1980)
measured the positron moderation efficiencies o f Al and Cu for various values o f (j>^ by controlling the temperature, surface coverage o f S atoms and the orientation o f the
crystal lattice. Their results are shown in figure 1.7, where it can be seen that as the
work function becomes more negative, the positron yield increases.
Dale et ai (1980) found that annealing (described in more detail in chapter 2) o f the moderator increased the moderation efficiency. The best result was obtained with
chemically etched and heated to 2200°C poly crystalline W vanes. This was attributed to
the fact that the heat treatment reduced the number o f defects in the lattice, which act as
traps, allowing more positrons to difiuse back to the surface.
0.6
0.5
? 0.4
^ 0.3
o c/3
0.2
A A1(]11)+A1(110) ■ Cu(llO)
0.0
0.0 0.2 0.4 0.6 0.8 1.0 1.2
4+ (eV)
( liaplcr I Introduction
Gullikson and Mills (1986) reported that rare gas solids (RGS) reveal unusually
high yields of epithermal positrons. This was attributed to the large diffusion length of
the hot positrons in RGS and, thus, the inability to thermalize completely. In contrast to
metals, there are no free electrons near the surface so the dipole potential contribution is
smaller and is positive. However, many of the positrons reach the surface
epithermally and thus can overcome the positive (^+ barrier and be emitted into the vacuum.
The application o f RGS-moderated positrons in conjunction with an
appropriately modified Penning-Malmberg trap has resulted in high-quality, cold
positron beams of 25meV energy resolution (Greaves et al, 1994; Greaves and Surko, 2002). In figure 1.8, a schematic illustration o f a buffer accumulator and the variation of
the electrical potential and pressure along its three stages are shown. Neon-moderated
positrons are confined along the trap by an axial magnetic field o f typically 1000-1500
Gauss. They enter the trap passing over the electrostatic potential into region I, which
contains N2 at a pressure of around lO’^Torr. In this region, positrons are trapped by
inelastic collisions, ‘A’, with buffer gas molecules. Subsequently, positrons filter to
lower energies by collisions ‘B’ and ‘C’ and as a result are confined in region III, which
is maintained at low pressure by differential pumping. In region III positrons cool
rapidly to 300K by a combination o f vibrational and rotational excitations. It was found
that although N2 is the most efficient for positron trapping, it is an inadequate choice for
positron cooling (Greaves and Surko, 2002). This problem was overcome by
introducing a small amount o f cooling gas, such as C H 4 , directly into the third stage of
the trap.
S
1
0 -200 -150 -100 -50
2 (cm)
( liaptcr I Introchiclion
1.4. Positron interactions with atoms and molecules
In the last decade, there has been much progress in positron-atom/molecule
collisions. The present experimental status of positron collisions with atomic and
molecular targets is summarized in table 1.4. Recently, slow positron beam interactions
with atoms and molecules have been reviewed by Laricchia and Charlton (1999),
Charlton and Humberston (2001) and Laricchia (2002).
Interaction Experimental status
1.4.1. Total cross-section
all
1.4.2. Elastic scattering
+ A + A
1.4.3. Positronium formation
+ A - ^ Ps + { m - \ ) e - +A'”^
1.4.4. Target excitation
+ A ^ + A*
1.4.5. Direct ionization
e'*' + A —> e'^ + me~ + A'”^
1.4.6. Annihilation
+ A - ^ 2 / + A^
1.4.7. Formation of compounds
+ A - ^ ( P s C ) + D^
Qi for many atomic and molecular targets
including H, He, alkali and Mg.
Some and dQ^, IdÇl.
for 1 < £ < lOO^L
including H, alkali. Mg ; some dQ,,^ / dO..
First state-resolved for electronic and
vibrational excitations,
grfor
\ < E < \ 0 0 0 e Vincluding H, some dQJ ! dQ., d^Q! IdCl^dE^
and first d^Qj I dÇï^dÇi^dE,.
First energy dependent measurements.
Only PsH observed - failed search for PsCl and
PsF.
Table 1.4. Status on experimental collision studies with positrons (Laricchia, 2002).
1.4.1. Total cross-sections
The total scattering cross sections (Q,) have been extensively studied (for reviews see Kauppila and Stein, 1990; Zecca et al, 1996). Among the first atoms treated experimentally were the noble gases since they exist in atomic form at room
( luipier I Introdiiclion
electron-impact for the inert atoms are evident. In the case of He, it can be seen that
Q,{e~) is significantly larger than Q,{e^) at low energies. This is due to partial cancellation o f the static (repulsive) and polarization (attractive) interactions in the case
of a positron projectile. A similar behaviour is found in the total cross-section for other
noble gases, except that Q,(e~) for Ar, Kr and Xe exhibit narrow deep minima at low
energies (<leV) where only elastic scattering occurs. In this region exceeds
These minima were first observed by Ramsauer (1921, 1923), Townsend and
Bailey (1922) and Ramsauer and Ko Hath (1929) and referred to as Ramsauer-To wnsend
effects. They arise fi*om quantum mechanical effects associated with an attractive
polarization interaction between the incident projectile and the target atom. In the case
o f positron scattering, as seen in figures 1.9 and 1.10 that the Ramsauer-To wnsend
T
4 0
0
2020
</>
20 30
o
H e liu m
X
Ü0 DS
tiecirort eoe'gy (eVI Pos'iro'» ere'q y !eVl
( liaplcr 1 Iiilrodnclion
Energy (eV)
0 2 10 50 100 200 400 600
kj
5 c /
He
0.1
0.01
0 2 4 6
k(I/ao)
Figure 1.10. Schematic illustration o f the behaviour o f the e^-He and e'-He total scattering cross-section.
minima exist for He, Ne and possibly Ar between 1 -3eV, where they are due to the zero
in the s-wave phase shift at such low energies. In the case of electrons, Ramsauer-
Townsend effects occur because the s-wave shift passes through tt radians (or its
multiple).
In general, ^,(^~) change very smoothly as different inelastic channels open,
whereas Qf e ^ ) reveal a sudden increase at the positronium formation threshold, Eps,
(indicated by first arrows in figure 1.9 and a blue arrow in figure 1.10) suggesting that
this process plays a significant role in the positron scattering by inert atoms. Indeed, the
minimum at low energies and the sharp rise at Eps are also typical features observed in positron scattering from many molecular targets. As the impact energy is increased, the
dominance o f the static interaction ultimately should lead to merging of for the two
projectiles, as illustrated in figure 1.10 for positron-He scattering where merging occurs
at around 200eV. No such merging has been observed for heavier targets up to 800eV
(Kauppila et al, 1981; Dababneh et al, 1982). On the other hand however, Kimura et al
( hup ter / Inlroduction
o f Karwasz et al (2002) indicated an asymptotic convergence of cross-sections by positron and electron projectiles in the case of Ar above 2keV. The results for Kr across
this energy range were inconclusive.
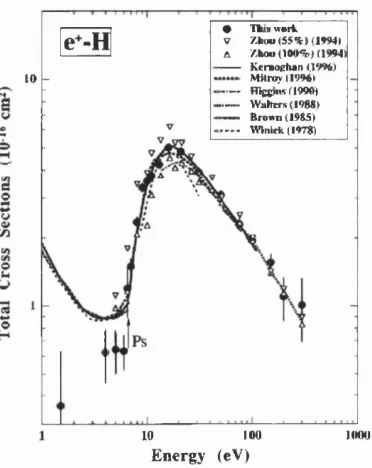
Recently, the total cross-section for H has been measured by Zhou et at (1997) and a good agreement found between the experiment and available theories, except at
low energies where experimental data lie below the theoretical results, as depicted in
figure 1.11.
e -H It)
-# H us u'»rk V ZIio o(55%M1»!M|
A /,hoo(10(Mfc)ri9M)
K e n o e lu n 1.1996) MHroy 11996* - - — H i{ p i« fl9 9 0 ( W alttrs (I98«>
—— Bni»n(19&S)
W n trk (197%
•s
10 100
Energy (eV)
1000
Figure 1.11. Comparison o f the experimental and theoretical total cross-sections for e^ scattering (from Zhou et al, 1997).
1.4.2. Elastic scattering
In the case where annihilation is relatively improbable as compared to other
processes, Q, is approximately equal to below the first inelastic threshold.
Campeanu et al (1987) deduced the behaviour o f for He by adding together the
positronium formation and the single ionization cross-sections o f Fromme et al (1986), fitting a curve to these points and then subtracting it fi-om the total cross-section of Stein
et al (1978). This resulted in an indication that a cusp-like feature may be present in at the positronium formation threshold. However, neither the results of Coleman et al
(1992) nor Moxom et al, (1993) confirmed such a feature of the size implied by
( lutplcr I hilroduvHo}}
variation of across Eps for this system (Moxom et al, 1993). This is in agreement
with near-threshold measurements of Moxom et al (1994) and the Kohn variational
calculation o f Van Reeth and Humberston (1997).
A more sensitive method of investigating elastic cross-sections is through
differential cross-sections. Measurements o f such cross-sections for positron scattering
by Ne, Ar, Kr and Xe revealed dififraction-like structure below the relevant Eps, that disappears as the incident positron energy is increased (Smith et al, 1990; Dou et al,
1992; Kauppila et al, 1996). This was attributed to the absorption effect o f the positronium formation channel on the elastic one. In figure 1.12, the relative differential
cross-sections for positron-methane quasielastic scattering (the rotational and
vibrational excitations could not be resolved due to large energy resolution of the
projectile beam) o f Przybyla et al (1997) are compared to theory o f Jain and Gianturco (1991) and Germano and Lima (1993). These differential cross-sections are remarkably
similar to those o f Ar (Smith et al, 1990). The fact that the structure at 6eV and lOeV is consistent with the calculation o f Jain and Gianturco (1991) and is seen to be washed
out at 30eV and inconsistent with the calculation at small angles above 50eV suggests
that positronium formation (not included in the calculation) for this target has an
important absorption effect on the inelastic channel. Similar structures have been
observed for other symmetric molecules such as N2, O2, CO and S F 4 .
10»
10"
g 10* 1
Ï i(f
I
>10^
10'
10*^,
• Przybyla et al. (1997) i
J a in a n d ü i a n l u r c o ( 1991) ^
(jcrmano and Lima ( 1993) ^
♦ ♦ T t
4 eV 16eV
inoev
e+/C H
0 3 0 6 0 90
S c a tte rin g A n g le (d e g re e s )
200 cV •
120 150 T s O
Figure L I 2. Relative differential cross-section fo r e"-CH4 elastic scattering (from
Chapter I___________________________________________________ Introduction
1.4.3. Positronium formation
Positronium formation cross-sections ( Qp^ ), integrated over all quantum states
o f Ps and the ion, have been measured for all the inert atoms (Moxom et al, 1993, 1994;
Overton et al, 1993; for compilation o f earlier data see Charlton and Laricchia, 1990),
some molecules (Moxom et al, 1993; Laricchia and Moxom, 1993; Laricchia et al,
1993), atomic hydrogen (Zhou et al, 1997 and referenced therein), alkali atoms (Zhou et
al, 1994; Surdutovich et al, 1996, 2002) and Mg (Stein et al, 1996). Qp^ for H, Hi and the inert atoms are discussed in detail in chapter 3. Briefly, good convergence exists
among recent theories and experimental Qp^ in the case o f atomic hydrogen (Zhou et al,
1997). For He, good agreement between the experiment (Overton et al, 1993) and the
theory (Campbell et al, 1998) exists at the intermediate energy range, however
discrepancies still remain both near threshold (Van Reeth and Humberston, 1999) and at
high energies (Campbell et al, 1998). In the case of He, the coupled-pseudostate
calculation o f Campbell et al (1998) suggest that the ground-state Ps formation
dominates the cross-section with only ~20% o f Ps formed in an excited state. In the case
o f the alkali atoms, Ps formation is an exothermic process so it is expected that
Qp^ —> 0 0 as £ - > 0 . Calculations o f Walters et al (1995) predicted a collapse o f
ground-state Ps formation in going from Li to Cs with a simultaneous increase in the
excited state Ps formation. Interestingly, a trend has been revealed in the estimates o f
the excited state positronium formation, which increases from Ne to Xe, as discussed
further in chapter 3. In figure 1.13, Qp^ for potassium and sodium are presented together with various theories (Zhou et al, 1994) in the energy ranges from leV to
lOOeV for K and leV to 20eV in the case o f Na. These energy ranges were extended
down to around 0.2eV and measurements were performed for lithium and sodium
(Surdutovich et al, 2002). From figure 1.13, it can be noticed that there is a larger difference between the upper and lower limits in the case o f K than in the case o f Na.
For these targets the two sets reveal opposite trends below approximately 5eV with the
lower limit measurements exhibiting a striking decrease and the upper limit values
continuing to rise. The theory suggests that the lower limit results are closer to the true
Qp^ and the divergence between the upper and lower limits has been attributed to the mcon^lete collection o f the scattered positrons.
( hap ter 1 IniroJiiclion
8 0
P o ta ssiu m
70
i
6 0 O
0 50
1
g Ü 3 0
O
2 0
o
CL
1 0 1O0 1 S odium 80 O g % 2 ü g i o 20
ÛL
10
1
Energy (eV) Energy (eV)
Figure 1.13. Positronium formation cross-sections fo r K and Na (from Zhou et al,
is present and hence by a prospect o f being able to produce positronium beams. In
figure 1.14, the results of Laricchia et al (1987) for the variation of the fraction (Fps) of positrons scattered by He and emitted as positronium at small forward angles is
compared to the corresponding predictions obtained fi*om the theory of Mandai et al
(1979). It was concluded by Laricchia et al (1987) that approximately 4% o f the scattered positrons could be detected as o-Ps atoms collimated in a 6° cone about the
incident positron direction.
03 0.2 01 20' tone' ^ 10' cone
5 ' core!
2C 40 50 80 '00
energy leV)
Figure 1.14. Fraction Fps(6) o f positrons scattered by He and emitted as positronium
( luipler I IiKroJuction
Very recent investigations of the efficiency for conversion of a positron beam into
a positronium beam by charge exchange from N2 have indicated that although
remains the best converter at low energies (Gamer et al, 1996), N2 becomes more
efficient from 90eV upwards (Leslie et al, 2002). In section 1.5 o f this chapter, recent advances in positronium scattering are briefly described.
1.4.4. Target excitation
Recently, the development o f buffer-gas trapping and magnetized beam
formation has provided positron beams with much smaller energy resolutions
( A£ < 25 meV), which in turn, has enabled scattering experiments at low energies with
significantly improved selectivity for excitation experiments (Sullivan et al, 2002a). In figure 1.15, the apparatus used for the scattering measurements is depicted.
Positrons are released from the accumulator, described in section 1.3, with a well-
defined energy and energy spread in pulses of about 2x10^^ positrons each. The pulsed
positron beam is then passed through a scattering gas cell containing the gas under
study and subsequently through a retarding potential analyzer (RPA). The detection of
the positron beam is achieved by measuring the 51 IkeV y-rays from the annihilation of
positrons on the metal collector plate at the end o f the RPA. Scattering cross-sections
were obtained by exploiting the properties of the positron motion in high magnetic
fields. The total energy ( E, ) o f a positron can be separated into two components parallel
( ) and perpendicular ( ) to the vector o f the magnetic field, since
E, = Ep^^ + Ep^^. Elastic and inelastic scattering results in a redistribution or
Retarding Potential
Accumulator Scattering cell Analyzer
Bs
V(z)
□
Nal
detector
positrons
( Ihipicr I Introduction
transfer o f energy between cos^(0) and E^^^ = E^sin^{0 ), 0 being the
positron scattering angle and the positron energy after scattering E^ = or
Æ, = E,^ - ( E^„ is the incident positron energy and E^^ is the energy lost due to target excitation). In a slowly varying magnetic field the quantity E^^^ IB is an invariant. If the magnetic field ( ), where the transmitted positrons are analyzed, is
much smaller than that where they are scattered {B^), then the beam is parallelised
(according to B^ l B ^ 0^ / sm^ 6^) and most of E^^^ is converted into . Thus
the scattered positron beam has a distribution of E^^^ values and this is reflected in the signal measured by the RPA.
Absolute cross-sections for the vibrational excitations o f CO, CO2 and H2 were
measured in the energy range fi*om 0.5eV to several eV by Sullivan et al (2001b). In figure 1.16, the absolute vibrational cross-section for the excitation of the v=l mode of
H2 is shown and compared to available theories. The agreement with calculations of
Gianturco and Mukherjee (2001) and Sur et al (1985) seems reasonable, whilst the prediction o f Bailie and Darewych (1974) is lower at energies <2eV.
In the recent work o f Sullivan et al (2001a) the first state-resolved measurements o f electronic excitations by positron impact on Ar, H2 and N2 were made. In figure 1.17,
0.6
H v= l 0.5
0.3
Ü.Z
0.1
0 1 2 3 4 5
Energy (cV)
Figure 1.16. Absolute integral cross-sections fo r the excitation o f the v=7 vibrational mode o f H2. Experimental data o f Sullivan et al (2002a) compared to various theories:
Chaplcr 1 InfrodncHon
0.6
Ar
0.5
4s[l/2] J=1
0.3
cn
0.2
0.1
0
23
10 13 20 30
Eneisy (eV)
Figure 1,17, Absolute integral cross-sections fo r the excitation o f the 3p^ fP s/2,i/2)4s(J=1) states o f Ar from threshold to 30eV compared to theories. Solid symbols refer to cross-sections by positron impact, whereas open symbols to the electron impact (from Sullivan et al, 2002a).
the absolute integral cross-sections for the excitation o f the 3p^(^P3/2,i/2)4s(J=l) states in
Ar are shown. These are two out o f the four lowest-lying 4s excited states that can be
excited by positrons (those with total angular momenta J=l,2 are metastable). A
structure is evident near 15eV in the state coupled to the level. Although the cross-
sections are small, they are comparable in magnitude to their electron scattering
counterparts.
1.4.5. Direct ionization
Single direct ionization cross-sections by positron impact are discussed in more
detail in chapter 3. For reviews see e.g. Charlton and Humberston (2001), Laricchia
(2002) and Laricchia et al (2003).
Kôvér and Laricchia (1998) reported the first triply differential cross-section for
positrons at an incident energy o f lOOeV in collisions with Hz. The scattered positron
and the ejected electron were both detected around 0°, with the electron also being
energy-analyzed. The ejected-electron spectrum is shown in figure 1.18a. A small peak
close to 42eV present in the experimental data was attributed to electron-capture-to-the-
continuum (ECC), a phenomenon that arises fi*om the Coulomb attraction between the
two outgoing particles in the final state. This work was further extended to the positron
( liaplcr I Introchiclion
2.5e-17
B erakdar 1998
' Laricchia and K over 1998 2,0e-17
^ 0.6 1 5e-17
E lOe-17
U 5 06-18
K over and Laricchia 2001 Fiol e r a / (2001) theory shifted by 1.6eV
0.0 0.0
-0.2 -5.06-18
70 6 8 10 12 14 16 18 20 22
Ejected electron energy (eV) Ejected electron energy (eV)
Figure 1.18. The triply differential electron-spectrum: (a) at 0° in lOOeV e
collisions (Kôvér and Laricchia, 1998); (b) at 0°in 50eV e^+H2 collisions (Kôvér et al, 2 0 0 2/
experimental results are compared to the theory o f Fiol et al (2001) and as can be seen in the figure, the agreement between the data would be fair were the theoretical data
shifted by 1.6eV towards lower energies. It was suggested by Kôvér et al (2002) that a
physical effect, which could give rise to the shift, would be the occurrence o f ionization
simultaneous to another energy loss such as vibrational excitation or molecular
dissociation of the target.
1.4.6. Annihilation
Positron annihilation on atomic and molecular targets is very topical at present. It
is described in greater detail in chapter 4. Here it suffices to mention that, until very
recently, the majority of annihilation measurements were performed using lifetime
techniques over a restricted temperature range (for reviews see Heyland et al, 1982; Charlton, 1990).
Energy-resolved measurements (discussed further in section 4.2) have now been
performed using an apparatus shown in figure 1.19 (Gilbert et al, 2002). The pulsed positron beam was derived fi-om the trap, already discussed in section 1.3, and guided
by a magnetic field through a cylindrical gas cell containing the gas under investigation.
The positron beam energy was defined by adjustable voltages on the gas cell and V
on the exit of the trap. Annihilation events were detected fi-om a 10cm region along the
gas cell by a specially designed Csl detector. The low level o f the annihilation signal
( lutplcr I______________________________________________________Inlroduction
Csl I I
detector |__ |
Accumulator Annihilation Reflector
cell Electrode
Bo
V(z)'
z
Figure 1.19. Schematic diagram o f the apparatus and the associated potential profile used fo r annihilation measurements (Gilbert et al, 2002).
shielding the detector and the gas cell with a thick layer o f lead. As shown in figure
1.19, signals fi'om y-rays that would arise fi-om positrons hitting the collector plate at the
end of the beam-line were prevented by keeping positrons in flight by means of a
reflector electrode while the annihilation signal was recorded.
1.4.7. Formation of compounds
There has been much theoretical and experimental interest in studying the
possibilities of forming Ps-containing molecules with Ps~ being observed by Mills (1981). PsH, PsF, PsCl, PsBr and PsI have all been predicted to be chemically stable
(Wheeler, 1946; Simons, 1953; Ore, 1951; Cade and Farazdel, 1977; for a recent review
see Mitroy et al, 2002). The formation of positronium hydride (PsH) in collisions
between positrons and methane was reported by Schrader et al (1992). The signature for
the formation of PsH was a detection o f CHI ion below the threshold (7.55eV) for the production o f CH^ + H + P s . The small step in the CH]^ yield between 6eV and 8eV,
depicted in figure 1.20, was interpreted as direct evidence o f the PsH formation. From
these measurements a value o f (1.1 ± 0.1 )eV for the binding energy of PsH was
obtained, which is in broad agreement with theoretical calculations (e.g. Ho, 1986; Yan
and Ho, 1999).
More recently, an investigation to study fi-agmentation patterns o f the
halomethanes such as CCI2F2, CCIF3, CF4 and CHF3 fi'om threshold up to 50eV was
( 'hapicr 1 Iniroducfion
0.5
0.2
0.(M
0.02
001
0 0 0 5
0001
00005
A* ♦ CH, — CHj f PsH
OOOOl
5 « fi ID
Figure 1,20. Cross-section fo r the production o f C H f and CH3 ions in positron
collisions with CH4 gas (from Schrader et al, 1992).
function of positron energy. If Ps compounds such as PsF and PsCl were formed during
the collisions, thresholds for relevant fragmentation processes would be reduced by
their binding energies. Within the experimental limitations, no evidence o f compound
formation has been observed.
1.5. Positronium scattering
A positronium beam can be produced by neutralizing a monoenergetic positron
beam in a gaseous target (Laricchia et al, 1987; Laricchia and Zafar, 1992). The beam produced in such a way includes only o-Ps, since the lifetime o f p-Ps is three orders of
magnitude shorter and is untransportable at atomic velocities. The Ps energy is expected
to be given, to the first approximation, by E = - (Æ, + 6.8eF / «^ ), and is tunable via
the incident positron energy E+, Et is the target ionization energy and 6.8eN/n^ is the Ps
binding energy in a state o f principal quantum number n. The total cross-sections for Ps scattering have been measured for He, Ar, O2 and H2 (Gamer et al, 1996; Gamer et al,
1998; Gamer et al, 2000). These cross-sections are difficult to measure due to very small fluxes of Ps beams. In figure 1.21, the total scattering cross-section for He is
( liaplcr I Introdiiclion
T otal, B lackw ood e t a l (1 9 9 9 )
Break-up, B lack w ood e t a l ( 1 9 9 9 )
P s(n = 2 ) excitation , B lackw ood e / a / (1 9 9 9 )
E lastic scattering, B lackw ood e t a l (1 9 9 9 )
• Ps total cross-section . G am er e t a l (1 9 9 6 )
O Ps break-up cross-section , A rm itage e t a l (2 0 0 2 )
E nergy (e V )
Figure 1.21. Positronium scattering cross-sections fo r He.
E = 1 3 eV
E / 2
§
X I
06
<
0 4
0 2 0.0
0 2 4 6 8 10 12 14
E - 1 8eV
C 0.8
■£ <
0.4
0.2
0.0
0 2 4 6 8 10 12 14 16 18 20
E n ergy (e V ) E n er g y (e V )
E = 3 3 e V E = 2 5 e V
§ C U o
-P 0.6 -E
< <
0.4 0.4
0.2 0.2
25 30
0.0 0.0
0 5 10 15 25 0 5 10 15 20
E n ergy ( e V ) E n ergy (e V )