International Journal of General Medicine
The impact of obesity in the kinematic
parameters of gait in young women
Tânia Cristina Dias da Silva-Hamu1
Cibelle Kayenne Martins Roberto Formiga1
Flávia Martins Gervásio1
Darlan Martins Ribeiro2
Gustavo Christofoletti3
Jônatas de França Barros4 1Physical Therapy Department
of the State University of Goiás, Goiânia, Goiás, ²Dr Henrique Santillo Readaptation and Rehabilitation Center, Goiânia, Goiás, 3Physical
Therapy Department of the Federal University of Mato Grosso do Sul, Campo Grande, Mato Grosso do Sul,
4Department of Physical Education of
the Federal University of Rio Grande do Norte, Natal, Rio Grande do Norte, Brazil
Correspondence: Tânia Cristina Dias da Silva-Hamu
Universidade Estadual de Goiás, Departamento de Fisioterapia, Av Anhanguera, nº 3228 Setor Leste Vila Nova, CEP 74643-010, Goiânia – GO Tel +55 62 3579 1290
Fax +55 62 3522 3506 Email tania.ft@gmail.com
Background: The prevalence of obesity is increasing in the population, particularly in women. Obesity has an impact on the musculoskeletal system, leading to knee and ankle overexertion, difficulty with balance, and functional disability. The aim of this study was to identify changes in kinematic parameters of gait in obese young women.
Methods: A case-control study with 24 obese women (mean age 35.20 ± 9.9 years and mean body mass index of 31.85 ± 2.94 kg/m²) and 24 eutrophic women (mean age of 36.33 ± 11.14 and mean body mass index of 21.82 ± 1.58 kg/m²). The gait of women was evaluated by the system Vicon Motus® 9.2. The linear parameters of speed, cadence, right and left step, and stride lengths
were studied, as well as the angular parameters of knee and ankle.
Results: There was a decrease in linear gait parameters (P, 0.001), speed, cadence, right and left step, and stride lengths. In regard to the angular parameters of the knee and ankle, there were also differences between the analyses (P, 0.001). At the knee joint, obese women have delayed onset of the second wave of flexion, exacerbating such movement in order to compensate. In regard to the ankle, both groups showed curves of normal plantar flexion and dorsiflexion, but there was a delay in the path graph in the ankle of obese women indicating a reduced range of motion and possible over-exertion of the pretibial muscles and soleus muscles simultaneously.
Conclusion: The results of this study revealed that obesity is a factor that negatively influences the kinematic parameters of gait of young women.
Keywords: gait, musculoskeletal system, body mass index
Introduction
Excess weight and obesity are major clinical and public health problems worldwide. The estimated total numbers of overweight and obese adults in 2005 were 937 million and 396 million, respectively.¹
The incidence of obesity has considerably increased in recent years, and its prevalence in men and women was approximately 35% in 2009–2010.² Developing countries have been experiencing social changes that have increased the incidence of obesity at a much faster rate than the populations of economically developed countries.³
Obesity can be defined as excess body fat, and in epidemiological studies, the body mass index (BMI) is the standard measure used to characterize normal and overweight.4
Obesity may lead to relevant comorbidities and severity which are proportional to excess body fat.5 Studies indicate that there is a difference in the accumulation of body
fat between the sexes; women have a significantly higher amount of total body fat than
Dove
press
O R I G I N A L R E S E A R C H open access to scientific and medical research
Open Access Full Text Article
International Journal of General Medicine downloaded from https://www.dovepress.com/ by 118.70.13.36 on 22-Aug-2020
For personal use only.
Number of times this article has been viewed
This article was published in the following Dove Press journal: International Journal of General Medicine
men of the same BMI.6 Between 1980 and 2008, the average
BMI in the world increased about 0.4 kg/m² per decade for men and 0.5 kg/m² per decade for women.7
Obesity is related to a variety of musculoskeletal abnormalities in adults. With the increasing incidence of obesity, the musculoskeletal condition becomes a factor that interferes with the quality of life, functional capacity, and increased healthcare costs.8 Several studies have
described the changes that affect obese individuals, from demonstrations to systemic complications suffered by the locomotor system, or musculoskeletal complaints, including changes in weight-bearing and postural balance.9–12
Some studies have reported musculoskeletal changes specifically in females, and such studies have proved that obese women have: muscular deficiencies; mobility difficulties at home; difficulties in performing housework, leisure, and sports activities; and higher energy cost during walking.13–16
Studies that show the kinematic and kinetic parameters of gait in healthy young individuals are quite extensive; however, the same is not so for obese young individuals.17 In
a study of the three-dimensional analysis of gait of obese men and women, a decrease of the gait parameters, such as speed and step and stride length, were found.18 However, studies of
gait analysis, such as the three-dimensional gait analysis, in obese individuals who were evaluated separately according to their sex and with instruments considered as gold standard, have still been infrequently performed.
Due to advances in gait analysis and to the increasing importance of the incidence of obesity, it is necessary to describe the impact of obesity in the walking pattern of young women. The aim of this study was to identify the impact of obesity in the linear and kinematic angular parameters of gait in young obese women in Brazil, and the results may help in establishing preventive or rehabilitative actions to improve the quality of life of obese individuals.
Material and methods
Sample
The case-control study was approved by the Ethics Committee of the University of Brasília (protocol number 178/08). The sample consisted of two groups: a case group of 24 obese women with a mean age of 35.20 years (±9.9) and a mean BMI of 31.85 kg/m (±2.94) and a control group of 24 eutrophic women with a mean age of 36.33 years (±11.14) and mean BMI of 21.82 kg/m² (±1.58). The study was conducted in the Movement Analysis Laboratory at the University of Goiás, Central-West Brazil.
Inclusion criteria for both groups were: female, aged 20–60 years, and community nonambulators. Exclusion criteria were: pregnancy with use of assistive devices for walking (crutches, canes, walkers); surgical history in the lower limbs or use of prosthetics and orthotics; history of fractures of the spine or lower limbs; neurological, orthope-dic, rheumatologic, or vestibular system disorders or other disorders that alter the integrity of the lower limbs; use of drugs that affect balance; and use of alcoholic beverages in the previous 24 hours before the test.
Protocol of anthropometric assessment
and placement of reflective markers
Women in the study were weighed and measured using a Filizola® Series 3134 (Filizola Balança Industries, São
Paulo, Brazil), and their BMIs were calculated. They then underwent anthropometric assessment, which consisted of the measurement of nine bilateral points (lengths of the thigh, leg, and foot; circumference of the thigh and leg; knee diameter; lateral malleolus height; malleolus and foot width) and the distance between the anterior superior iliac spines. These measures were selected as key segments whose dimensions do not change during the movement of interest.19
The measurements of diameters and lengths were performed using a caliper gauge, (model 01290; Lafayette Instrument Company, Lafayette, IN, USA) and the circumferences were measured by a 30 cm measuring tape. Following the anthropometric assessment, the reflective markers were placed and the intersegmental rods were positioned.20
Protocol of three-dimensional
gait analysis
Utilizing the positioned reflective markers and intersegmental rods, the three-dimensional coordinates of the system, comprising the pelvis, thigh, leg, and feet, were established. We used 06 Pulnix® infrared cameras (model TM 6701AN;
Pulnix Inc, Sunnyvale, CA, USA), and the results of kinematics obtained through a capture rate of 120 Hz/second. The cameras were synchronized to two AMTI® force
platforms model OR6-5-1000 (Advanced Mechanical Technology Inc, Watertown, MA, USA). The identification of markers and the calculation of variables were performed by the Vicon Motus® 9.2 system (Vicon Motion Systems Inc,
Centennial, CO, USA).
We considered the following linear kinematic parameters: step length, stride length, speed, and cadence. The analysis of angular kinematic parameters consisted of joint angles
Dovepress
Silva-Hamu et al
International Journal of General Medicine downloaded from https://www.dovepress.com/ by 118.70.13.36 on 22-Aug-2020
performed by the knee and ankle joints during walking movement.21,22
Statistical analysis
Statistical analysis was performed using the Statistical Package for the Social Sciences version 20.0 (IBM Corporation, Armonk, NY, USA). To analyze the normality of the data we used the Kolmogorov–Smirnov test. Later, a parametric test (Student’s t-test) was applied to independent samples to compare the sample characteristics (age, weight, height, and BMI) and the results of the linear and angular kinematic parameters. In all the analyses, the level of significance was 5% (P, 0.05). Afterwards, the Bonferroni correction test was performed in order to adjust the P value, using R version 2.10.1 (Free Software Foundation, MA, USA).
Results
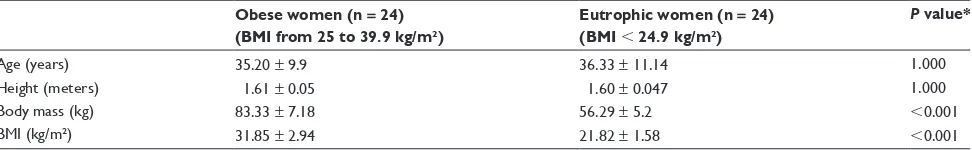
The description of the age and anthropometric characteristics of the study participants is presented in Table 1. There were statistical differences in body mass between the groups, whereas there was no statistically significant difference in height, indicating that the BMI was strongly influenced by the body mass.
The spatiotemporal linear variables analyzed in this study showed a statistically significant decrease (P, 0.05) in obese women as indicated in Table 2.
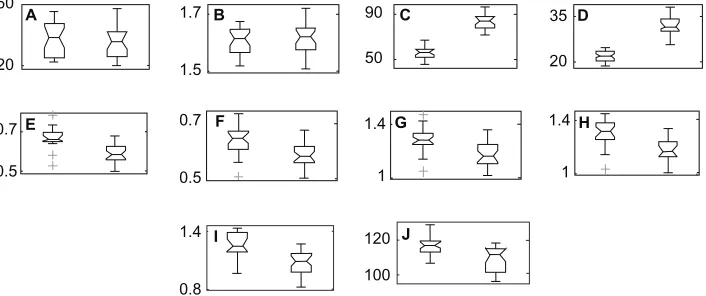
Figure 1 shows the result of size estimation of the differences in sample characteristics as well as the linear parameters of gait between groups of obese and normal weight women. The numbers to the left in the figure indicate the minimum and maximum values of each parameter presented.
The kinematic analysis of angular measurements in the sagittal plane21 in the group of obese women and the group
of eutrophic women was performed for the knee and ankle joints. This study revealed that the angular movement of the knee of obese women was quite similar to that of eutrophic women, but with a delay in tracing, especially in the second wave of bending as shown in Figure 2.
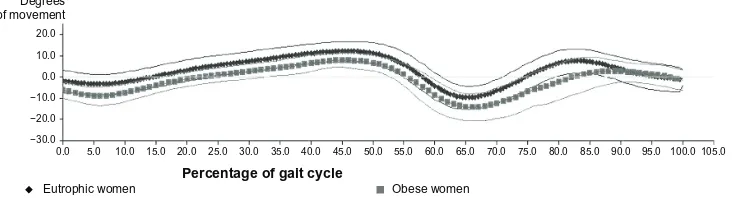
Figure 3 shows that the ankle of both the eutrophic women and obese women had plantar flexor curves and dorsiflexion in the sagittal plane; however, there is a noticeable delay in the graph of obese women relative to the trace graph of normal weight women. This finding relates to the important reduction of the space–time variables. Delay of the angular movement of the ankle joint of obese women is noted in almost all of the gait cycle.
Discussion
The three-dimensional analysis of the kinematic parameters of gait is routinely used in clinical evaluation of locomotion in order to provide an outcome measure, which is essential for the therapeutic applicability of scientific research.23 The
kinematic findings vary according to sex, and in the pres-ent study we chose to analyze the gait of women because, although they have an equivalent BMI to men, they have significantly higher amounts of total body fat. Comparison between the sexes would have influenced the study.6 The
study sample was defined as 24 obese women and 24 women with normal weight, and was based on studies on kinetic and kinematic analyses in obese subjects.17,18,24–27
The age of participants ranged from 20–60 years, an economically active age group in which movement disorders may cause greater functional and labor impairment. We also considered that human gait shows expected decreases after 60 years of age.28,29
Gait patterns show changes during motor development, and in gait analysis in children, it is clear that their standard varies according to the acquisition of motor skills, maturity in general, and body size.30 In adults, the first two factors
have already reached full development, and body size (height and weight) remain the most influential factor. Stride length is influenced by the height of an individual and possibly by the weight, age, and sex as well.31
There is consensus in the literature that height interferes with the spatiotemporal parameters of gait. This is even more noticeable when the presence of height in all normalization
Table 1 Mean and standard deviation of sample age, height, body weight, and body mass index for the obese women group and eutrophic women group
Obese women (n = 24) (BMI from 25 to 39.9 kg/m²)
Eutrophic women (n = 24) (BMI , 24.9 kg/m²)
P value*
Age (years) 35.20 ± 9.9 36.33 ± 11.14 1.000
Height (meters) 1.61 ± 0.05 1.60 ± 0.047 1.000
Body mass (kg) 83.33 ± 7.18 56.29 ± 5.2 ,0.001
BMI (kg/m²) 31.85 ± 2.94 21.82 ± 1.58 ,0.001
Notes: *P value – Student’s t-test for independent multiple samples (P, 0.05), followed by the Bonferroni correction test.
Abbreviation: BMI, body mass index.
Dovepress Obesity and gait in young women
International Journal of General Medicine downloaded from https://www.dovepress.com/ by 118.70.13.36 on 22-Aug-2020
formulas has been verified, indicating its fundamental influence.32 Height directly influences the speed and cadence
of women who have different physical dimensions. Height is the factor that exerts the greatest influence on the linear parameters.20 In this study no statistical difference was found
between the two groups with regard to height (P. 0.05), demonstrating that the sample varied only in body mass. Statistical analysis (P, 0.001) confirmed the fact that the BMI for the groups showed a significant difference. It can be inferred that changes in gait pattern did not suffer interference by the height but by the BMI in this study.
The present study identified a decrease in speed and cadence in the gait of obese women compared to eutrophic women. A study of observational gait analysis performed with 34 obese individuals with BMI of 40.1 ± 6.0 kg/m²
found that the measured kinematic variables (speed, cadence, and stride length) had lower values than the benchmark values for the normal population.11 In a three-dimensional
gait analysis of eight women and six obese men with an average BMI of 33.4 ± 4.2 kg/m², obese individuals had a shorter stride length, were slower, and spent more time in the stance phase and double support when compared to eutrophic individuals.18
Scientific reports demonstrate the influence of speed on the other linear features, even indicating a dependency relationship among them. In general, when one increases the speed during walking, one takes longer steps and has a higher cadence, but the reverse can also be true.22 The speed
can be also responsible for the knee joint decreased range of motion. Research shows that the lower the speed, the lower the knee range of motion and vice versa.21
It can be inferred that obesity influenced the walking speed of these women. When we observe that the cadence is directly proportional to the speed,31 we can understand that
the latter has its value decreased, due to both increased BMI and the reduction of speed. An observational study25 assessed
the components of function and disability in a group with class III obesity (14 obese individuals) and a group that was overweight or class I obesity (18 obese individuals), with age ranging from 26–63 years, and primarily female (87%). Velocity, cadence, and stride length were measured through gait observation during a 6-minute walk. Both mean velocity and cadence for the class III cohort decreased in comparison with the non-class III group and with normative values.25
The analysis of angular measurements in the sagittal plane is the most frequently used tool for gait analysis research.18
Ample movements are made in the sagittal plane; however, variation among individuals is very small, and this analysis is highly sensitive to angular values.28 In the frontal and
60
20
A 1.7
1.5
B 90
50
C 35
20
D
0.7
0.5
F 1.4
1
H
1.4
1
G
1.4
0.8
I 120
100
J
0.7
0.5
E
Figure 1 Resultsof the estimated differences between groups. Normal weight women on the left and obese women on the right. (A) age (years), (B) height (meters), (C) body mass (kg), (D) BMI (kg/m2), (E) length of right step (meters), (F) length of left step (meters), (G) length of right stride (meters), (H) length of left stride (meters), (I)
speed (meters/second), (J) cadence (steps/minute).
Note: The numbers to the left in the figure indicate the minimum and maximum values of each parameter presented.
Table 2 Mean and standard deviation of the linear parameters of gait for the obese women group and the eutrophic women group
Obese women (BMI from 25 to 39.9 kg/m²)
Eutrophic women (BMI , 24.9 kg/m²)
P value*
Length of right step (meter)
0.59 ± 0.04 0.64 ± 0.05 ,0.001
Length of left step (meter)
0.58 ± 0.04 0.64 ± 0.05 0.014
Length of right stride (meter)
1.18 ± 0.09 1.29 ± 0.86 0.003
Length of left stride (meter)
1.17 ± 0.8 1.26 ± 0.97 ,0.001
Speed (meter/ second)
1.06 ± 0.123 1.22 ± 0.113 ,0.001
Cadence (steps/minute)
108.64 ± 6.98 116.89 ± 5.46 0.01
Notes: *P value – Student’s t-test for independent multiple samples (P, 0.05), followed by the Bonferroni correction test.
Abbreviation: BMI, body mass index.
Dovepress
Silva-Hamu et al
International Journal of General Medicine downloaded from https://www.dovepress.com/ by 118.70.13.36 on 22-Aug-2020
transverse planes, there is great variation among individuals, and consequent inaccuracy in the findings.31
The literature shows no consensus on changes in the knee angle in obese individuals. In contrast, several studies show that there is a correlation between the anthropometric patterns of these individuals correlated with joint overexertion and development of osteoarthritis.33–35
In this study the angular movement of the knee of the obese women was quite similar to that of the eutrophic women, but with a delay especially in the second wave of flexion. This can be explained by the fact that in the terminal-swing phase, the moment of inertia is responsible for the presence of the passive pendular movement performed by the lower limb when it moves forward.19,31
Since the mass is directly proportional to the moment of inertia, when this is increased, as seen in obese women in this study, there is a tendency toward exacerbation of the pendular movement. In an attempt to contain this exaggerated limb movement forward, the knee flexor muscles (semitendinosus, semimembranosus, and biceps femoris) increase their action and hold the knee joint in flexion.36 This explains the greatly
increased range of flexion in the knees of obese women in the terminal swing phase.
The plantar flexion curves and dorsiflexion are the most complex in the sagittal plane. The plantar flexion movement is due to the initial moment of force caused by the ground reaction force generated until the full support of the foot occurs.15 As regards the assessment of the ankle, it was
identified in this study that both the ankle of eutrophic women and obese women had plantar flexion curves and dorsiflexion in the sagittal plane.
There is a noticeable delay in the graph of obese women in relation to the graphic line of eutrophic women. The findings, regarding the ankle, in the present study relate to the important decrease of the space–time variables. The obese individual has difficulty initiating walking movement due to the need to develop much greater ankle torque to keep balance. The reduction of the displacement of the center of body mass may be related to a limitation of the available muscle strength in these individuals due to their weight.36
This is a moment of great demand on the pretibial muscles in order to stop or decelerate plantar flexion when the weight load is transferred rapidly to the heel. The increased movement of plantar flexion in obese women is an indication that the pretibial muscles (tibialis anterior, Extensor digitorum longus, and Extensor hallucis longus) will be overexerted in the effort to decelerate this exaggerated plantar flexion.21
It is important to emphasize that the likely stimulus for increased muscular demand, especially in the tibialis anterior muscle, is the inertia of the foot while the tibia is moving forward. This intense muscle activity prepares the pretibial muscles, including the tibialis anterior, for the demands that they will suffer in response to the load.21,31 It is worth
noting that the inertial timing of any body segment is under direct influence of the body mass of the segment, and the
Degrees of movement
70.0 60.0 50.0 40.0 30.0 20.0 10.0 0.0 −10.0 0.0
Eutrophic women Percentage of gait cycle Obese women
5.0 10.0 15.0 20.0 25.0 30.0 35.0 40.0 45.0 50.0 55.0 60.0 65.0 70.0 75.0 80.0 85.0 90.0 95.0 100.0 105.0
Figure 2 Graphicalrepresentation of the angular average of the movements of flexion and knee extension in obese and eutrophic women.
Degrees of movement
20.0
10.0
0.0
−10.0
−20.0
−30.0 0.0
Eutrophic women Obese women
Percentage of gait cycle
5.0 10.0 15.0 20.0 25.0 30.0 35.0 40.0 45.0 50.0 55.0 60.0 65.0 70.0 75.0 80.0 85.0 90.0 95.0 100.0 105.0
Figure 3 Graphicalrepresentation of the angular average of the movements of dorsiflexion and plantar flexion of the ankles in eutrophic and obese women.
Dovepress Obesity and gait in young women
International Journal of General Medicine downloaded from https://www.dovepress.com/ by 118.70.13.36 on 22-Aug-2020
body mass is directly proportional to the moment of inertia of the segments.31
Conclusion
In order to ascertain the impact of obesity on linear (speed, cadence, right and left step and stride lengths) and kinematic angular parameters of the gait in young obese women, this study demonstrated a decrease in these parameters. It was shown that obese women have a delay mainly in the second knee flexion wave initiation. It has also been stated that in all stages of the gait cycle, the ankle joint is delayed and shows a reduced range of motion and an overexertion in the pretibial and soleus muscles, simultaneously. Therefore, it is concluded that for this group, the three-dimensional analysis is a sensitive method to detect linear and joint disorders in gait in women with increased body mass index.
Disclosure
The authors report no conflicts of interest in this work.
References
1. Kelly T, Yang W, Chen CS, Reynolds K, He J. Global burden of obesity in 2005 and projections to 2030. Int J Obes. 2008;32(9):1431–1437. 2. Flegal KM, Carroll MD, Kit BK, Ogden CL. Prevalence of obesity
and trends in the distribution of body mass index among US adults, 1999–2010. JAMA. 2012;307(5):491–497.
3. Aitsi-Selmi A, Batty GD, Barbieri MA, et al. Childhood socioeconomic position, adult socioeconomic position and social mobility in relation to markers of adiposity in early adulthood: evidence of differential effects by gender in the 1978/79 Ribeirao Preto cohort study. Int J Obes (Lond). 2013;37(3):439–447.
4. Ogden CL, Yanovski SZ, Carroll MD, Flegal KM. The epidemiology of obesity. Gastroenterology. 2007;132(6):2087–2102.
5. Ryan M, Kanthala A, Cantrell A. The prevalence of obesity and obesity-related comorbidities in emergency medicine. Ann Emerg Med. 2011;58(4):S197–S198.
6. Gallagher D, Visser M, Sepúlveda D, Pierson RN, Harris T, Heymsfield SB. How useful is body mass index for comparison of body fatness across age, sex, and ethnic groups? Am J Epidemiol. 1996; 143(3):228–239.
7. Finucane MM, Stevens GA, Cowan MJ, et al; Global Burden of Metabolic Risk Factors of Chronic Disease Collaborating Group (Body Mass Index). National, regional, and global trends in body-mass index since 1980: systematic analysis of health examination surveys and epidemiological studies with 960 country-years and 9⋅1 million participants. Lancet. 2011;377(9765):557–567.
8. Anandacoomarasamy A, Caterson I, Sambrook P, Fransen M, March L. The impact of obesity on the musculoskeletal system. Int J Obes (Lond). 2008;32(2):211–222.
9. Greve J, Alonso A, Bordini AC, Camanho GL. Correlation between body mass index and postural balance. Clinics(Sao Paulo). 2007;62(6):717–720. 10. Browning RC, Kram R. Energetic cost and preferred speed of walking
in obese vs normal weight women. Obes Res. 2005;13(5):891–899. 11. de Souza SA, Faintuch J, Valezi AC, et al. Gait cinematic analysis in
morbidly obese patients. Obes Surg. 2005;15(9):1238–1242. 12. Hills AP, Hennig EM, McDonald M, Bar-Or O. Plantar pressure
differences between obese and non-obese adults: a biomechanical analysis. Int J Obes Relat Metab Disord. 2001;25(11):1674–1679.
13. Browning RC, Baker EA, Herron JA, Kram R. Effects of obesity and sex on the energetic cost and preferred speed of walking. J Appl Physiol. 2006;100(2):390–398.
14. Hulens M, Vansant G, Lysens R, Claessens AL, Muls E, Brumagne S. Study of differences in peripheral muscle strength of lean versus obese women: an allometric approach. Int J Obes Relat Metab Disord. 2001; 25(5):676–681.
15. Mattsson E, Larsson UE, Rössner S. Is walking for exercise too exhausting for obese women? Int J Obes Relat Metab Disord. 1997; 21(5):380–386.
16. Larsson UE, Mattsson E. Perceived disability and observed functional limitations in obese women. Int J Obes Relat Metab Disord. 2001; 25(11):1705–1712.
17. Vartiainen P, Bragge T, Lyytinen T, Hakkarainen M, Karjalainen PA, Arokoski JP. Kinematic and kinetic changes in obese gait in bariatric surgery-induced weight loss. J Biomech. 2012;45(10):1769–1774. 18. Lai PP, Leung AK, Li AN, Zhang M. Three-dimensional gait analysis of
obese adults. Clin Biomech (Bristol, Avon). 2008;23(Suppl 1):S2–S6. 19. Vaughan CL, Davis BL, O’Connor JC. Dynamics of Human Gait,
2nd ed. Vaughan CL, editor. Cape Town, South Africa: Kiboho Publishers; 1992.
20. Kadaba MP, Ramakrishnan HK, Wootten ME. Measurement of lower extremity kinematics during level walking. J Orthop Res. 1990;8(3): 383–392.
21. Perry J, Burnfield JM. Gait Analysis:Normal and Pathological Function, 2nd ed. Thorofare, New Jersey: SLACK Incorporated; 2010. 22. Rose J, Gamble JG. Human Walking, 3rd ed. Philadelphia, PA:
Lippincott Williams & Wilkins; 2005.
23. McGinley JL, Baker R, Wolfe R, Morris ME. The reliability of three-dimensional kinematic gait measurements: a systematic review. Gait Posture. 2009;29(3):360–369.
24. Handrigan GA, Berrigan F, Hue O, et al. The effects of muscle strength on center of pressure-based measures of postural sway in obese and heavy athletic individuals. Gait Posture. 2012;35(1):88–91.
25. Ling C, Kelechi T, Mueller M, Brotherton S, Smith S. Gait and function in class III obesity. J Obes. 2012;2012:257468.
26. Menegoni F, Galli M, Tacchini E, Vismara L, Cavigioli M, Capodaglio P. Gender-specific effect of obesity on balance. Obesity (Silver Spring). 2009;17(10):1951–1956.
27. Spyropoulos P, Pisciotta JC, Pavlou KN, Cairns MA, Simon SR. Biomechanical gait analysis in obese men. Arch Phys Med Rehabil. 1991;72(13):1065–1070.
28. Lord SR, Lloyd DG, Li SK. Sensori-motor function, gait patterns and falls in community-dwelling women. Age Ageing. 1996;25(4):292–299. 29. Hageman PA, Blanke DJ. Comparison of gait of young women and
elderly women. Phys Ther. 1986 Sep;66(9):1382–1387.
30. Sutherland DH, Olshen RA, Cooper L, Woo SL. The development of mature gait. J Bone Joint Surg. 1980;62(3):336–353.
31. Winter DA. The Biomechanics and Motor Control of Human Gait: Normal, Elderly and Pathological, 4th ed. Hoboken, New Jersey: John Wiley & Sons; 2009.
32. Cappozzo A. Three-dimensional analysis of human walking: experimental methods and associated artifacts. Hum Mov Sci. 1991;10: 589–602.
33. Khole P, Segal N, Yack HJ. Relationship between the anthropometric variables and frontal knee moments in healthy obese adults. Gait and Posture. 2006;24(Suppl 2):S29–S31.
34. Messier S, Gutekunst DJ, Davis C, DeVita P. Weight loss reduces knee-joint loads in overweight and obese older adults with knee osteoarthritis. Arthritis Rheum. 2005;52(7):2026–2032.
35. Powell A, Teichtahl AJ, Wluka AE, Cicuttini FM. Obesity: a preventable risk factor for large joint osteoarthritis which may act through biomechanical factors. Br J Sports Med. 2005;39(1):4–5.
36. Colné P, Frelut ML, Pérès G, Thoumie P. Postural control in obese adolescents assessed by limits of stability and gait initiation. Gait Posture. 2008;28(1):164–169.
Dovepress
Silva-Hamu et al
International Journal of General Medicine downloaded from https://www.dovepress.com/ by 118.70.13.36 on 22-Aug-2020
International Journal of General Medicine
Publish your work in this journal
Submit your manuscript here: http://www.dovepress.com/international-journal-of-general-medicine-journal
The International Journal of General Medicine is an international, peer-reviewed open-access journal that focuses on general and internal medicine, pathogenesis, epidemiology, diagnosis, monitoring and treat-ment protocols. The journal is characterized by the rapid reporting of reviews, original research and clinical studies across all disease areas.
A key focus is the elucidation of disease processes and management protocols resulting in improved outcomes for the patient.The manu-script management system is completely online and includes a very quick and fair peer-review system. Visit http://www.dovepress.com/ testimonials.php to read real quotes from published authors. Dovepress
Dove
press
Obesity and gait in young women
International Journal of General Medicine downloaded from https://www.dovepress.com/ by 118.70.13.36 on 22-Aug-2020