Comparing milk microbial quality and hygiene between milk processed at
home and milk processed by industries in Kicukiro district, Kigali
City-Rwanda
Onuike Godwin Ugochukwu1*, Jean Baptiste Niyibizi1,2
1. Mount Kenya university Rwanda, Medical Laboratory Sciences department
2. University of Global Health Equity, Rwanda, Basic Medical Sciences department
Corresponding Author: Onuike Godwin Ugochukwu,[email protected]
Abstract
Pasteurized milks are still causing food borne illness. Milk contamination can occur at any stage
from its way from cow to our tables. Usually milk is pure and sterile when produced in udder of a
healthy cow. Like humans, cow are reservoirs of bacteria which are harmless to humans and some
cows can harbour few bacteria that are harmful to humans even though they are not harmful to the
cow. Milk can be contaminated during or after milking. Also, cow feeds can be contaminated with mycotoxins such as aflatoxins produced by the fungi, Aspergillus flavus. Four types of aflatoxins
are known which are; aflatoxin B1, B2, G1, G2. Cows consuming feeds contaminated with aflatoxin B1 leads to secretion in the milk of aflatoxin M1 and M2 causing aflatoxicosis. Microbial contamination of milk and dairy products is a universal problem and foodborne infections
accounting for 20 million cases annually in the world have been identified as an important public
health and economic problem in developed as well as developing nations. The main objective of
this study was to determine milk microbial quality in Kicukiro district. The specific objectives are
to identify bacteria pathogens in milk collected in Kicukiro district, to compare milk quality among
sectors of Kicukiro district, to compare milk processed by industries and home-processed milk.
The methodology employed in this research was cross-sectional and experimental as the study
began with collection of raw data and went through laboratory analysis from July–August, 2018.
The findings showed that 59.56% of the milk fell within Grade I – Grade III (< 200,000 ≤ 2,000,000 cfu/ml) and 40.42 % of the milk samples were not within the acceptable limit of total count quality as per COMESA and EAS, non-lactobacilli and fungi were present in most samples as examined through microscope and no
Staphylococcus aureus was present in any sample as examined by catalase and coagulase tests.
Keywords: Contamination, pathogens, bacteria, Escherichia coli, Staphylococcus aureus,
hygiene, Shigella, salmonella, milk processing, foodborne infection, cfu.
1. Background
Milk is synthesized in specialized cells of the mammary gland and is virtually sterile when
secreted into the alveoli of the udder (Tolle, 1980). Beyond this stage of milk production,
microbial contamination can generally occur from three main sources, from within the udder,
from the exterior of the udder and from the surface of milk handling and storage equipment
(Bramleyet al., 1990). The health and hygiene of the cow, the environment in which the cow
is housed and milked and the procedures used in cleaning and sanitizing the milk and storage
equipment are all key in influencing the level of contamination of raw milk (Murphy et al.,
2010). Equally important are the temperature and length of storage, which allow microbial
contaminants to multiply and increase in numbers and all these factors will influence the total
bacteria count (TBC) or standard plate count (SPC) (Murphy et al., 2010). Raw milk as it
leaves the udder of healthy cows normally contains very low numbers of microorganisms and
generally will contain less than 1,000 total bacteria per ml (Kurweil, 1973). In healthy cows,
the teat cistern, teat canal and the teat apex may be colonized by a variety of microorganisms
although microbial contamination from within the udder of healthy animals is not considered
to contribute significantly to the total numbers of microorganisms in the bulk milk or to the
potential increase in bacterial number during refrigerated storage (Murphy et al., 2010).
Natural floras of the cow generally have little influence on Standard Plate Counts (SPCs) or
Total Bacterial Count. While the healthy udder should contribute very little to the total bacterial
count of bulk milk, a cow with mastitis has the potential to shed large numbers of
microorganisms into the milk supply. The influence of mastitis on the total bacterial count of
bulk milk depends on the strain of infecting microorganism(s), the stage of infection, and the
percentage of the herd infected (Murphy et al., 2010). Infected cows have the potential to shed
in excess of 107 bacteria per ml. If the milk from one cow with 107 bacteria per ml comprises
1% of the bulk tank milk, the total bulk tank count, disregarding other sources, would be 105
per ml (Bramleyet al., 1990). Mastitis organisms that most often influence the bulk milk count
are Streptococcus spp., most notably S.agalactiaeand S. uberis (Bramleyetal., 1990;Gonzalez
influence the bulk tank count as well. Staphylococcus aureus is not thought to be frequent
contributor to total bulk tank although counts as high as 60,000/ml have been documented
(Gonzalez et al., 1986). Detection of implied pathogens does not necessarily indicate that they
originate from cows with mastitis. Potential environmental mastitis pathogens and/or similar
organisms can occur in milk as a result of other contributing factors such as dirty cows, poor
equipment cleaning and/or poor cooling. Other environmental mastitis organisms including
coliform bacteria, streptococci and certain coagulase-negative staphylococcus spp., may
influence bulk milk bacteria counts through other means (Zehneret al., 1986). S. agalactiae
and S. aureus are not thought to grow significantly on soiled milking equipment or under
conditions of marginal or poor cooling. Their presence in bulk tank milk is considered strong
evidence that they originated from infected cows (Gonzalez et al., 1986; Bramleyet al., 1990).
2. Methods
Research design
The study design was cross-sectional and experimental to evaluate milk microbial quality in
Kicukiro district of Kigali Rwanda. Milk samples were taken from systematically selected
restaurants and shops that sell ready to drink milk in all sectors of Kicukiro district and were
analyzed in Mount Kenya University Laboratory through culturing, staining and biochemical tests
to determine possible species or strain of bacteria or fungi that might have contaminated any milk.
Sample collection
There was primary data and sample collections through personal interviews using well-structured
questionnaires and with use of clean sterile containers respectively.
Sample size
The sample size was 50 in other to represent the whole kicukiro district. 5 samples were collected
from each of the 10 sectors of Kicukiro district.
Sample analysis
Samples were analyzed in Mount Kenya University Laboratory through culturing, staining and
biochemical tests to determine possible species or strain of bacteria or fungi that might have
Data analysis
The result of the culture and data from the questionnaires were analyzed using excel and SPSS software
3. Results
3.1 Bacteriological analysis
3.1.1 Bacterial plating (culture)
For each milk sample tenfold, serial dilution (10-1to 10-6) were made in sterilised test tubes with
distilled water. One millilitre each of 10-4 was used for Total Bacterial count. Twenty millilitres of
Nutrient agar and the diluted milk sample were mixed thoroughly. Plates were allowed to cool and
solidify then they were incubated in an inverted position at 37°C. The incubation time for Total
Bacterial Count was 48hours.
3.1.2 Total Bacterial Count
Total colony/ bacterial count was performed with the colony counter. In Gahanga, 4/5 (80%) had
counts equal or less than 2,000,000 colony forming units(cfu) per ml, in Gatenga also2/5 (40%)
had counts equal or less than 2,000,000 colony forming units(cfu) per ml, in Gikondo 1/5 (10%)
had counts equal or less than 2,000,000 colony forming units(cfu) per ml,inKagarama, only two
samples were able to get and 0/2 (0%) of the samples had counts equal or less than 2,000,000
colony forming units(cfu) per ml, in Kanombe, 4/5 (80%) had counts equal or less than
2,000,000 colony forming units(cfu) per ml, in KIcukiro, 2/5 (40%) had counts equal or less than
2,000,000 colony forming units(cfu) per ml, in Kigarama, 4/5 (80%) had counts equal or less
than 2,000,000 colony forming units(cfu) per ml, in Masaka, 4/5 (80%) had counts equal or less
than 2,000,000 colony forming units(cfu) per ml, in Niboye, 3/5 (60%) had counts equal or less
than 2,000,000 colony forming units(cfu) per ml, in Nyarugunga, 4/5 (80%) had counts equal or
less than 2,000,000 colony forming units(cfu) per ml. In total, the district had 8(17.02%) of the
that lie in grade II i.e. < 2,00,000 – 1,000,000 (2.0x10⁵ – 1.0x10⁶) cfu/ml, 9(19.14%) of the
total sample that lie in grade III i.e. <1,000,000 - 2,000,000 (1.0x10⁶ -2.0x10⁶) cfu/mland
19(40.42%) of the total samples greater than 2,000,000 (2.0x10⁶) cfu/ml. (Table 3.1)
21 milk sellers buy fermented milk from industry while 26 milk sellers ferment their milk locally
at home. From the industrial fermented milk sellers, 11(52.4%) had less than 2,000,000 cfu/ml
and 10(47.6%) had greater than 2,000,000 cfu/ml. From the home fermented milk sellers,
17(65.4%) had less than 2,000,000 cfu/ml and 9(34.6%) had greater than 2,000,000 cfu/ml.
(Table 3.2)
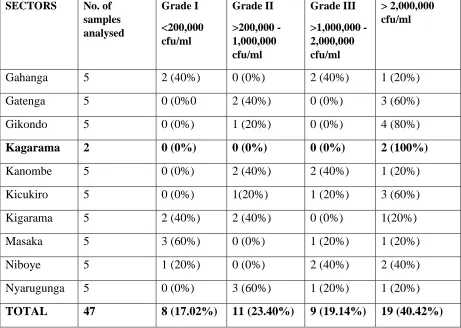
Table 3.1: Total count for bacteria, yeasts and moulds in samples from the 10 sectors of
kicukiro
SECTORS No. of
samples analysed Grade I <200,000 cfu/ml Grade II >200,000 -1,000,000 cfu/ml Grade III >1,000,000 - 2,000,000 cfu/ml > 2,000,000 cfu/ml
Gahanga 5 2 (40%) 0 (0%) 2 (40%) 1 (20%)
Gatenga 5 0 (0%0 2 (40%) 0 (0%) 3 (60%)
Gikondo 5 0 (0%) 1 (20%) 0 (0%) 4 (80%)
Kagarama 2 0 (0%) 0 (0%) 0 (0%) 2 (100%)
Kanombe 5 0 (0%) 2 (40%) 2 (40%) 1 (20%)
Kicukiro 5 0 (0%) 1(20%) 1 (20%) 3 (60%)
Kigarama 5 2 (40%) 2 (40%) 0 (0%) 1(20%)
Masaka 5 3 (60%) 0 (0%) 1 (20%) 1 (20%)
Niboye 5 1 (20%) 0 (0%) 2 (40%) 2 (40%)
Nyarugunga 5 0 (0%) 3 (60%) 1 (20%) 1 (20%)
TOTAL 47 8 (17.02%) 11 (23.40%) 9 (19.14%) 19 (40.42%)
Table 3.1 shows that masaka sector has the best milk than other sectors as 60% of the milk samples
milk as 100% of the only 2 sample fell out of standard (i.e. not within grade I - III) followed by
Gikondo with 80% out of standard, then both Gatenga and Kicukiro with 60% out of standard.
Table 3.2: comparison between industrially and home fermented milk
Method of
fermentation
No of
samples
< 2,000,000
cfu/ml
> 2,000,000
cfu/ml
Industrially
fermented
21
11(52.4%)
10(47.6%)
Locally/home
fermented
26
17(65.4%)
9(34.6%)
Table 3.2 shows that both industrially and home fermented milk have greater percentage that fell within the standard (< 2,000,000 cfu/ml).
3.1.3 Gram staining.
Milk samples were stained after incubation and colony count
Table 3.3: show different kinds of organisms (bacteria and fungi) seen with
microscope after Gram staining.
Sectors Media used Type of organisms seen
Gahanga Nutrient Agar Gram -ve bacilli, gram -ve coccobacilli, gram -ve diplobacilli, gram -ve filaments, gram +ve staph, gram -ve spore bearing filaments
Macconkey Agar Gram -ve bacilli, gram +ve coccobacilli (bipolar stain),
Gatenga Nutrient Agar Gram -ve bacilli, Gram -ve coccobacilli, gram
+vesteptobacilli& filaments, gram +ve staph, gram +ve cocci & diplococci, filaments with spores
Macconkey Agar Gram -ve bacilli, gram -ve filaments
Gikondo Nutrient Agar Gram +ve streptococci, gram +vediploocci, gram -ve coccobacilli, gram -ve bacilli, gram +ve bacilli, gram +ve cocci, gram +ve staph, Gram -ve coccobacilli (bipolar stain), Gram -ve staph, gram +ve streptococci
Macconkey Agar gram -ve bacilli.
Macconkey Agar Gram -ve coccobacilli, Gram -ve bacilli
Kanombe Nutrient Agar Gram +ve bacilli, Gram +vecocobacilli, Gram -ve coccobacilli, Gram +ve bacilli, Gram -ve coccobacilli, Gram -ve bacilli
Macconkey Agar No growth
Kicukiro Nutrient Agar Gram -ve coccobacilli, Gram -ve staph, Gram +ve streptococci, Gram +ve cocci, Gram +ve diplococci, Gram +ve, staph, Gram +ve filaments
Macconkey Agar Gram -ve coccobacilli, gram -ve bacilli
Kigarama Nutrient Agar gram -ve bacilli, gram +ve coccobacilli, gram +ve bacilli, gram +ve cocci
Macconkey Agar gram -ve bacilli
Masaka Nutrient Agar Gram -ve coccobacilli, gram +ve filaments, gram -ve filaments, gram +ve bacilli, gram -ve bacilli, gram +ve streptobacilli
Macconkey Agar No growth
Niboye Nutrient Agar Gram -ve coccobacilli, gram +ve cocci, gram +ve diplococci, Gram -ve coccobacilli,
Macconkey Agar Gram -ve coccobacilli, Gram -ve bacilli, Gram -ve coccobacilli,
Nyarugunga Nutrient Agar Gram +ve rods(bacilli), Gram -ve bacilli, Gram +ve bacilli, gram +ve coccobacilli, gram +ve
filaments(fungi), Gram -ve filaments.
Macconkey Agar Gram + streptococci, Gram -ve bacilli, Gram -ve filaments,
From table 3.3, it shows that non-lactobacilli and fungi were found in the milk samples of kicukiro district.
Gram +ve staph, Gram -ve bacilli and Gram -ve fungi with spores isolated from milk sample in Gahanga sector
Gram -ve bacilli & coccobacilli and Gram -ve bacilli & filamentous bacteria in nutrient agar and macconkey gar respectively isolated from milk samples in gatenga sector.
2 3
Gram -ve bacilli & filamentous bacteria (1), Gram -ve bacilli (2) and Gram -ve bacilli
&coccobacilli (3) in macconkey (1&2) and gar nutrient (3) agar respectively isolated from milk samples in Gikondo sector.
Gram +ve bacilli & Gram +vecocobacilli isolated from milk sample in Kanombe sector
1 2
3
1 2
3
Gram +ve/-ve bacilli &filaments(2), and Gram +ve bacilli &coccobacilli, Gram -ve bacilli (3) isolated from milk sample in Masaka sector
1 2
1 2
3
4 5
6
3.1.4 Biochemical tests
Biochemical tests; catalase and coagulase were done after gram staining in order to identify some bacteria.
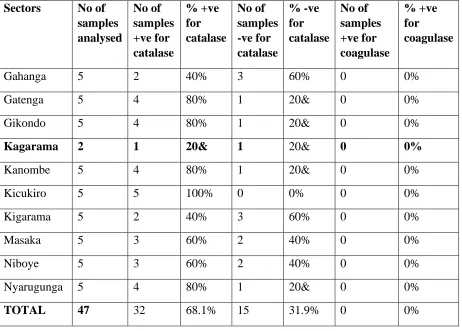
Table 3.4. shows the results biochemical tests (catalase and coagulase) done on the milk samples.
Sectors No of
samples analysed No of samples +ve for catalase % +ve for catalase No of samples -ve for catalase % -ve for catalase No of samples +ve for coagulase % +ve for coagulase
Gahanga 5 2 40% 3 60% 0 0%
Gatenga 5 4 80% 1 20& 0 0%
Gikondo 5 4 80% 1 20& 0 0%
Kagarama 2 1 20& 1 20& 0 0%
Kanombe 5 4 80% 1 20& 0 0%
Kicukiro 5 5 100% 0 0% 0 0%
Kigarama 5 2 40% 3 60% 0 0%
Masaka 5 3 60% 2 40% 0 0%
Niboye 5 3 60% 2 40% 0 0%
Nyarugunga 5 4 80% 1 20& 0 0%
TOTAL 47 32 68.1% 15 31.9% 0 0%
Table 3.4 shows the result of biochemical tests done on the samples; 68.1% of the samples were
positive for catalase, 31.9 % negative for catalase and none was positive for coagulase and it
indicates that the milk samples are free from staphylococcus aureus contamination as no sample
was positive for coagulase taste.
4. Discussion
The overall microbial quality of the milk supplied by milk sellers in kicukiro district can be said
% fell within Grade III making a total of 59.56% that fell within Grade I – Grade III (< 200,000 ≤
2,000,000 cfu/ml) and 40.42 % of the milk samples were not within the acceptable limit of total
count quality as per East African Standards (EAS) and Common Market for Eastern and Southern
Africa (COMESA) milk grading standard of 2,000,000 (2.0x10⁶) CFU/ML i.e. Grade III.(Table
3.1). Most of the milk sellers interviewed said that they wash all they used during fermentation
and this could be why there is reduction in the percentage of milk that is greater than 2,000,000.
The presence of fungi and other non-lactobacilli in most milk sample showed that the level of
hygiene employed by the milk sellers is low. (Figure 3.1).
Also, from the questionnaire used to collect the milk sample of kicukiro district,26(55.3%) out of
47 samples collected ferment their milk locally (Ikivuguto) and had nothing in place for
sterilization of their equipment and cans, 21(44.7%) buy fermented milk from industries. Only
8(17.02%) out of 47 had training on milk processing and contamination, 39(82.98%) out of 47 had
no training on milk processing and contamination
Those who sell fermented milk from industries are 21 while 26 sellers ferment at home. Out of 21
that buy fermented milk from industry, 11(52.4%) had cfu/ml <2,000,000 and 10(47.6%) had
cfu/ml >2,000,000. Out of the 26 that ferment at home, 17(65.4%) had cfu/ml <2,000,000 and
9(4.6%) had cfu/ml >2,000,000. A clear notice in these figures is that both have greater number
<2,000,000 especially the home fermented sellers.(Table 3.2). A common notice in most of the
restaurant is the presence of flies and this indicates poor hygiene and dirty environment, and this
could imply that even the industrial fermented milk gets contaminated during handling as well.
In a similar research done by Megan M.D. et al, 2015 on ‘‘Microbiological Analysis of Raw Milk
in Rwanda’’ showed that less than 13% of the samples from kiosks where milk is sold directly to
consumers meets the safe level of TBC per target standard while 94 % of samples from the
transporter segment has less than 2,000,000 cfu//ml and fell within COMESA grade III. The
increase of TBC observed along the value chain may be due to several factors, including
contamination, storage and transport in uncleaned cans and lack of controlled temperature along
All the milk sellers in Kicukiro district, Kigali Rwanda where the milk samples were collected had
no cows and so could not know exactly the quality of the milk they buy from the suppliers. Also,
the time of transporting the samples to the different milk sellers is a factor that could reduce the
milk quality if the temperature is not maintained.
It is also good that no samples tested positive for coagulase test and this implies that all the samples
are free of Staphilococcus aureus but the presence of fungi is some samples is worrisome as fungi
is can cause serious infection to the immunosuppressed individuals.(Table 3.4).
A research done by Kevin (2012) in Kenya also shows that 78% of the milk samples from Limuru
were of acceptable Total count as per the Kenya Bureau of Standards guidelines of ≤ 2,000,000
cfu/ml. (Kevin. K. K. 2012).
5. Conclusion
The apparent overall good quality of the milk in the district shows the willingness of majority of
the milk sellers to deliver milk with good quality to the consumers. In total, 59.56% fell within
Grade I – Grade III (< 200,000 ≤ 2,000,000 cfu/ml) and 40.42 % of the milk samples were not
within the acceptable limit of total count quality as per East African Standards (EAS) and Common
Market for Eastern and Southern Africa (COMESA) milk grading standard of 2,000,000 (2.0x10⁶)
CFU/ML i.e. Grade III.(Table 3.1). 68.1% of the samples were positive for catalase, 31.9 %
negative for catalase and none was positive for coagulase indicating that the milk in the district is
free from Staphylococcus aureus.(Table 3.4). There is possibility that if the milk sellers are trained
on milk hygiene, the district as a whole will be delivering good quality milk within the standards
of Common Market for Eastern and Southern Africa (COMESA) and East African Standards
(EAS). The poor hygiene within the restaurants shows that most milk sellers do not really
understand the effect of poor hygiene to the milk they sell. This research also has determined that
Masaka sector has that highest percentage of milk samples with good quality that fell within Grade
6. Declarations
Consent for publication
Authors have approved the publication of this paper.
Availability of data and material
The datasets used and/or analyzed during the current study are available from the corresponding
author.
Conflict of interests
The authors declare no conflicts of interests as far as this publication is concerned.
Ethical approval
This research was conducted after the approval of Mount Kenya University and the milk sellers in
sectors of Kicukiro district. The consents of the milk sellers were given through questionnaires.
Authors' Contributions
OGU came up with idea, collected data, conducted lab experiments, and drafted the proposal and
manuscript. JBN helped in analysis of results, read and revised the manuscript for publication.
Funding
This study did not receive a special grant to declare here, However the laboratory experiments
were supported by Mount Kenya University, Medical Laboratory Sciences department. Authors
bought some consumables. The funder was not involved in the manuscript writing, editing,
approval, or decision to publish this paper.
Acknowledgements
Authors are grateful Mount Kenya University to provide some laboratory facilities where the work
was conducted experimentally. Special thanks to Zacchaeus Thiauri, a lab technologist in
microbiology unit for his support during this work.
References
1. Bramley, A.J. and C.H. McKinnon. 1990. The microbiology of raw milk. pp. 163-208. In
2. Doyle, Megan & Garcia, Sara &Bahati, Emmanuel &Karamuzi, Dennis &Cullor, James
& Nandi, Somen. (2015). Microbiological analysis of raw milk in Rwanda. African
Journal of Food Science and Technology. 6. 141-143. 10.14303/ajfst.2015.053.
3. Gonzalez, R.N., D.E. Jasper, R.B. Busnell, and T.B. Farber. 1986. Relationship between
mastitis pathogen numbers in bulk tank milk and bovine udder infections. J. Amer. Vet.
Med. Assoc.189:442.
4. Kevin. K. K. (2012). assessment of milk quality and the potential of a quality based
payment system in small holder farms in limuru and eldoret, Kenya. Retrieved from
http://erepository.uonbi.ac.ke/bitstream/handle/11295/13805/Kabui%2C%20KK_Assess
ment%20Of%20Milk%20Quality%20And%20The%20Potential%20Of%20A%20Qualit
y%20Based%20Payment%20System%20In%20Small%20Holder%20Farms%20In%20L
imuru%20And%20Eldoret%2C%20%20Kenya.pdf?sequence=4&isAllowed=y accessed
on 20th June 2018
5. Kurweil, R., and M. Busse. 1973. Total count and microflora of freshly drawn milk.
Milchwissenschaft 28:427.
6. Murphy, S.C. K.J. Boor, Cornell University, Ithaca, NY. 2010. Sources and Causes of High
Bacteria Counts in Raw Milk: An Abbreviated Review. Retrieved from
http://articles.extension.org/pages/11811/sources-and-causes-of-high-bacteria-counts-in-raw-milk:-an-abbreviated-review. On 27thmay 2018.
7. Tolle, A. 1980. The microflora of the udder. p. 4. In Factors Influencing the Bacteriological
Quality of Raw Milk. International Dairy Federation Bulletin, Document 120.
8. Zehner, M.M., R.J. Farnsworth, R.D. Appleman, K. Larntz, and J.A. Springer. 1986.
Growth of environmental mastitis pathogens in various bedding materials. J. Dairy