Aus dem Institut für
Physiologie, physiologische Chemie und Tierernährung
der Tierärztlichen Fakultät der Ludwig-Maximilians-Universität München Geschäftsführender Vorstand:
Univ.-Prof. Dr. H.-J. Gabius
Arbeit angefertigt unter der Leitung von Prof. Dr. W. A. Rambeck
Investigations on bone metabolism in intact and ovariohysterectomised miniature pigs
Inaugural-Dissertation
zur Erlangung der tiermedizinischen Doktorwürde der Tierärztlichen Fakultät
der Ludwig-Maximilians-Universität München
von Brenda Babel
aus
Rheda Wiedenbrück
Gedruckt mit Genehmigung der Tierärztlichen Fakultät der Ludwig-Maximilians-Universität München
Dekan: Prof. Dr. E. Märtlbauer
Referent: Prof. Dr. W. Rambeck
Korreferent: Prof. Dr. B. Aigner
1 Introduction and aim of this study ... 3
2 Literature ... 5
2.1. Definition ... 5
2.2 World Health Organisation (WHO) definition of osteoporosis ... 5
2.2.1 Post menopausal osteoporosis ... 6
2.2.2 Secondary osteoporosis... 10
2.3 Osteoporosis imaging... 15
2.3.1 Osteodensitometry ... 15
2.3.1.1 Dual X-ray Absorptiometry ... 15
2.3.1.2 Quantitative computer tomography ... 17
2.3.1.3 Micro-computed tomography... 19
2.4 Biochemical parameters... 21
2.4.1 Markers of bone formation ... 21
2.4.1.1 Bone alkaline phosphatase ... 21
2.4.1.2 Osteocalcin ... 22
2.4.1.3 Propeptides of collagen type I ... 24
2.4.2 Markers of bone resorption ... 26
2.4.2.2 Pyridinium cross links (Pyridinoline and deoxypyridinoline) ... 27
2.4.2.3 Osteopontin... 28
2.4.3 Markers of bone turnover ... 30
2.4.3.1 Receptor activator of nuclear factor kappa B, receptor activator of nuclear factor kappa B ligand, osteoprotegerin... 30
2.4.3.2Bone Sialoprotein (BSP)... 31
2.4.3.3 Osteonectin ... 33
2.4.4 Bone marker variability... 34
2.5 Animal models used to study osteoporosis ... 42
2.5.1 Small animal models ... 43
2.5.1.1 Rodents... 43
2.5.2 Large animal models ... 44
2.5.2.1 Dogs... 44
2.5.2.2 Sheep... 45
2.5.2.3 Primates (non -human)... 46
2.5.2.4 Pigs ... 47
2.6 Induction and simulation of post menopausal osteoporosis ... 48
2.6.1 Oophorectomy, ovariohysterectomy... 48
2.6.2 Immunocastration... 49
3 Material and Methods ... 53
3.1 Animals used in this experiment ... 53
3.1.1 Animals care during the experiment ... 53
3.1.1.1 Feed ration... 53
3.1.1.2 Energy ration... 54
3.2 Feed Analysis ... 55
3.2.1 Weender Analysis ... 55
3.3 Design of the experiment ... 61
3.3.1 Ovulation synchronisation ... 61
3.3.2 Ovariohysterectomy ... 63
3.3.2.1 Anaesthesia and preparation ... 63
3.3.2.2 Operation ... 63
3.3.2.3 Postoperative care ... 64
3.4 Collection of blood samples ... 64
3.5 Analysing blood samples ... 65
3.5.1 Determining progesterone concentrations... 65
3.5.2 Determining estradiol concentrations ... 65
3.5.3 Determining bone markers ... 66
3.5.3.1 C-terminal telopeptides of collagen type I ... 66
3.5.3.2 Osteocalcin ... 67
4 Results... 69
4.1 Weight gain prior to castration ... 69
4.2 Pre-castration period... 72
4.2.1 Bone marker progression ... 72
4.2.1.1 Osteocalcin ... 72
4.2.1.2 Crosslaps ... 74
4.2.2 Hormone analysis... 75
4.2.2.1 Progesterone concentrations ... 75
4.2.2.2 Estradiol concentrations... 77
4.3 Post-castration period ... 79
4.3.1 Bone marker progression ... 79
4.3.1.1 Osteocalcin ... 79
4.3.1.2 Crosslaps... 80
4.3.2 Hormone analysis... 82
4.3.2.1 Progesterone concentrations ... 82
4.3.2.2 Estradiol concentrations... 84
4.4. Comparing cycle stage, calculated cycle day, progesterone and estradiol concentrations in all three groups ... 86
4.4.1 Pre-castration... 86
4.4.1.1 Control group ... 86
4.4.1.2 OVX group ... 88
4.4.1.3 Second control group ... 89
4.4.2 Post-castration ... 90
4.4.2.1 Control group ... 90
4.4.2.2 OVX group ... 92
4.4.2.3 Second control group ... 93
4.5 Correlations ... 94
4.5.1 Pre-castration... 94
4.5.1.1 Correlations in the control group ... 94
4.5.1.2 Correlations in the OVX group ... 96
4.5.1.3 Correlations in the second control group... 96
4.5.2 Post-castration ... 98
4.5.2.1 Correlations in the control group ... 98
4.5.2.2 Correlations in the OVX group ... 98
5 Discussion ...101
5.1 Weight gain during the experiment ...101
5.2 Parameter determination, test validation, sample extraction and sample handling ...102
5.3 Development of biochemical markers in the pre-castration period...106
5.3.1 Osteocalcin ...106
5.3.2 Crosslaps ...115
5.4 Development of biochemical markers in the post-castration period ...123
5.4.1 Osteocalcin ...123
5.4.2 Crosslaps ...127
5.5 The effect of calcium ration on bone metabolism markers...128
6 Summary ...132
7 Zusammenfassung ...134
8 References ...137
9 Acknowledgments ...174
Table 1: WHO definition of osteoporosis, based on bone mineral density and T-scores using dual x-ray absorptiomerty of the proximal femur and spine (WHO, 1994) ... 6 Table 2: Etiology of secondary osteoporosis (Inaba et al., 2004)... 14 Table 3: Age and daily feed ration of all three test groups... 53 Table 4: Gross energy ration per kg feed measured by means of bomb
calorimetery... 55 Table 5: Nutritional content of the 0.99% calcium diet and 0.7% calcium diet
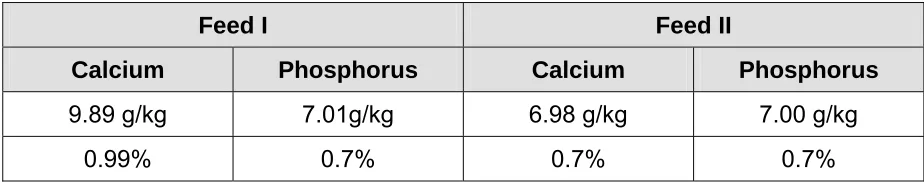
analysed with the Weender analysis. 0.99% calcium diet was allocated to the control group n=5. 0.7% calcium diet was allocated to the OVX n=5 and second control groups n=6 respectively. The nutritional content is displayed in % of the original substance (oS %) and % of the dry matter (dS) ... 58 Table 6: Calcium and phosphorus concentrations in g/kg feed and percent (%) in
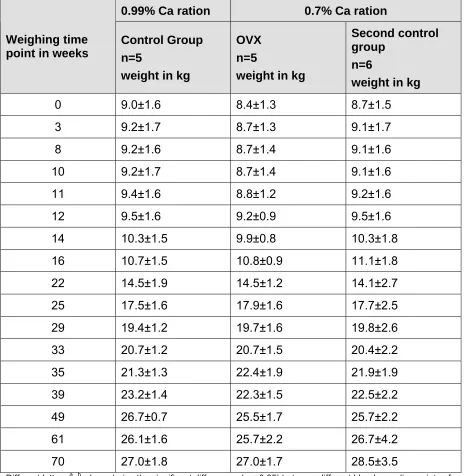
feed I and II ... 60 Table 7: Weight development of miniature pigs over a period of 70 weeks in
control n=5, OVX n=5 and second control n=6 groups in kilograms; mean ± standard deviation ... 70 Table 8: Osteocalcin concentrations (ng/ml) pre-castration, in control n=5, OVX
n=5 and second control n=6 groups at certain blood sampling points of time; mean values ± SD ... 73 Table 9: Comparing osteocalcin concentrations among the experimental groups
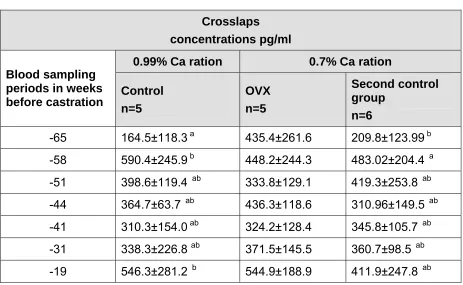
control n=5, OVX n=5 and second control n=6 pre-castration using area under the curve. Mean area under the curve ± SD is represented for each group ... 73 Table 10: Crosslaps concentrations (pg/ml) pre-castration, in control n=5, OVX
n=5 and second control n=6 groups at certain blood sampling points of time; mean values ± SD ... 74 Table 11: Comparing crosslaps concentrations among the experimental groups
control n=5, OVX n=5 and second control n=6 pre-castration using area under the curve. Mean area under the curve ± SD is represented for each group ... 75 Table 12: Progesterone concentrations in ng/ml in control n=5, OVX n=5 and
second control n=6 groups mean ± SD. Blood sampling time points are demonstrated in weeks and days in the pre-castration period;
progesterone peaks are coloured grey... 76 Table 13: Comparing progesterone concentrations in control n=5, OVX n=5 and
second control n=6 groups pre-castration using area under the curve. Mean area under the curve ± SD is represented for each group... 77 Table 14: Estradiol concentrations (pg/ml) measured in week -47,-45,-44 and -41
pre-castration in control n=5, OVX n=5 and second control groups n=6; mean ± SD ... 78 Table 15: Comparing estradiol concentrations in control n=5, OVX n=5 and
second control n=6 groups pre-castration using area under the curve. Mean area under the curve ± SD is represented for each group... 78 Table 16: Osteocalcin concentrations (ng/ml), at castration and after castration in
Table 17: Comparing osteocalcin concentrations among the experimental groups control n=5, OVX n=4 and second control n=6 at castration and after castration using area under the curve. Mean area under the curve ± SD is represented for each group ... 80 Table 18: Crosslaps concentrations (pg/ml), at castration and after castration in
control n=5, OVX n=4 and second control n=6 groups; blood sampling periods displayed in weeks; mean values ± SD ... 81 Table 19: Comparing crosslaps concentrations among the experimental groups
control n=5, OVX n=4 and second control n=6 at castration and after castration, using area under the curve. Mean area under the curve ± SD is represented for each group ... 81 Table 20: Progesterone concentrations (ng/ml), at castration and after castration
in control n=5, OVX n=4 and second control n=6 groups; blood
sampling periods displayed in weeks; mean values ± SD... 83 Table 21: Comparing progesterone concentrations among the experimental
groups control n=5, OVX n=4 and second control n=6 at castration and after castration, using area under the curve. Mean area under the curve ± SD is represented for each group ... 83 Table 22: Estradiol concentrations (pg/ml) measured in week 0, 2, 4 and 6 during
the post-castration period in control n=5, OVX n=4 and second control groups n=6; mean ± SD ... 85 Table 23: Comparing estradiol concentrations among the experimental groups
control n=5, OVX n=4 and second control n=6 at castration and after castration, using area under the curve. Mean area under the curve ± SD is represented for each group ... 85 Table 24: Blood sampling point of time displayed in weeks; calculated day of
cycle in a 21 day cycle of a pig; mean± SD of estradiol in pg/ml,
progesterone in ng/ml, osteocalcin in ng/mg and crossLaps in pg/mg in the control group n=5 pre-castration ... 87 Table 25: Blood sampling point of time displayed in weeks; calculated day of
cycle in a 21 day cycle of a pig; mean± SD of estradiol in pg/ml, progesterone in ng/ml, osteocalcin in ng/ml and crosslaps in pg/ml in the OVX group n=5 pre-castration ... 89 Table 26: Blood sampling point of time displayed in weeks; calculated day of
cycle in a 21 day cycle of a pig; mean± SD of estradiol in pg/ml, progesterone in ng/ml, osteocalcin in ng/ml and crosslaps in pg/ml in the second control group n=6 pre-castration... 90 Table 27: Blood sampling point of time displayed in weeks; calculated day of cycle
in a 21 day cycle of a pig; mean± SD of estradiol in pg/ml, progesterone in ng/ml, osteocalcin in ng/mg and crosslaps in pg/mg in the control group n=5 at castration and after castration... 91 Table 28: Blood sampling point of time displayed in weeks; calculated day of
cycle in a 21 day cycle of a pig; mean± SD of estradiol in pg/ml, progesterone in ng/ml, osteocalcin in ng/ml and crosslaps in pg/ml in the OVX group n=5 at and after castration... 92 Table 29: Blood sampling point of time displayed in weeks; calculated day of
Table 30: Correlations for the parameters crosslaps, osteocalcin, progesterone and estradiol at all blood sampling points of time in the control group pre-castration (correlation coefficient R; significance p; n=number of samples analysed) ... 94 Table 31: correlations for osteocalcin, crosslaps, progesterone and estradiol at
certain blood sampling time points during the pre-castration period in the control group (correlation coefficient R; significance p; sampling time point in weeks) ... 95 Table 32: correlations for osteocalcin, crosslaps, progesterone and estradiol at
certain blood sampling time points in the pre-castration period in the OVX group (correlation coefficient R; significance p; sampling time point in weeks) ... 96 Table 33: Correlations for the parameters crosslaps, osteocalcin, progesterone
and estradiol at all blood sampling points of time in the second control group pre-castration (correlation coefficient R; significance p; n=number of samples analysed ... 97 Table 34: Correlations for the parameters crosslaps, osteocalcin, progesterone
and estradiol at all blood sampling points of time in the OVX group in the post-castration period (correlation coefficient R; significance p; n=number of samples analysed) ... 99 Table 35: correlations for osteocalcin, crosslaps, progesterone and estradiol at
certain blood sampling time points in the post-castration period in the OVX group (correlation coefficient R; significance p; sampling time point in weeks) ... 99 Table 36: correlations for osteocalcin, crosslaps, progesterone and estradiol at
certain blood sampling time points in the post-castration period in the second control group (correlation coefficient R; significance p; sampling time point in weeks) ...100
Diagram 1: Time schedule for the ovulation synchronisation and blood sampling. Day 1 indicates the first application day of Regumate®... 62 Diagram 2: schematic diagram of procedures during the experiment; 10 blood
samples were taken pre-castration (week -65,-58,-51,-47,-45,-44,-42,-41,-31,-19); 5 blood samples were taken post-castration (0, 2, 4, 6, 8); 0 being at OVX... 71 Diagram 3: osteocalcin concentrations (ng/ml) represented in mean and SD
calculated from mean and SD of control, OVX and second control group at 9, 10, 12, 13 and 14 months of age...108 Diagram 4: mean osteocalcin concentrations (ng/ml) in control, OVX and second
control, precastrastion, sample extraction time in weeks ...111 Diagram 5: mean progesterone concentrations (ng/ml) in control, OVX and second
control, precastrastion, sample extraction time in weeks ...111 Diagram 6: mean estradiol concentrations (pg/ml) in control, OVX and second
control, precastrastion, sample extraction time in weeks ...111 Diagram 7: crosslaps concentrations (pg/ml) represented in mean and SD
calculated from mean and SD of control, OVX and second control group at 9, 10, 12, 13 and 14 months of age...117 Diagram 8: mean crosslaps concentrations (pg/ml) in control, OVX and second
control groups pre-castration, sample extraction time in weeks ...122 Diagram 9: mean progesterone concentrations (ng/ml) in control, OVX and second
control groups pre-castration, sample extraction time in weeks ...122 Diagram 10: mean estradiol concentrations (pg/ml) in control, OVX and second
control pre-castration, sample extraction time in weeks...122 Diagram 11: Osteocalcin concentrations ng/ml (mean and SD) at extraction times 0,
2, 4, 6, 8 weeks; post-castration period in control, second control and OVX group ...124 Diagram 12: estradiol concentrations (pg/ml) mean and SD at extraction times 0, 2,
4, 6, 8 weeks in the post-castration period in control, second control and OVX groups...126 Diagram 13: progesterone concentrations (ng/ml) mean and SD at extraction times
0, 2, 4, 6, 8 weeks in the post-castration period in control, second control and OVX groups...126 Diagram 14: Crosslaps concentrations pg/ml (mean and SD) at extraction times 0, 2, 4, 6, 8 weeks; post-castration period in control, second control and OVX groups ...127 Diagram 15: Crosslaps concentrations pg/ml (mean and SD) at extraction times 0, 2,
4, 6, 8 weeks; post-castration period in control and second control groups ...129 Diagram 16: Osteocalcin concentrations ng/ml (mean and SD) at extraction times 0,
ALP Alkaline Phosphatase Arg arginine
BAP Bone specific Alkaline Phosphatase
BMC Bone Mineral Content
BMD Bone Mineral Density
BMU Bone Mineral Unit
BSP Bone Sialoprotein
cAMP Cyclic Adenosine Monophosphate CD4 Cluster of Differentiation 4
CT Computed Tomography
CTX Carboxy-terminal Telopeptide
DLG Deutsche Landwirtschaftliche Gesellschaft Dpd Desoxypyridinoline
DNA Deoxyribonucleic acid
DXA Dual X-ray Absorptiometry
EDTA Ethylen-Diamin-Tetra-Acetat ELISA Enzyme-linked Immuno Sorbent Assay
EU European Union
FDA Food and Drug Administration FGF Fibroblast Growth Factor FSH Follicle Stimulating Hormone g Ca/kg Gram calcium per Kilogram feed
Glu Glutamic acid
Gly Glycine
GnRH Gonadotropine Releasing Hormone g P/kg Gram Phosphorous pre Kilogram feed
hCG Human Chorionic Gonadotropine
His Histidine
ICTP Pyridinoline cross-linked carboxy-terminal telopeptide of type I collagen
LHRH Lutinising Hormone Releasing Hormone LPS Lipopolysaccharides
Micro-CT Micro-Computed Tomography
mmol/l Millimol/ litre
nm nanomol
NTX N-terminal Telopeptide
OCIF Osteoclastgenesis Inhibiting Factor OPG Osteoprotegerin
OVX Ovariohysterectomised PDGF Platlet Derived Growth Factor
PICP Carpoxy-terminal propeptide of type I collagen PINP Amino-terminal propeptide of type I collagen pQCT Peripheral Quantitave Computed Tomography Pro Proline
PTH Parathyroid Hormone
Pyd Pyridinoline
QCT Quantitave Computed Tomography
RANK Receptor Activator of Nuclear factor Kappa B
RANKL Receptor Activator of Nuclear factor Kappa B Ligand RIA Radioimmunoassay
SPARC Secreted Protein, Acidic and Rich in Cysteine
TGF Transforming Growth Factor
TNF Tumor Necrosis Factor
Trp Tryptophan Tyr Tyrosine VEGF Endothel growth factor
1 Introduction and aim of this study
Animal models provide uniform experimental material and allow extensive testing of potential therapies (medicinal and operative therapies such as prosthetic devices). The osteoporosis research in particular is one of the most common areas where animal models are necessary. The FDA, Food and Drug Administration, recommends two preclinical animal models, the ovariectomised (OVX) rat and a second non-rodent model, to demonstrate the efficiency and safety of new agents for the therapy of different diseases such as osteoporosis (Thompson et al., 1995).
The goal of an animal model is to replicate the human condition as closely as possible. This has proved to be difficult (Turner et al., 2001). Bellino, (2000) described the usefulness of pig models for humans and the limitations due to the lack of information available on the ovariectomised mature pig in cardiovascular studies, bone studies and sensitivity of bone density to dietary calcium.
Pigs can therefore be considered as appropriate animal models for the use in studies on osteoporosis. The most common form of osteoporosis is the post-menopausal osteoporosis. This condition can be simulated in animals by means of ovariohysterectomy or ovariectomy. The operation should cause an increased bone turnover, which results in a change in bone structure, due to estrogen deficiency, similar to the structure changes of human bones during menopause. Minipigs are not only useful as animal models for studying osteoporosis, but are also useful for the study of other diseases that influence bone metabolism. Bone metabolism, estrus cycle and gastrointestinal functions of the swine are positive features concerning them as an animal model (Turner, 2001).
These factors could cause misinterpretation of bone marker activity which leads to incorrect conclusions with reference to bone metabolism.
The objective of this study was to examine the dependence of bone marker activity (osteocalcin, a bone formation marker and crosslaps, a bone resorption marker) on the estrous cycle of the miniature pig. Studies in human medicine have confirmed bone marker fluctuations during the menstrual cycle, where hormone levels vary. These fluctuations are also possible in the animal model minipig.
Furthermore the behaviour of biochemical markers, osteocalcin and crosslaps were examined at and after ovariohysterectomy to determine the effect of OVX (ovariohysterectomy) on these specific bone markers in the miniature pig. The present study also determined the influence of calcium ration in feed on bone metabolism before and after castration.
To accomplish these objectives a pilot study is performed with 16 Dresdner minipigs. These are divided into three groups; control, OVX (ovariohysterectomised) group and a second control group. The control group receives a 0.99% calcium ration, whereas the OVX and second control group receive a 0.7% calcium ration. All animals are to be synchronised at the start of the study. The study consists of two periods; pre-castration and post-pre-castration. The OVX group will be ovariohysterectomised at the beginning of the post-castration period. Blood samples will be extracted in particular intervals pre-castration and post-castration. Formation marker osteocalcin, resorption marker crosslaps, progesterone and estradiol concentrations are to be determined from collected serum samples.
2 Literature
2.1. Definition
In 1993, the Consensus Development Conference reached the currently acceptable definition of osteoporosis: a systemic skeletal disorder characterised by low bone mass and micro-architectural deterioration of bone tissue, thus causing an increase in bone fragility and susceptibility to fracture risk (Consensus Development Conference, 1993). Characteristic for this disease are low- traumatic fractures. The disease has become a major public health problem. The costs for fracture treatment are staggering and many patients everyday life are affected seriously.
In 2000, this definition was modified to osteoporosis being defined as a skeletal disorder characterised by compromised bone strength that predisposes to an increased fracture risk. (NIH Consensus Development Panel on Osteoporosis Prevention and Therapy, 2001).
In addition to this definition, two main features to bone strength were added:
Bone density and bone quality. Bone density is expressed in grams of mineral per area volume. Bone quality refers to architecture, turnover, damage on bone (fractures) and mineralization.
2.2 World Health Organisation (WHO) definition of osteoporosis
Bone density correlates well with bone strength (NIH Consensus Development Panel on Osteoporosis Prevention and Therapy, 2001). The WHO defines osteoporosis on the basis of bone mineral density (BMD). It was assumed that the relative risk for fracture must be lowest when the BMD is highest (WHO, 1994). The lowest fracture risk would be between the ages of 20 and 40 in healthy people. The fracture risk in this group of people was set at 1.0. It was agreed to that the relative fracture risk doubles for each standard deviation (SD) decrement in BMD.
With this concept in mind, the WHO developed the following definitions:
Low bone mass (osteopenia) is defined as more than one, but less than, or equal to, 2.5 SD below the mean.
.
Osteoporosis is defined as more than 2.5 SD below the mean.
These definitions are often related to in T-scores. T-score refers to amount of standard deviations of the mean of healthy persons between the age of 25 and 40 years. Z-scores are scores, which are obtained from the mean bone density of persons in a comparative population.
Table 1: WHO definition of osteoporosis, based on bone mineral density and T-scores using dual x-ray absorptiomerty of the proximal femur and spine (WHO, 1994)
Normal T-score > -1
Osteopenia T-score < -1 > -2.5
Osteoporosis T-score< -2.5
Severe osteoporosis T-score< -2.5 and osteoporotic
fractures
2.2.1 Post- menopausal osteoporosis
Osteoporosis represents a bone mass loss unassociated with other chronic diseases and is related to an estrogen deficiency (Type I) and aging (Type II) (Gambacciani and Ciaponi, 2000; Riggs and Melton, 1986; Melton and Riggs, 1988). At the age of 45-50 years woman reach the stage were the ovieran function ceases. This causes a decline in the estrogen concentrations in the body. In women the most frequent type of osteoporosis is due to estrogen deprivation after menopause (Consensus Development Conference, 1993).
therapy and matched controls. Quantitive bone mineral assessments were obtained. Estrogen users showed significantly greater bone mineral. Lindsay, (1989) states that bone mass in females is fairly constant up until the 5th decade and then decline at all skeletal sites. Estrogen therapy prevents bone loss that follows menopause. Ham and Carlson, (2004) measured the trabecular bone volume in ovariectomised untreated, estrogen treated and soy phytestrogens treated monkeys. Estrogen decreased the bone turnover indices. Soy phytestrogens were protective against loss in bone volume. Some studies do not only measure the changes in bone, but also the changes in bone markers due to estrogen therapy. Watts et al. (2000) determined the relationships among bone mineral density changes and bone marker changes in post-menopausal women receiving estrogen and found that bone mineral density changes correlate significantly with bone marker changes at 6 months esterified estrogen therapy. Warming et al. (2004) evaluated the effectiveness of 17β-estradiol and drospirenone combination for the prevention of post-menopausal osteoporosis. Bone mineral density increased at lumber spine hip, and total body, while bone markers decreased (osteocalcin, serum bone alkaline phosphatase, serum Crosslaps and urinary Crosslaps) from base line.
Type II Osteoporosis is a result of aging. This affects all skeletal sites, both cortical and cancellous bone. It is a result of senile decline in bone mass (Riggs and Melton, 1986; Melton and Riggs, 1988).
Type III Osteoporosis is an idiopathic osteoporosis, which affects pre-menopausal women as well as middle aged men (Riggs and Melton, 1986; Melton and Riggs, 1988).
17 β-estradiol directly inhibits osteoclastic bone resorption through apoptosis of osteoclasts. An estrogen deficiency would cause an increased generation and activity of osteoclasts, which perforate bone trabeculae, thus causing strength loss and increased fracture risk (Hughes et al., 1996). Hughes et al. (1996) also showed that estrogen causes apoptosis in osteoclasts. In the presence of estrogen, osteoblasts produce transforming growth factor-beta 1 (TGF-beta). Anti TGF-beta antibody inhibited TGF-beta and estrogen. This may indicate that TGF-beta might mediate osteoclast apoptosis. Marie et al. (2000) states that soluble factors, which include bone morphometric proteins, leptin and TGF-beta, can modulate differentiation of mesenchymal stem cells to osteoblasts, chondrocytes or adipocytes. Interleukin 1 is another factor that is of particular interest in the pathogenesis of osteoporosis. This is a protein, which is known to stimulate bone resorption and perhaps formation. Pacifici et al. (1987) found that monocytes in osteoporotic patients produced more interleukin-1 than subjects in the control group.
Interleukin-1 released from peripheral blood monocytes, appeared to reflect bone formation.
Insulin-like growth-factor (IGF-I) is a regulator of osteoblast activity. A binding protein, insulin-like growth factor–binding protein-4 (IGFBP-4) suppresses biological activity of IGF-I. Parathyroid hormone (PTH) enhances binding activity of IGFBP-4. This is abolished through 17β-estradiol. Kudo et al. (1996) found that IGFBP-4 protease activity, in SaOS-2 cells, which is responsible for cleavage of IGFBP-4, was suppressed in parathyroid hormone-treated (PTH) cells. This suppression was reversed by adding 17β-estradiol. Kudo et al. (1996) explain that the inhibitory effect of PTH on osteoblastic activity occurs by inhibiting PTH-induced suppression of IGFBP-4 protease activity.
O´Shaughnessy et al. (2000) found that nitric oxide plays an important role in the stimulation of osteoblast activity through estrogen. Findings indicated that 17β -estradiol modulates osteoblast function by nitric oxide-dependant mechanisms.
This disease is responsible for considerable morbidity as well as deaths in many older women (Gambacciani and Ciaponi, 2000).
During normal aging, the decrease in trabecular bone strength is much more pronounced than the decline in apparent density (Mosekilde et al., 2000). With age the trabecular bone declines with a factor of four, density however declines with the factor of two. Certain factors such as the loss of connectivity in horizontal struts of trabecular network, due to osteoclastic perforations, micro fractures, change in bone mineral quality, influence strength and density, but it is not known how the relationship between the two is influenced (Mosekilde et al., 2000). Furthermore the interplay corticalis, trabecular network, effect of bone marrow as a hydraulic and the effect of soft tissues such as cartilage, connective tissue and muscle on these factors must be investigated further (Mosekilde et al., 2000).
2.2.2 Secondary osteoporosis
The National Institute of Health Osteoporosis and Related Bone Diseases- National Reference Centre (NIH ORBD-NRC, 2001) defines secondary osteoporosis as osteoporosis caused by certain medical conditions or treatments that interfere with the attainment of peak bone mass and / or precipitate bone loss. Cushing’s disease causes the body to produce excessive amounts of glucocorticoids, causing obesity, muscular wasting and accelerated bone loss. Effective agents that control inflammatory diseases, such as corticosteroids can cause osteoporosis (Sambrook and Lane, 2001). Glucocorticosteroids are commonly prescribed for treating a variety of inflammatory and allergic conditions, such as asthma, rheumatoid arthritis and inflammatory bowl disease. This can cause one of the most common forms of drug induced osteoporosis. Bone loss tends to be greater in individuals using oral forms of medication.
Glucocorticoids exert their negative effects on bone through mechanisms that are not yet completely elucidated (Minetto et al., 2004). An indirect mechanism leading to a decrease in bone mass is the glucocorticoid-induced impairment of gonadal steroid synthesis (Boscaro et al., 2001), which counteracts bone resorption (Canalis, 1996). The loss of muscle mass and strength in patients with Cushing’s Syndrome and patients that are treated with exogenous corticosteroids, may contribute to bone loss due to the decrease in tropic action of the muscle contraction on the bone (Lane and Lukert, 1998; Frost, 1987). Corticosteroids have an inhibitory effect on osteoblasts and the differentiation on osteoblast precursor cells. They also decrease the mRNA levels that code osteoblast products such as osteocalcin (Morrison et al., 1989). Glucocorticoid receptors have been identified in cells that reside in the bone microenvironment (Peck, 1984). These cells are able to produce and release cytokines and growth factors that influence bone turnover (Angeli et al., 2002; Kristo et al., 2002). Glucocorticoids can promote osteoclastgenesis by inhibiting osteoprotegerin (OPG) and enhancing RANK-L production by stromal cells (Hofbauer et al., 1999).
al., 1977; Hahn et al., 1981; Morris et al., 1990; Cosman et al., 1994). This leads to a secondary hyperparathyroidism and therefore an increase in bone absorption.
Adequate thyroid hormone levels are essential for normal bone remodelling. Elevated levels of these hormones, also known as thyrotoxicosis, have been linked to bone loss. Thyrotoxicosis can occur naturally from an overproduction by the thyroid gland and can also occur with extensive amounts of thyroid replacement (e.g. treating hypothyroidism). Thyroid hormone has an effect on osteoblasts via its specific nuclear receptor and thereby stimulates bone resorption (Britto et al., 1992; Kim et al., 1999; Allain and McGregor, 1993). The activity of osteoblasts and osteoclasts are both increased, whereas the osteoclast activity predominates, resulting in bone loss. Hyperthyroidism is thus one of the major causes of secondary osteoporosis (Riggs and Melton, 1986). The increased entry of calcium from the bone into the blood (due to increase of bone resorption) suppresses parathyroid hormone (PTH) secretion from the parathyroid gland. This results in a suppression of PTH-induced vitamin D activation in the kidneys, causing a decrease in intestinal calcium absorption and an increase in urinary calcium excretion, resulting in a calcium imbalance. This may accelerate bone loss in hyperthyroidism further (Shafer and Gregory, 1972).
Gonadotropin-releasing hormone agonist administration can cause an increase in bone turnover, due to estrogen deficiency. Stroup et al. (2001) treated cynomolus monkeys with gonadotropin-releasing hormone agonists, and found that bone turnover increased as early as 4 weeks after administration. Bone turnover returned to control levels in two weeks after the administration of estrogen. Medical castration, using gonadottropin-releasing hormone agonists, is widely accepted as androgen deprivation therapy for prostrate cancer. Miyaji et al. (2004) studied the effects of gonadottropin-releasing hormone agonists on bone metabolism markers and bone mineral density in patients with prostate cancer. A decrease in bone mineral density was observed. A functional coupling of bone resorption and bone formation markers suggested that gonadotropin-releasing hormone agonists stimulates bone formation to compensate lower bone mass.
density (Pack and Morrel, 2004). The cytochrome P450 system is induced through these medications, causing an increased conversion of vitamin D into polar inactive metabolites in liver microsomes, causing a reduced bioavailability of vitamin D (Gough et al., 1986; Perucca, 1987). This causes a decrease in intestinal calcium absorption, resulting in hypocalcaemia and an increase in circulating parathyroid hormone. Parathyroid hormone mobilizes calcium stores and subsequent bone turnover (Richens and Rowe, 1970; Hahn et al., 1972; Bouillon et al., 1975; Gough et al., 1986; Stamp et al., 1972; Weinstein et al., 1984).
Rheumatoid arthritis is a systemic autoimmune inflammatory disease that causes osteoporosis (Inaba, 2004). This is associated with three types of bone loss: local subchondral and joint margin bone erosion, paraarticular osteoporosis and generalised osteoporosis (Deodhar and Woolf, 1996). Recently it has been reported that serum TNF-α has a suppressive effect on bone formation. This is increased in rheumatoid arthritis patients. TNF- α may have an important role in the development of osteoblast dysfunction in these patients (Inaba, 2004). Major factors affecting bone loss in rheumatoid arthritis are age, menopausal states, impairment of activity of daily living (Inaba, 2004). In addition, treatment of rheumatoid arthritis with drugs such as glucocorticoid and methotrexate (Buckley et al., 1997) and malnutrition (Inaba et al., 2000) could have harmful effects on bone metabolism.
Bone metabolism is also affected in anorexia nervosa, due to multiple hormonal endocrine and nutritional factors (Munoz and Argente, 2002). Due to amenorrhea in this condition, estrogen deficiency has been described as the main source for bone loss. The mechanisms underlying the estrogen deficiency are not completely understood (Grinspoon et al., 2000). These are only few of the factors that may cause secondary osteoporosis.
In table 2 varies other etiological reasons for the occurrences of secondary osteoporosis are listed.
trends in the smoke exposed group. Mueller and Cievro, (1998) state that smoking has numerous health risks for women, one which includes ovulatory dysfunction and early menopause. Smoking is directly toxic to the ova and it decreases the estrogen secretion (Shulman et al., 1990). Cesar-Neto et al. (2003) found that tobacco smoke had more influence on bone implant contact (in terms of bone/implant contact area) than nicotine treatment alone in the tibiae of adult Winsar rats. This suggests that tobacco smoke constituents other than nicotine may be responsible for compromised biochemical properties of smoker skeleton.
Table 2: Etiology of secondary osteoporosis (Inaba et al., 2004)
Endocrine/ metabolic diseases
Hyperparathyroidism (primary, secondary) Thyrotoxicosis
Cushing syndrome Hypogonadism Diabetes mellitus Pregnancy
Anorexia nervosa
Inflammatory diseases
Rheumatoid arthritis Ankylosing spondylitis
Functional
Immobilization/weightlessness Chronic obstructive lung diseases Postgastrectomy
Hepatic disease (particularly primary bilary cirrhosis) Alcohol abuse
Following organ transplantation
Haematopoietic
Multiple myeloma Lymphoma/Leucemia Mastocytosis
Congenital
Osteogenesis imperfecta Menkes syndrome
Ehlers-Donlos syndrome Homocysteinuria
Marfan´s syndrome
Drugs
Corticosteroid Thyrotoxine
Anticonvulsants (barbiturates, phenytion)
2.3 Osteoporosis imaging
Osteoporotic fractures may be prevented if the disease is diagnosed soon enough. There are various techniques that enable assessment of osteoporotic bones. In human medicine certain bones have a predisposition to fracture. Important osteoporotic fractures are hip, vertebral and forearm fractures (Lau, 2001).The fracture incidence increases with age in both men and women, but remains higher in women throughout life (Lau, 2001). Conventional radiographs are not suited to diagnose early osteoporotic fractures (Link and Majumdar, 2003). Bone mass measurements are standard techniques in the diagnosis of osteoporosis (Link and Majumdar, 2003).
2.3.1 Osteodensitometry
Several techniques can be used to measure bone density (BMD) and bone mineral content (BMC). BMD measures bone density is the amount of bone tissue in a certain volume of bone, reflecting the amount of calcium in the bone. The strengths of bone mineral density are: it changes slowly, so it provides a statistic measurement of skeletal status; the variability within persons is very low and measurements are very precise; and it can be used to diagnose osteoporosis using the definitions proposed by the World Health Organisation (WHO) (Looker et al., 2000). BMC measures the mineral content in bone. In adult mammals, approximately 20% of the bone wet weight is water, 45% ash, 35% organic matter (Carter and Spengler, 1978). Calcium contributes 37% of the ash content and phosphor contributes 18.5%. On dry weight basis mineral content is 65-70% and organic matter is 30-35% (Keene et al., 2004).
2.3.1.1 Dual X-ray Absorptiometry
Accuracy is limited due to the differences in soft tissue composition in which the x-ray beams pass through (Blake et al., 2002). The preferred anatomic sites for DXA are the measurement of bone mineral in lumber spine, proximal femur and whole body. Peripheral sites can also be scanned (Njeh et al., 1999).
The first generation of DXA scanners used pinhole collimator that produced a pencil beam coupled to a single scintillation detector in the scanning arm. More advanced systems introduced a slit collimator to generate a fan beam coupled to a linear array of solid-state detectors. This shortens scan time and produces a higher resolution (Njeh et al., 1999). The latest DXA systems have two- dimensional detector arrays developed for digital radiography systems. They possess a cone-beam system. Measurements are done within seconds (Boudousq et al., 2003).
The main advantages of X- ray systems such as these are the shortened examination time due to an increased photon influence of the X-ray tube, greater accuracy and precision, which results in higher resolution and removal of errors due to source decay (Kelly et al., 1988). Another advantage of DXA is the low radiation exposure (Njeh et al., 1999).
2.3.1.2 Quantitative computer tomography
This technique measures volumetric measurements (mg/ml) of trabecular bone. Quantitative computer tomography (QCT) may be performed at any CT system. All that is required is a calibration phantom and dedicated software to improve precision. Measurements are done on spine and appendicular skeleton (spine and peripheral QCT).
Peripheral quantitave computed tomography (pQCT)
Spinal QCT
An external bone mineral reference phantom is used to calibrate the computed tomography measurements of bone-equivalent values. This is used as a control device to characterize the scanner and to perform a quality assurance test. During the scanning process, the spine and phantom should appear as a single object (Yoganandan et al., 2006). For the regions of interest in the vertebral bodies, special software is required to analyse the image. The most commonly examined vertebra range from the first to the third lumbar vertebral bodies. 8-10 mm thick sections are obtained by a lateral scout image. A low-dose technique and a gantry parallel to the vertebral endplates are required. To improve precision, reduce acquisition and analysis time, the placement of the region of interest and the sagital location of mid vertebral slices can be automated (Njeh et al., 1999; Glüer et al., 1988, Kalender et al., 1988).
2.3.1.3 Micro-computed tomography
Micro-computed tomography (micro-CT) is a technique for the non-destructive assessment and analysis of the three-dimensional trabecular bone structure (a network of plates and rods, arranged in a lattice-like network). A compact miniature scanner system has been developed by Rüegsegger et al. (1996). This CT-scanner, also referred to as desktop µCT, allows non-invasive imaging and quantitative morphometry of bone specimens of various sizes. It is therefore likely that this technique will allow characterisation of the effects of diseases and therapeutic agents on trabecular bone architecture in humans and in a variety of animals. Eckstein et al. (2002) examined the body composition, bone mineral states and architecture in Growth Hormone-transgenic mice. The femora of these mice were examined with DXA and micro-CT. A comparison of these two methods confirmed a high consistency between these two methods. Abe et al., (2000) observed the morphological characteristics of the femur in osteopetrotic (op/op) mice, using micro-computed tomography. The accuracy of the reconstructed 3-D images was confirmed by comparing an original femur. The arbitrary cross-section could be displayed on a screen and a detailed examination of the internal structures was possible. The volume percentage of the trabecular bone could be measured in three dimensions. It was confirmed that micro-CT can be applied to 3-D morphometric analysis.
The effect of ovariectomy in rats on the changes in trabecular structure in alveolar bone was investigated by Tanaka et al. (2003), using micro-CT. The alveolar trabeculae in the sham operated group had network structures, whereas rats, that were ovariectomised, had fragmented structures. Trabecular bone volume, number and thickness of ovariectomised rats were significantly lower than those found in the sham operated rats.
The ability to evaluate fracture risk at an early point of time is essential for the prognostics and the treatment of osteoporosis. Mittra et al. (2005) used sheep femoral trabecular bone, to investigate the interrelationship of trabecular mechanical and micro structural properties. These were analysed using mechanical testing and micro-CT. Findings showed, that micro-CT indices are structural in nature, e.g. structural model index (SMI) (Hildebrand and Ruegsegger, 1997), which expresses the structure of the trabeculae, is as good as density orientated indices in predicting strength in the trabecular region. The analysis also showed that a loss of bone primarily affects the connectedness and the number of trabeculae, while increased strength results in an increase of thickness of trabeculae while not improving connectedness.
Teo et al. (2006) studied the relationship between image intensity CT, cancellous bone micro-architecture (using micro-CT) and mechanical properties. It was found that the predictive power of bone strength and stiffness was improved with the combination of bone density and micro architecture information.
2.4 Biochemical parameters
Bone metabolism is a dynamic and continuous remodelling process that is normally maintained in a tightly coupled balance between resorption of old or injured bone and formation of new bone. Bone metabolism occurs on focused sites on the surface of the bone called bone remodelling units or bone metabolism units (BMU). Osteoclasts and osteoblasts are the cells that carry out bone metabolism at the specific BMU site. Osteoclasts resorb existing bone. Osteoblasts are responsible for bone formation. These replace the surfaces resorbed by the osteoclasts with a replacement bone matrix, termed osteoid. Some osteoblasts are entrapped in bone matrix. Here they become osteocytes. Osteoporosis is a condition in which an imbalance appears to be between bone resorption and formation, with bone resorption exceeding formation. Biochemical techniques have been developed to measure products of bone resorption and bone formation, and thus the degree of bone turnover is able to be measured. Markers of formation assess either osteoblastic synthetic activity or post release metabolism of procollagen. Resorption markers reflect osteoclast activity and or collagen degradation (Christenson, 1997).
2.4.1 Markers of bone formation
2.4.1.1 Bone alkaline phosphatase
Alkaline phosphatase (ALP) is a membrane bound protein that is synthesized by cells in a variety of tissues. In humans 4 isoenzymes have been identified. 3 are expressed in tissue specific distributions in the intestine, placenta, and germ cells (Prince, 1993). The fourth isoenzyme is tissue non-specific and is distributed throughout the body, but especially abundant in the liver, kidney and bone (Allen, 2003).
Four variants of ALP have been identified in animals: bone alkaline phophatase, intestinal ALP, liver ALP and in dogs the corticosteroid induced ALP. Liver and bone ALP are products of the same gene. They only differ in location numbers of posttranslational glycosylation sites, making them isoforms, rather than isoenzymes (Sanecki et al., 1990).
In young animals that still have an immature skeleton, the bone ALP will tend to be predominant. In mature and older animals, medication and disease could cause an increase in liver and corticosteroid- induced ALP (Saini and Saini, 1978).
Different tests have been developed to differentiate between different isoenzymes. Bone ALP can be isolated by heat denaturation or gel electrophoresis (Saini and Saini, 1978). More recently radioimmunoassays (RIA) and enzyme-linked-immuno-asorbert-assays (ELISA) (Price et al., 1997) have been developed for human use, but exhibit an acceptable cross reactivity with bone ALP from a number of animal species (Allen et al., 2000).
2.4.1.2 Osteocalcin
The active metabolite of 1, 25(OH) ² D3 enters the cell and binds with a vitamin D receptor. This complex forms a heterodimer with the retinoid receptor and binds to a vitamin D responsive element on a responsive gene e.g. on that of osteocalcin. Transcription and translation follows and proteins are formed such as osteocalcin (Lips, 2006).
Structurally, the mature osteocalcin peptide consists of two anti-parallel α-helical domains connected by a β turn. At the C-terminal end, there are two further β turns and a β sheet. The structure is stabilized by a Cys23-Cys29 disulphide bond. (Hauschka 1982, 1986). During the matrix synthesis, some osteocalcin is released into the bloodstream. This has a short half-life and is determined mainly by renal clearance. No intact osteocalcin is released during resorption, but fragments of osteocalcin are released in vitro and during resorption and formation. Osteocalcin may serve as a site for hydroxyapatite crystals (Delmas, 1993; Gamero et al., 1994; Taylor et al., 1990). Ivaska et al. (2004) discovered that intact and fragmented osteocalcin can also be released during bone resorption. Furthermore in addition to the conventional use of bone formation, osteocalcin can also be used as a marker of bone resorption in vitro and bone matrix derived osteocalcin may contribute to the circulating osteocalcin levels, suggesting that serum osteocalcin should be seen as a marker of bone turnover, rather than a marker of bone formation.
once to prevent degradation and generation of fragments. Osteocalcin is also reduced in lipemic serum, because it binds with lipids (Delmas et al., 1990).
A number of sensitive RIA and ELISA kits have been developed for measuring osteocalcin in humans. These assays may be used in some animals (these include pigs, goats, sheep, cows, horses, rabbits and primates). These are not appropriate for others such as dogs, rats, and mice. Sensitive and specific RIAs are now available commercially for rats and mice (Allen, 2003).
Carter et al. (1996), suggests that serum osteocalcin and 1, 25 dihydroxyvitamine D3 are better predictors of bone mineralization and or bone turnover in pigs than serum alkaline phosphatase. Brown et al. (1984) suggested that there are three different groups of postmenopausal osteoporotic women, those with normal, high and low bone formation. In support to this, osteocalcin concentrations have been reported to be similar, higher or lower than the normal age-match controls.
2.4.1.3 Propeptides of collagen type I
During the formation of new bone, collagen type I is synthesized by osteoblasts. The collagen molecule is synthesized as a much larger precursor procollagen molecule. This is secreted into the extra cellular space, where it is attacked by extra cellular protease, releasing free peptide sequences, amino-and carboxy termini of the procollagen type I molecule (Allen, 2003).
The serum concentrations of amino-terminal propeptide of type I collagen (PINP) also reflect changes in the synthesis of new collagen, by both osteoblasts in bone and by fibroblasts in other connective tissues (Eberling et al., 1992; Melkko et al., 1996). Unlike PICP, a portion of non-dialyzable hydroxyproline is incorporated into bone. This component of the measured fragment may represent bone resorption. PINP, however appears to be a more dynamic and sensitive marker for changes in bone formation, than PICP (Eberling and Åkesson, 2001).
Commercial RIA and ELISA kits are available for both PINP and PICP in humans. Some of these kits show cross reactivity in animals e.g. in sheep and pigs (Allen, 2003).
Palmieri et al. (2000) found that in the second phase of osteogenesis in vitro, rat osteoblasts secrete inducers of chemo taxis and chemo invasion of endothelcells and tumors cells. The protein was isolated and identified. It had two sequences coincident with amino-terminal amino acids, of the α1 and of the α2carboxyl propeptides of type I collagen, as physiologically produced by procollagen C proteinase. This could illustrate the unknown function for the carboxyl-terminal trimer as possibly relevant in promoting endothelial cell migration and vascularisation of tissue producing collagen type I.
2.4.2 Markers of bone resorption
The organic matrix of bone consists of up to 90% collagen type I. Type I collagen is rich in the amino acid hydroxyproline and has a triple helix structure. The strands of the triple helix are connected by cross-links between lysine or hydroxylysine residues, which join the non-helical amino-and-carboxy-terminal ends of one collagen molecule to the helical portion of an adjacent molecule (Eyre, 1987). The amino-and-carboxy-terminals of these collagen type I molecules are linked to the helical region of the adjacent collagen molecules through pyridinium cross-links, deoxypyridinoline (Dpd) and pyridinoline (Pyd). During bone resorption, hydroxyproline and pyridinium cross-links can be released with or without fragments of the collagen molecule. These are not reutilised.
2.4.2.1 Telopeptides of collagen type I
Collagen type I break down is mediated by acid proteases. This is an enzyme derived from osteoclasts. The break down leads to a release of free and peptide bound metabolites of collagen type I (Coleman, 2002). Fragments released from amino-and-carboxy-terminals of collagen type I molecules are termed N-terminal telopeptides (NTX) and C terminal telopeptides (CTX). These consist of short peptide sequences from helical region of the collagen type I molecule and the telopeptide region of the adjacent collagen molecule linked to the pyridinium cross-link (Pyridinoline (Pyd) or deoxypyridinoline (Dpd)). A portion of the telopeptides released from the bone is excreted in the urine, the remaining portion is metabolised in the liver and kidney (Hanson et al., 1992). These markers can be measured in the urine and serum. A third telopeptid, pyridinoline cross-linked carboxy-terminal-telopeptide of type I collagen (ICTP), can be measured in serum. This is a peptide, which is bound by hydroxypyridinium bridge proteins. These pyridinoline cross-links bind two telopeptid regions of one collagen molecule to another collagen molecule. When collagen is broken down, ICTP is set free into the circulation (Charles et al., 1994). This marker is not significantly affected by renal clearance in healthy individuals (Risteli et al., 1993).
cross-linked peptides and uncross-linked telopeptide chains. Estimations suggest that more than half of the trivalently cross-linked pool of carboxy-terminal telopeptides represent cross-linked structures other than pyridinolines and pyrroles. This suggests the presence of unknown, uncharacterised mature trivalent cross-links.
CTX, NTX and ICTP are commonly used to monitor skeletal effects of biphosphonate therapy for osteoporosis. All three markers have been used in animals. Different species have variable cross reactivity. NTX is measured by an immunoassay using an antibody to the α-2 chain of the NTX fragment (Hanson et al., 1992). CTX concentrations are also measured with an immunoassay. There is a cross reactivity for ICTP in commercial assays for dogs, cats, horses, pigs, rats and primates (Allen, 2003). NTX measurements have been done in growing minipigs kept in metabolic cages (Bollen et al., 1997). As shown in human studies, the reliability of measurements in urine is lower than those in plasma. It is of importance to choose appropriate biochemical markers to demonstrate effects of calcium on bone resorption. Guillemant et al. (2003) discovered that, for this purpose, CTX was more sensitive than NTX, while ICTP was not sensitive to acute changes in osteoclastic activity due to calcium intake.
2.4.2.2 Pyridinium cross links (Pyridinoline and deoxypyridinoline)
The modification of lysine and hydroxylysine produces non reducable pyridinium cross-links, pyridinoline (Pyd) and deoxypyridinoline (Dpd). These stabilize mature collagen. Both markers are released from bone in an approximate ratio of 3:1. Dpd is relatively specific for bone. Pyd is found in articular cartilage and soft tissue (ligaments and tendons). About 60% of the cross-links are bound to proteins. The rest are non protein bound. Pyridinium cross-links are not metabolised or absorbed from the diet (Colwell et al., 1993).
The elevation of pyridinoline is caused by hydroxylation of lysine residues within the collagen telopeptides. Not only processes in bone, but also fibrosis processes can cause an increase in hydroxylation. Cytokines such as transforming growth factor-ß induce substantial increase in lysyl hydroxylase 2b mRNA levels, which induces the hydroxylation of lysine residues and therefore an increase in pyridinoline. Similar effects were observed for Interleukin-4, activine A, and Tumor Necrosis Factor-α (van der Slot et al., 2005).
2.4.2.3 Osteopontin
Osteopontin is a non-collagenous protein. It is very abundant in bone matrix and is synthesised by osteoblast, osteoclasts and osteocytes (Yoshitake et al., 1999). Osteoclasts express αvβ3 integrin, which is a receptor for osteopontin (Flores et al., 1992). Yamate et al. (1997) reported that the expression of osteopontin by osteoclast and osteoblast progenitors in murine bone marrow increased after ovariectomy, and that osteopontin stimulated the interaction between osteoclast progeniters and stromal/osteoblastic support cells that generated tartrate-resistant acid phosphatase-positive cells. Yoshitake et al. (1999) report that osteopontin knock-out mice are resistant to ovariectomy-induced bone resorption compared to wild-type mice. It is speculated that the bone loss observed may be related to the requirement of efficient signalling through the αvβ3 integrin for optimal osteoclast function. So if osteopontin is deficient, as it is in knock-out mice, there is no high-affinity interaction between osteopontin and αvβ3 integrin and therefore less bone resorption activity by osteoclasts. Other non-collagenous proteins such as bone sialoprotein (BSP) can interact with αvβ3 integrin, but with less affinity. Whether osteopontin is required for human postmenopausal osteoporosis requires further investigation.
Parathyroid hormone (PTH) is often used to increase bone mass in osteoporosis patients. It has, however, diverse effect on cortical bone mass. PTH regulates the expression of osteopontin in osteoblasts and therefore osteopontin could be one of the targets of PTH in bone. Kitahara et al. (2003) examined the role of osteopontin in PTH actions and found that osteopontin deficiency induced PTH enhancement of whole-bone bone mineral density as well as cortical bone mass.
phosphorylated (Katayama et al., 1998). In a recent study were bone discs (wild-type, osteopontin-null) were implanted subcutaneously or intramuscularly in mice (wild-type, osteopontin-null), revealed the involvement of osteopontin in bone angiogenisis and osteoclast recruitment. The vascularisation and bone resorption were significantly impaired in the absence of osteopontin (Asou et al., 2001). As a molecule that mediates the attachment of bone cells to the bone matrix, osteopontin is poised to tranceduce any stress that would move the cell relative to the matrix (Denhardt et al., 2001). It can bind to hydroxylapitite, to osteocalcin (Ritter et al., 1992), and to type I collagen, especially after being cross-linked by tissue transglutaminase (Kaartinen et al., 1999). It is speculated that osteopontin released by the osteocytes and delivered to the bone surface, might attract osteoclast precursor cells and promote osteoclast mobility and that it could stimulate osteoclast differentiation in marrow, possibly by synergizing with a RANK/RANKL-generated signal (Denhardt et al., 2001).
2.4.3 Markers of bone turnover
2.4.3.1Receptor activator of nuclear factor kappa B, receptor activator of nuclear factor kappa B ligand, osteoprotegerin
RANK, Receptor Activator of Nuclear factor Kappa B, is a protein, which is crucial for all calciumtropic hormones and proresorptive cytokines, to increase calcemia and multiplication of osteoclasts in bone. This is found in the membrane of cells in osteoclast line and in dendritic cells (Suda et al., 1999). RANK is seen as a hematopoietic surface receptor controlling the calcium metabolism and the osteoclastgenesis (Kaneda et al., 2000). RANK ligand (RANKL), is a protein produced by the osteoblasts, cells of bone stroma and by activated T lymphocytes. This protein may promote osteoresorption by induction of cathapsin K gene expression (Suda et al., 1999; Corisdeo et al., 2001). It binds on the surface of preosteoclasts and stimulates their differentiation into mature osteoclasts, thus resulting in osteoabsorption. RANKL is a member of the Tumour Necrosis Factor (TNF) family. It is a crucial cytokine for the differentiation, activation and survival of the osteoclasts. It also acts as a regulator between osteoblasts and osteoclasts (Lacey et al., 1998). Osteoprotegerin or OCIF (OsteoClastogenesis InhibitingFactor) is a protein, which also belongs to the TNF family. Osteoprotegerin inhibits differentiation of progenitors into osteoblasts through binding with RANKL, thus inhibiting maturation of osteoclasts. It therefore competes with RANK. It displays hypocalcemic and antiresorptive effects (Suda et al., 1999). Osteoprotegerin is expressed by a variety of other organs and tissues such as the heart, lungs, kidney, bone and vessel wall (Simonet et al., 1997).
Imbalances in the ratio between Osteoprotegerin and RANKL or RANK underlie the pathology of many skeletal disorders which exhibit excessive bone loss, excessive bone formation or bone remodelling disorders, e.g. rheumatoid arthritis, periprosthetic osteolysis, tumour associated osteolysis, various osteopetosis or Paget´s disease (Hofbauer and Heufelder, 2001; Walsh and Choi, 2003; Sattler et al., 2004; Hofbauer and Schoppet 2004; Schoppet et al., 2002).
occurs through Transforming Growth Factor (TGF) β. Osteoprotegerin is stimulated by some of the same factors, such as vitamin D3, ILα, TNFα, IL6,11,17, calcium and estrogen ,TGF β and decreased by PTH, glucocoticoids, prostaglandin E2, insulin-like-growth factor 1 and immunosuppressants (Collin-Osdoby, 2004).
In vascular diseases, alterations in the RANK, RANKL, Osteoprotegerin system, have been implicated. Bone loss caused by osteoporosis has been prevented through blocking RANKL. Osteoprotegerin, RANK fusion proteins or RANKL antibodies may be used as a blockage. Other conditions such as chronic inflammatory disorders and malignant tumours in animal models have been prevented through a RANKL blockade. This may emerge as a therapy in humans for postmenopausal osteoporosis, myoloma and osteolytic metastasis (Hofbauer and Schoppet, 2004).
Up to now some studies have been performed that have produced contradictory results. Bone remodelling parameters showed only sporadically clear association with osteoprotegerin e.g. deoxypyridinoline and osteoprotegerin, C-terminal collagen I propeptide (Browner et al., 2001). While in other studies no correlations between bone markers and osteoprotegerin were found (Szulc et al., 2001). Browner et al. (2001) proved a slight negative correlation between calcium and osteoprotegerin and slight positive correlations between osteoprotegerin and parathyroid hormone. Osteoprotegerin has, however, had a favourable effect in individuals with osteoporosis or destructive bone diseases. It minimised the development of osteoporosis caused by ovariectomy and reduced development of experimental bone metastasis (Kostenuik and Shalhoub, 2001). These results indicate that the RANK, RANKL, Osteoprotegerin system can be used in diagnostics and therapy in osteoporosis and other conditions such as vascular diseases and tumours.
2.4.3.2 Bone Sialoprotein (BSP)
hydroxyapatite through polyglutamic acid, sequences (Oldberg et al., 1988). The deposition of BSP into the extra cellular matrix (Chen et al., 1991, 1992) and the ability to nucleate hydroxylapatite crystal formation indicate a potential role in the initial mineralization of bone (Hunter and Goldberg, 1993). BSP has been reported to be able to promote the differentiation of pre-osteoblasts into osteoblasts (Zhou et al., 1995). Valverde et al. (2005) suggest that BSP contributes to RANKL mediated bone resorption, by inducing osteoclastgenesis and osteoclast survival and deceasing osteoclast apoptosis.
transcription. This occurs through tyrosine and mitogen-activated protein kinase dependent pathways.
2.4.3.3 Osteonectin
Osteonectin is also known as Secreted Protein, Acidic and Rich in Cysteine (SPARC), which is a phosphorylated, acidic, glycine-rich protein, which binds calcium. It may, however, be involved in cell proliferation processes such as modelling of extracellular matrix. Osteonectin binds selectively to hydroxyapatite and to collagen fibrils at distinct sites in bone. It is responsible for the calcification of bone collagen (Termine et al., 1981). SPARC belongs to the matricellular group of proteins. It modulates cellular interaction with an extra- cellular matrix by binding structural matrix proteins such as collagen and vitronectin. It inhibits cellular proliferation by stopping cells of the G1 phase of the cell cycle. Other functions of this protein are regulating the activity of growth factors such as platelet-derived growth factor (PDGF), fibroblast growth factor (FGF)-2 and endothelial growth factor (VEGF). In adult animals, osteonectin is expressed largely in remodelling tissue such as bone, gut mucosa, healing wounds, tumours and disorders associated with fibrosis (Brekken and Sage, 2000). It is also secreted by human osteoblasts (Hunzelmann et al., 1998).
Osteonectin can be expressed by endothelium, in response to certain injuries. As a result of certain studies, it appears to regulate endothelial barrier functions, through F-actin-dependent changes in cell shape. The appearance of intercellular gaps changes and a paracellular pathway for extravasation of macromolecules is provided (Goldblum et al., 1994).
2.4.4 Bone marker variability
Bone remodelling is often referred to as coupling, which is a link between bone formation and bone resorption. The resorption process takes approximately 7-10 days, whereas the formation process takes 2-3 months. Resorption markers respond to therapy faster (2-12 weeks) than formation markers (3-6 months) (Bernardi et al., 2004). Serum and urinary markers are used as diagnostic and prognostic indicators of skeletal health and disease. The utility of these markers is critically dependent on the ability of the assay to detect significant variation from the normal (healthy) state. The variability within the assay technique (analytical variability) and the variability that is inherent within the study population (biological variability) determine the expressiveness of individual assays. Factors affecting biological variability include age, sex, nutrition, exercise, and systemic diseases (Watts, 1999; Souberbielle et al., 1999). In addition to these, pre-analytical variability can be caused by marked diurnal, day-to-day and seasonal variation or incorrect storage.
Pre-analytical and biological factors
Diurnal variation
The underlying basis for these temporal rhythms has not been explained, but links to activity, food and water intake, renal function and hormonal changes have been implicated (Mühlbauer and Fleisch, 1995; Nielson et al., 1991).
In humans bone alkaline phosphatase has been showed to increase in the morning to the afternoon. Osteocalcin increases at night (Nielson et al., 1990a). NTX, Pyd, Dpd increase at midnight (Schlemmer et al., 1994).
markers, but implied that the circadian variation may come at a later age when the skeleton has reached maturity.
Ostrowska et al. (2003) found that lighting conditions can influence daily fluctuations of biochemical bone markers in rats. The mechanism seems to be dependant on the changes of endogenous melatonin concentrations. Woitge et al. (2000) suggested that biochemical markers BAP, Pyd, Dpd, NTX and PTH, 25(OH) D3, 1.25(OH)2 D3 showed significant seasonal variation. Levels of biochemical markers and of PTH were highest in winter and most predominant in premenopausal women under fifty years of age and in subjects who showed a significant individual rhythm in 25(OH)D3. These changes are related directly to variations in the hormonal regulation of skeletal homeostasis.
Age, size, gender
telopeptides, cross-linked telopeptide of type I collagen, carboxy-terminal propeptide of type I procollagen, N-terminal propeptide of type I procollagen, alkaline phosphatase and osteocalcin during puberty. In girls this is approximately 2.5 years earlier than in boys. Children with growth hormone deficiency have reduced bone marker concentrations. These increase with the administration of growth hormone. Federico et al. (2003) showed that there were no changes in serum osteocalcin, carboxy-terminal propeptide of type I procollagen, and cross-linked carboxy-terminal telopeptide of type I collagen during puberty in growth hormone treated, growth hormone deficient children in a longitudinal study. The study, however, failed to demonstrate an association between short and long term changes in bone markers and the long term rate of growth or final height of individuals. Baroncelli et al. (2000) showed that children with a growth hormone deficiency had reduced bone turnovers at baseline. Long-term growth hormone therapy stimulated bone turnover. Osteocalcin, PICP, and ICTP, however, do not predict growth rate during long term treatment in children with growth hormone deficiency.
Nutrition
Bone metabolism is dependent on nutritional status. Malnutrition causes a disturbed bone metabolism, therefore causing changes in bone marker concentrations.
With the exception of hydroxyproline, substances contained in diet do not affect serum and urinary levels of bone markers (Bernardi et al., 2004). Extreme fasting over 4 days had no significant effect on pyridinium cross-link concentrations (Grinspoon et al., 1995). In severely malnourished children, however, concentrations were decreased by approximately one-third of those after recovery from malnourishment (Branca et al., 1992).
A cross-sectional study considered the influence of diets in women between the ages of 45-55 with regard to fruit and vegetable intake. The potassium, magnesium and phosphate intake correlated negatively with pyridinoline excretion. Potassium, magnesium, ß-carotine and fibre intake were negatively correlated with deoxypyridinoline excretion. Statistical calculations indicated that magnesium intake accounted for 12% of the variability (New et al., 2000). Vitamin D deficient diets or malabsorption reportedly caused an increase in pyridinium cross-links excretion. Concentrations were two to three times higher in deficient postmenopausal women than in healthy subjects (Kamel et al., 1994).
Exercise
Karlsson et al. (2003) studied the effect of exercise as a regulator of bone turnover. There were no differences in remodelling markers within the three groups of active soccer players. The active groups had higher bone markers than the controls. Former players had no differences in bone remodelling markers compared to matched controls. In this study it seemed as if the bone turnover, which was evaluated by serum bone remodelling markers, adapted to the current activity needed to maintain bone strength. Duration of exercise above that level seemed to confer no additional benefits.
Weight bearing and physical activity are important stimuli to bone growth and metabolism. Kim et al. (2000) indicated that bed rest immobilisation may influence the circadian rhythm due to no mechanical loading with the loss of daily activity. The study, however, showed that immobilisation on day 14 does not disrupt the basic diurnal rhythm of bone resorption.
Some studies confirm that exercise increases markers of collagen formation. The effect of whole body vibration training on hip density muscle strength and postural control was studied in postmenopausal women by Verschueren et al. (2004). The vibration training increased BMD significantly in the hip. This suggests that this may be useful for the prevention of osteoporosis.