Article
1
Pathway-Focused Gene Interaction Analysis Reveals
2
the Regulation of TGFβ, Pentose Phosphate and
3
Antioxidant Defense System by Placental Growth
4
Factor in Retinal Endothelial Cell Functions:
5
Implication in Diabetic Retinopathy
6
Hu Huang 1,*, Madhu Sudhana Saddala 1, Anton Lennikov 1, Anthony Mukwaya 2 and Lijuan
7
Fan1
8
1 Mason Eye Institute, University of Missouri, Columbia, Missouri, United States of America
9
2 Department of Ophthalmology, Institute for Clinical and Experimental Medicine, Faculty of Health
10
Sciences, Linköping University, Linköping, Sweden
11
* Correspondence: [email protected]; Tel.: +1-573-882-9899 (H.H.)
12
Abstract:
13
Placental growth factor (PlGF or PGF) is a member of the VEGF family, which is known to play a
14
critical role in pathological angiogenesis, inflammation, and endothelial cell barrier function.
15
However, the molecular mechanisms by which PlGF mediates its effects in non-proliferative
16
diabetic retinopathy (DR) remain elusive. In this study, we performed transcriptome-wide profiling
17
of differential gene expression for human retinal endothelial cells (HRECs) treated with PlGF
18
antibody. The effect of antibody treatment on the samples was validated using trans-endothelial
19
electric resistance (TEER), and western blot. A total of 3760 genes (1750 upregulated and 2010
20
downregulated) were found to be differentially expressed between the control and PlGF antibody
21
treatment group. These differentially expressed genes (DEGs) were used for gene ontology and
22
enrichment analysis to identify gene function, signal pathway, and interaction networks. The gene
23
ontology results revealed that catalytic activity (GO:0003824) of molecular function, cell
24
(GO:0005623) of the cellular component, and cellular process (GO:0009987) were among the most
25
enriched biological processes. Pathways such as TGF-β, VEGF-VEGFR2, p53, apoptosis, pentose
26
phosphate pathway, and ubiquitin-proteasome pathway, were among the most enriched, and
TGF-27
β1 was identified as a primary upstream regulator. These data provide new insights into the
28
underlying molecular mechanisms of PlGF in mediating biological functions, in relation to DR.
29
Keywords: PlGF; PGF; blood-retinal barrier; RNA Seq; HREC; gene ontology; fastQC;
30
Trimmomatic; KEGG; pentose phosphate pathway; TGF-β
31
32
1. Introduction
33
Diabetic Retinopathy (DR) is the most common complication of diabetes and the leading cause
34
of visual impairment in the working-age adult population worldwide [1]. Increased glucose levels
35
can lead to microvascular damage in the retina. However, the mechanism by which hyperglycemia
36
initiates retinal blood vessel damage in retinopathy remains elusive. It is well documented that
37
oxidative stress and inflammation play a vital role in this process, ultimately resulting in the
38
breakdown of the blood-retinal barrier (BRB) [2]. An impaired BRB can further progress into
39
augmented vascular retinal permeability and irregular growth of new blood vessels, instigating
40
moderate to severe vision loss. When DR progresses into further advanced stages, vitreous
41
hemorrhages can occur and result in retinal detachment and fibrovascular contraction, further
42
advancing vision loss, and eventually leading to blindness [3].
43
The identification of vascular endothelial growth factor (VEGF) as a major stimulus for
44
proliferative diabetic retinopathy (PDR) led to the development of anti-VEGF therapies, which have
45
improved the clinical management of this condition. However, repeated anti-VEGF therapy in severe
46
PDR patients can lead to the formation of fibrovascular membranes (FVM) and tractional retinal
47
detachment, which can cause severe vitreoretinal traction and hemorrhage [4]. A study in the
48
literature has also suggested that long-term intravitreal (ITV) anti-VEGF injection may have
49
deleterious effects on the neuronal cells, based on the survival and maintenance function of VEGF
50
[5]. Thus, there is a clear need for alternative therapies for DR, especially for the non- or
poor-51
responders to the current standard of care, with the potential to reduce the risk of treatment-related
52
sequelaes. Indeed, other crucial angiogenic growth factors are likely involved in this condition [6],
53
which could serve as additional or even alternative targets for therapy. Cumulative evidence
54
supports the pathogenic role of placental growth factor (PlGF), which is a member of the VEGF family
55
and was first described from a human placental cDNA library in 1991 [7,8]. PlGF is expressed by a
56
wide variety of cell types, including endothelial cells (ECs) and retinal pigment epithelial cells (RPEs)
57
in response to hypoxia [9]. PlGF is a homolog of VEGF and binds to fms-like tyrosine kinase-1
58
(VEGFR-1; also known as FLT1) and soluble VEGFR-1, a circulating form of VEGFR-1 that lacks the
59
transmembrane and intracellular domains. Activation of FLT1 by PlGF augments the effects of
VEGF-60
VEGFR2 signaling, suggesting synergistic effects of PlGF and VEGF. PlGF can also form heterodimers
61
with VEGF [10] and exerts a strong effect on blood vessel growth and maturation. Further, PIGF has
62
direct proangiogenic effects on ECs [11]. Previously, we reported that deleting PlGF decreased
63
expression of diabetes-activated hypoxia-inducible factor (HIF)1α in the mouse retina. We also
64
described changes in the VEGF pathway including expression of HIF1α, VEGF, VEGFR1–3, and
65
levels of phospho (p)-VEGFR1, p-VEGFR2, and p–endothelial nitric oxide synthase in the retinas of
66
diabetic PlGF−/− mice [12].
67
Despite the advances made, the biological function of PIGF and associated mechanisms are less
68
well understood than those of its homolog VEGF. In order to address this gap, we sought to perform
69
a comparative transcriptomic analysis between the PlGF antibody (ab) treatment and the
Phosphate-70
Buffered Saline (PBS) control in the primary human retinal endothelial cell (HREC). We identified
71
transcriptome and pathways that are regulated by PlGF. In one recent study (manuscript under
72
review), we report some preliminary results, including several signaling pathways that are pertinent
73
to EC barrier functions: VEGF receptor signal, pentose phosphate pathway, and anti-oxidation
74
systems. In the present study, we provide a thorough report about the differentially expressed genes
75
(DEGs) in HREC with the presence and absence of PlGF signaling and highlight several signaling
76
pathways regulated by PlGF. Notably, the expression levels of many genes involved in the TGF-β
77
signaling pathway, which acts as a primary regulator of many other identified genes and pathways,
78
are altered in the PlGF ab treatment relative to the PBS control.
79
2. Materials and Methods
80
Primary human retinal endothelial cell (HREC) culture
81
Primary human retinal endothelial cells (HRECs) were bought from Cell Systems (Cat#: ACBR1
82
181, Kirkland, WA). HRECs were seeded on fibronectin-coated (10 µ g/ml, overnight, 33016015,
83
Gibco) plastic culture vessels and grown using the EBM2-MV medium (Cat#: cc-4176, Lonza,
84
Walkersville, MD) supplemented with 10% fetal bovine serum (FBS), 1% of penicillin/streptomycin
85
(P/S), and EGM MV Singlequots growth supplement kit (Cat#: cc-4147, Lonza). Cells were used
86
during passage 5 to 6.
87
88
Cell treatments
89
At 80% confluence, the culture media was replaced with fresh media containing mouse
anti-90
PlGF antibody (5D11D4), (25 µ g/ml) and HRECs were collected 48 hours after the start of the
91
incubation. PBS treated cells were used as a negative control.
92
93
Trans-endothelial electrical resistance (TEER) measurement by Electric Cell-Substrate
95
Impedance Sensing (ECIS) system
96
Primary HRECs were seeded onto an 8-well ECIS array, cultured, and treated with anti-PlGF
97
antibody or recombinant human (rh) PlGF as described above. For the antibody effects validation, rh
98
PlGF protein (Cat#: 264-PGB-010/CF, R&D Systems, Minneapolis, MN), (0.5 µ l; 100 ng/ml) was used
99
as a positive control. TEER was monitored with the ECIS system (Applied Biophysics, Troy, NY) in
100
real time. The changes in TEER were automatic monitored every 600s at 4 kHz AC frequency and
101
recorded on the ECIS software. The embedded mathematical model of impedance change was used
102
to calculate the TEER (Ω/cm2), a measure of cell-to-cell barrier and cell-to-substratum function [13].
103
104
Western blots (WB) analysis
105
WB was performed as previously described [14,15]. HRECs were grown in the 6-well plates with
106
the conditions and treatments as described above. Next, the experimental endpoint cells were
107
washed with cold D-PBS three times, detached with a cell scraper, and collected by centrifugation.
108
The harvested cell pellets were sonicated in cold RIPA buffer containing FAST protease inhibitor
109
(Cat#: S8830, Sigma, St Louis, MO). Protein concentration was determined using the DCTM Protein
110
Assay kit (Bio-Rad, Hercules, and CA) and/or Qubit 4 Fluorometer. Then, 30-50 μg of total protein
111
per lane was separated by SDS-PAGE (4-20% polyacrylamide gel) prior to electrophoretic transfer to
112
0.45 μm pore size nitrocellulose membranes. The membranes were blocked with 5% non-fat milk
113
(Bio-Rad) at room temperature for 1 hr and then incubated overnight at 4 ºC with the following
114
primary antibodies: anti-VE-Cadherin (1:1,000, Cat#: 5012896, Thermo Fisher Scientific), anti-G6PD
115
(1:500, Cat#: MA5-15918, Thermo Fisher Scientific, Halethorpe, MD), and anti-β-actin (1:1000, Cat#:
116
PA5-16914, Cell Signaling, Danvers, MA). After washing with PBS-T buffer, the blots were incubated
117
with horseradish peroxidase (HRP)-conjugated 1:1000 secondary antibody in 5% milk (Goat
anti-118
Rabbit IgG, Cat#: 170-6515; Goat anti-Mouse IgG Cat#: 172-1011; Goat anti-Rat IgG 5204-2504
Bio-119
Rad) for 1 h at room temperature (RT). Signals were developed with enhanced chemiluminescence
120
(ECL) using a Super Signal West Pico kit (Thermo Fisher) and detected using ImageQuant LAS500
121
(GE Healthcare Life Science, Pittsburgh, PA, USA).
122
123
RNA extraction
124
Forty-eight hours after treatment, the cells were washed with PBS, and total RNA was extracted
125
using the Qiagen mini RNA preparation kit (Qiagen) according to the manufacturer’s protocol. RNA
126
concentration was determined using a NanoDrop spectrophotometer (Thermo Scientific). RNA
127
quality was determined using the Agilent bioanalyzer 2100 (Agilent Technologies). The analysis
128
showed clear, defined 28s and 18s rRNA peaks, an indication of high-quality RNA. Volume,
129
concentration, and RIN values of the RNA samples are presented in Table 1. RIN value ≥ 8 was set as
130
the cut-off for sample inclusion for downstream processing for RNA sequencing analysis.
131
132
RNA sequencing
133
RNA samples were submitted to Novogene Leading Edge Genomic Services & Solutions,
134
California, USA, for sample preparation and sequencing. The samples were first DNase-treated and
135
assessed for total RNA quality using the Agilent 2100 Bioanalyzer, followed by 2 rounds of
136
polyadenylate positive (poly A+) selection and conversion to cDNA. RNA sequencing was performed
137
on the Illumina HiSeq 2500 using the latest versions of sequencing reagents and flow cells, providing
138
up to 300 GB of sequence information per flow cell. TruSeq library generation kits were used
139
according to the manufacturer’s instructions (Illumina). Library construction consisted of random
140
fragmentation of the poly A+ mRNA, followed by cDNA production using random primers. The ends
141
of the cDNA were repaired, A-tailed, and adaptors ligated for indexing (up to 12 different barcodes
142
per lane) during the sequencing run. The cDNA libraries were quantitated using qPCR in a Roche
143
LightCycler 480 with the Kapa Biosystems kit for library quantitation (Kapa Biosystems) prior to
144
cluster generation. Clusters were generated to yield approximately 725K–825K clusters/mm2. Cluster
145
density and quality were determined during the run after the first base addition parameters were
assessed. Paired-end 2 × 50 bp sequencing runs were performed to align the cDNA sequences to the
147
reference genome mouse mm10. Approximately 15 million paired 50 bp reads were obtained per
148
sample. The raw fastq reads were trimmed for adapters and pre-processed to remove low-quality
149
reads using Trimmomatic v. 0.36 with default parameter setting for Illumina paired-end reads, to
150
retain more than 97% of good quality reads in each stage. After adapter removal, the quality of each
151
paired-end sequence file was evaluated using FastQC analysis
152
http://www.bioinformatics.babraham.ac.uk/projects/fastqc/ based on the following parameters: 1)
153
Distribution of quality score (Phred score) per base, 2) Distribution of quality scores of the raw
154
sequences, 3) Distribution of duplicated reads, and 4) GC content (%) distribution of the raw
155
sequences. For each sample, trimmed short reads were mapped to the human genome (TopHat and
156
Cufflinks), resulting in 10–95 million mapped reads per sample. We performed quality-control or
157
global analysis (quality of the model fitting) of the cufflinks data by using the CummeRbund R
158
package (http://compbio.mit.edu/cummeRbund/).
159
160
RNA-Seq bioinformatics analysis
161
The raw data were evaluated for reads quality before and after pre-processing using FastQC
162
software: (https://www.bioinformatics.babraham.ac.uk/projects/fastqc/). The reads were processed
163
to remove adapters and ambiguous quality reads using the Trimmomatic-0.36 tool [16] with
164
trimming of bases from 3′ and 5′ end, maintaining the Phred-score ≤ 30. The human genome was
165
downloaded from the National Centre for Biotechnology Information (NCBI) genome
166
(https://www.ncbi.nlm.nih.gov/genome/?term=human) for reference-based assembly. We mapped
167
all the datasets onto the human genome reference sequence GRCh38 using TopHat2.0.9
168
(http://ccb.jhu.edu/software/tophat/index.shtml). The expression levels were transformed into
169
fragments per kilobase of exon per million mapped fragments (FPKM). We identified DEGs that
170
satisfy the significance expressed as 𝑞-value representing FDR-adjusted 𝑃 value < 0.05 by using
171
Cufflinks 2.1.1 (http://cufflinks.cbcb.umd.edu). The Bioconductor tool with CummeRbund package
172
was employed to analyze differential expression analysis in the assembled transcriptome
173
(http://compbio.mit.edu/cummeRbund/manual_2_0.html). Finally, both control and PlGF ab treated
174
comparison transcript counts (matrix file) were used for differential gene expression using the
175
CummeRbund package of Bioconductor with primary parameters such as FDR (false discovery rate),
176
logFC (log fold-change), logCPM (log counts per million), and p-value. Unigenes with adjusted
q-177
values of less than 0.05 (p<0.05) and the fold change of more than 2 (logFC>2) were considered as
178
significantly differentially expressed genes.
179
180
Functional annotation
181
Gene ontology (GO) Enrichment Analysis
(http://geneontology.org/page/go-enrichment-182
analysis) and DAVID annotation (https://david.ncifcrf.gov/) were used for functional annotation and
183
pathways analysis. An adjusted EASE (Expression Analysis Systemic Explore Score) score of 0.05 and
184
threshold count of >2 genes were employed. Benjamin–Hochberg multiple testing correction was
185
applied to the p-values. GO terms with FDR q<0.05 were considered significantly enriched within the
186
gene set [17] [18].
187
188
Gene-gene network analysis
189
We performed protein-protein network analysis for all DEGs using the STRING 10.5 database
190
(https://string-db.org/). This is calculated in a variety of classification systems (Gene Ontology,
191
KEGG, Pfam and InterPro), and used the Fisher's exact test followed by a correction for multiple
192
testing [18,19].193
194
Statistical analysis195
All numeric values were expressed as the mean ± standard deviation (SD) for the respective
196
groups. Statistical analyses were performed using the Trinity software
197
(https://github.com/trinityrnaseq/trinityrnaseq/wiki). Student t-tests and Benjamin–Hochberg
corrections (FDR) were also used in the analyses. A p-value of less than 0.05 was considered
199
significant.
200
3. Results
201
202
Figure 1. Trans-endothelial electric resistance (TEER) values of HRECs treated with PBS
203
(Control), rhPlGF 100 ng/ml, and anti-PlGF antibody 25 µ g/ml for the course of 48 hours
204
(A). Western blot analysis of VE-cadherin and G6PD in protein samples acquitted from
205
HREC cultures after 48 hours incubation with the same treatments at the end of the 48 hour
206
period.
207
3.1. Effects of PlGF antibody and recombinant PlGF on HREC resistance, G6PD, and VE-Cadherin
208
By using PlGF antibody and recombinant PlGF, we recently demonstrated that PlGF acts as a
209
negative regulator of EC barrier function through suppression of glucose-6-phosphate
210
dehydrogenase (G6PD) and barrier-forming proteins, such as VE-cadherin (manuscript under
211
review). In agreement with the previous observations, in our new experimental settings, we found
212
that the PlGF antibody boosted, but recombinant PlGF reduced HREC resistance, which was
213
evaluated using TEER measurement by the ECIS system: effective separation in cell monolayer
214
resistance values over time was observed between the control, anti-PlGF antibody, and rhPlGF
215
protein (Figure 1A). With the increased resistance of αPlGF antibody-treated cells and decreased
216
resistance of rhPlGF treated cells, the effects were monitored at up to 48 hours’ time point where
217
protein and RNA samples were collected. The changes in the protein levels of CDH5 (VE-cadherin)
and G6PD were validated by WB analysis (Figure 1B). The expression levels of VE-cadherin and
219
G6PD were upregulated by αPlGF antibody treatment and downregulated in rhPlGF treated cells.
220
The HREC RNA samples were then used for sequencing and bioinformatics analyses.
221
3.2. RNA sequencing
222
223
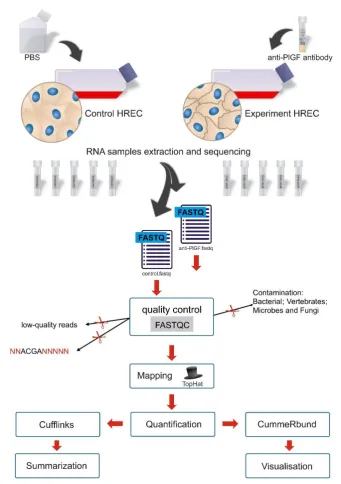
Figure 2. Present study workflow pipeline. The pipeline of RNA-Seq analysis uses TopHat to align
224
RNA-seq reads, Cufflinks to assemble and estimate the relative transcript abundance and cuffmerge
225
for Cufflinks assemblies, and CummeRbund for visualization and the statistical analysis.
226
228
Figure 3. The quality of a higher number of differentially expressed genes representation. A. Model
229
fitting dispersion plot. B. Density plot C. Box plot.
230
231
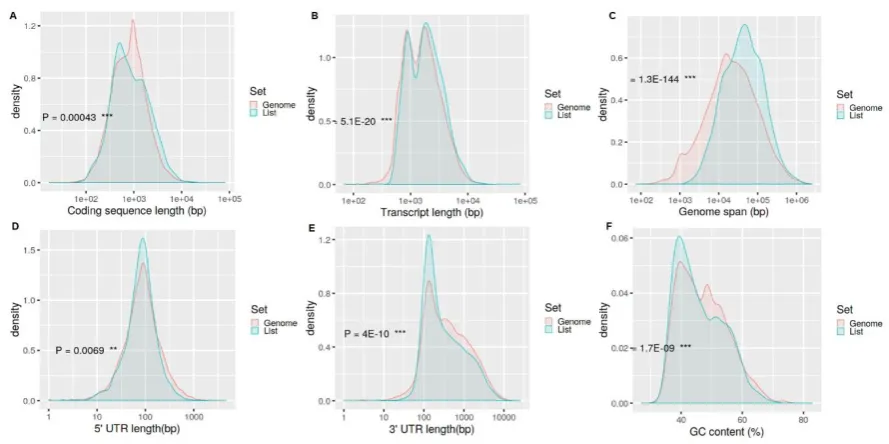
Figure 4. Raw sequencing component analysis on the reference genome. A. Coding sequence
232
length(bp) B. Transcript length(bp) C. Genome span(bp), D. 5’ UTR length(bp) E. 3’ UTR length(bp)
233
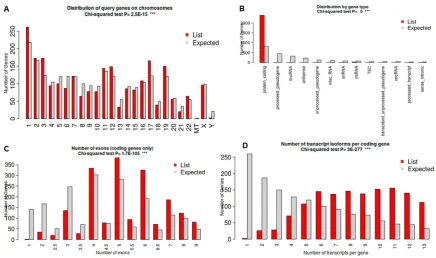
235
Figure 5. Distribution of DEGs sequencing component analysis A. Distribution of DEGs chromosomes
236
B. Distribution of gene type C. Number of exons (coding genes) D. Number of transcript isoforms per
237
239
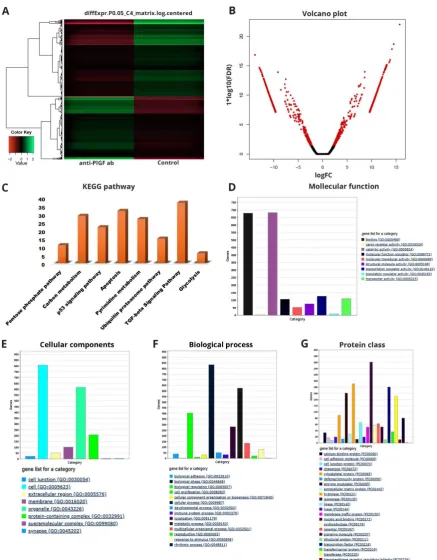
Figure 6. Gene expression profile in PlGF ab treated group relative to the control. A. The differentially
240
expressed genes are plotted in the form of a heat map, where red color represents down-regulated,
241
while green color represents up-regulated (logFC±2; p-values=0.05). The dendrogram provides a
242
hierarchical clustering. B. Volcano plot represented by significantly up and down-regulated gene
243
based on the logFC and log10(FDR). C. KEGG (Kyoto Encyclopedia of Genes and Genomes)
244
pathways. The differentially expressed genes involved in pentose phosphate pathway, carbon
245
metabolism pathway, p53 signaling pathway, apoptosis pathway, pyrimidine metabolism pathway,
246
ubiquitin-proteasome pathway, TGFβ signaling pathway and glycolysis pathway D. Molecular
247
The RNA-Seq approach was designed to provide an in-depth investigation of the transcriptome-wide
249
differential gene expression profiles and therapeutic target pathway genes predictions. The workflow
250
of the current study is represented in Figure 2. The cuffdiff results file was statistically analyzed and
251
visualized using the cummeRbund package. The quality of the model fitting dispersion plot (Figure
252
3A) showed the highest number of differentially expressed genes (DEGs). In addition, we calculated
253
the distributions of FPKM (Fragments Per Kilobase of transcript per Million) scores across samples
254
using the Density plot and Box plot, respectively (Figure 3B and C). The coding sequence length (bp),
255
transcript length (bp), genome span (bp), 5’ UTR length(bp), 3’ UTR length(bp), and percentage of
256
the GC content of DEGs were predicted (Figure 4). In addition, the distribution of DEGs was
257
predicted based on the human chromosomes, distribution of gene type, number of exons (coding
258
genes), and number of transcript isoforms per coding gene (Figure 5). We identified 53808 significant
259
transcripts in total from the datasets. Among them, a total of 3275 differentially expressed genes (1750
260
up-regulated and 2010 down-regulated genes) that satisfy 𝑞-value (FDR-corrected p-value) < 0.05 and
261
fold change ≥ ±2.0, were identified in the PlGF ab treated group relative to the control. A hierarchical
262
clustering heatmap and volcano plots were generated to represent the up- and downregulated genes
263
(Figure 6A and B). These DEGs were used for further gene ontology and functional pathway analysis.
264
3.2.1 Functional annotation
265
DEGs were used for GO enrichment analysis using the DAVID annotation tool [20] with the complete
266
human genome as the background. The following GO terms were enriched: molecular function (MF),
267
biological process (BP), cellular component (CC), and protein classes (PC). Most of the DEGs were
268
found to be involved in several molecular functions, such as binding (GO:0005488), catalytic activity
269
(GO:0003824), molecular function regulator (GO:0098772), structural molecule activity (GO:0005198),
270
transcription regulator activity (GO:0140110), and transporter activity (GO:0005215). Among these
271
molecular functions, DEGs were most involved in binding (GO:0005488), catalytic activity
272
(GO:0003824), and translation regulator activity (GO:0045182), respectively (Figure 6D). The DEGs
273
were also involved in various cellular components i.e., cell junction (GO:0030054), cell (GO:0005623),
274
membrane (GO:0016020), protein-containing complex (GO:0032991), and synapse (GO:0045202).
275
Among these cellular components, the DEGs were most involved in the cell (GO:0005623), organelle
276
(GO:0043226), and protein-containing complex (GO:0032991), respectively (Figure 6E). The DEGs
277
were also involved in various biological processes i.e., biological adhesion (GO:0022610), biological
278
regulation (GO:0065007), cellular component organization or biogenesis (GO:0071840), cellular
279
process (GO:0009987), immune system process (GO:0002376), and metabolic process (GO:0008152)
280
but the DEGs were most involved in biological regulation (GO:0065007), cellular processes
281
(GO:0009987), and metabolic process (GO:0008152), respectively (Figure 6F). The DEGs were also
282
classified into to several protein classes such as calcium-binding protein (PC00060), cell adhesion
283
molecule (PC00069), cell junction protein (PC00070), chaperone (PC00072), defense/immunity protein
284
(PC00090), extracellular matrix protein (PC00102), nucleic acid binding (PC00171), signaling
285
molecule (PC00207), transfer/carrier protein (PC00219), transmembrane receptor regulatory/adaptor
286
protein (PC00226), and transporter (PC00227), respectively. Most of the DEGs are classified as nucleic
287
acid binding (PC00171), hydrolase (PC00121), transcription factor (PC00218), and enzyme modulator
288
(PC00095) (Figure 6G).
289
The gene ontology results revealed that the 36.9% of the genes were involved in binding
290
(GO:0005488), 37.1% of genes were involved in catalytic activity (GO:0003824), and 6.9% of genes
291
were involved in transcription regulator activity (GO:0140110) of molecular functions. A total of
292
44.5% of genes participated in the cell (GO:0005623), 34.0% of genes participated in the organelle
293
(GO:0043226), and 11.4% of genes participated in the protein-containing complex (GO:0032991) of
294
cellular components. A total of 32.8% of the genes were involved in cellular processes (GO:0009987),
295
24.6% of genes were involved in the metabolic process (GO:0008152), 15.9% of genes were involved
296
in biological regulation (GO:0065007), and 11.0% of genes were involved in localization (GO:0051179)
297
of biological processes. Finally, 16.2% of genes belonged to nucleic acid binding (PC00171), 11.9% of
genes belonged to hydrolase (PC00121), 11.2% of genes belonged to the transcription factor
299
(PC00218), 10.0% of genes belonged to enzyme modulator (PC00095), 9.4% of genes belonged to
300
transferase (PC00220), 5.5% of genes belonged to cytoskeletal protein (PC00085), and 5.0% of genes
301
belonged to transporter (PC00227) of protein classes.
302
Pathway enrichment analysis using the DEGs identified the following enriched pathways: pentose
303
phosphate pathway (11 genes), carbon metabolism (30 genes), p53 signaling pathway (22 genes),
304
apoptosis (32 genes), pyrimidine metabolism (27 genes), ubiquitin-proteasome pathway (15 genes),
305
TGFβ signaling pathway (37 genes), and glycolysis (6 genes) (Figure 6C).
306
Table 1. List of Pentose phosphate pathway genes, and antioxidant genes along with ensembl, gene
307
symbol, gene name logFC, p-values in RNA seq data analysis.
308
Pentose phosphate pathway
Ensembl Gene
Symbol Gene Name logFC p-value
ENST00000566012 ALDOA aldolase, fructose-bisphosphate A -2.70711 0.000159 ENST00000226253 ALDOC aldolase, fructose-bisphosphate C -8.29613 3.54E-06 ENST00000533447 DERA deoxyribose-phosphate aldolase 3.07566 0.000305 ENSG00000160211 G6PD* glucose-6-phosphate dehydrogenase 6.20824 1.08E-12
ENST00000486393 GLYCTK glycerate kinase -7.43140 0.000164 ENST00000588991 GPI glucose-6-phosphate isomerase -7.36468 0.000217 ENST00000397961 PFKL phosphofructokinase, liver type 7.15971 0.000530 ENST00000551339 PFKM phosphofructokinase, muscle -10.6579 2.97E-12 ENST00000594761 PGLS 6-phosphogluconolactonase 7.41946 0.000217 ENST00000372419 PRPS1 phosphoribosyl pyrophosphate synthetase 1 -8.25372 4.28E-06 ENST00000429907 RPE ribulose-5-phosphate-3-epimerase 7.75075 4.53E-05
* G6PD logFC values and p-value was consistent with western blot analysis results.
309
Table 2. List of Pentose phosphate pathway genes and antioxidant genes along with ensembl, gene
310
symbol, gene name logFC, p-values in RNA seq data analysis.
311
Ensembl Gene
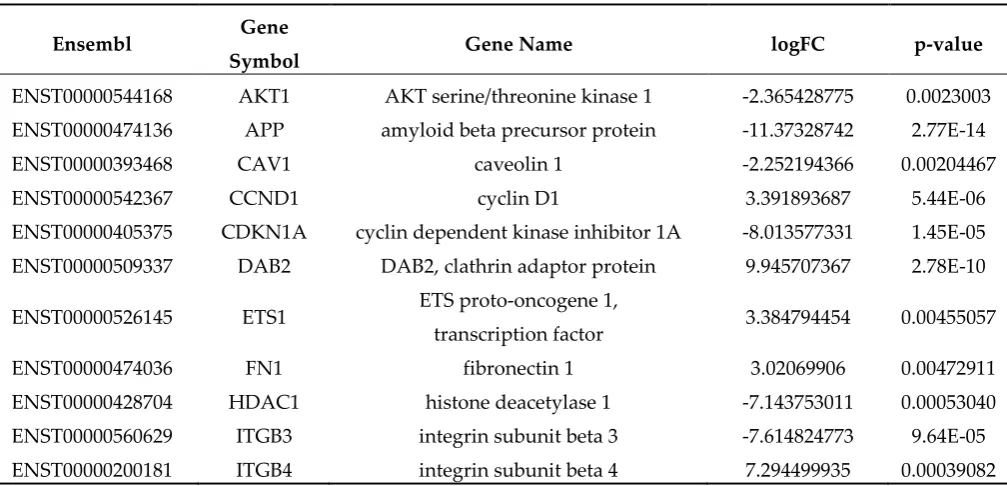
Symbol Gene Name logFC p-value
ENST00000544168 AKT1 AKT serine/threonine kinase 1 -2.365428775 0.0023003 ENST00000474136 APP amyloid beta precursor protein -11.37328742 2.77E-14 ENST00000393468 CAV1 caveolin 1 -2.252194366 0.00204467 ENST00000542367 CCND1 cyclin D1 3.391893687 5.44E-06 ENST00000405375 CDKN1A cyclin dependent kinase inhibitor 1A -8.013577331 1.45E-05 ENST00000509337 DAB2 DAB2, clathrin adaptor protein 9.945707367 2.78E-10
ENST00000526145 ETS1 ETS proto-oncogene 1,
ENST00000535335 KLF11 Kruppel like factor 11 8.042834182 1.17E-05 ENST00000333611 LIMK2 LIM domain kinase 2 8.171648208 6.32E-06 ENST00000393362 MAPK9 mitogen-activated protein kinase 9 -2.849607483 0.00291167 ENST00000504921 MEF2C myocyte enhancer factor 2C -8.39414907 2.05E-06
ENST00000318493 MET MET proto-oncogene, receptor tyrosine
kinase -8.922971532 1.28E-07
ENST00000504387 NEDD9 neural precursor cell expressed,
developmentally down-regulated 9 2.177612821 0.00196987 ENST00000567606 PML promyelocytic leukemia -9.040096253 5.90E-08
ENST00000296446 PRKAR2A protein kinase cAMP-dependent type II
regulatory subunit alpha -8.667581639 4.66E-07 ENST00000521791 PTK2 protein tyrosine kinase 2 -4.161512038 0.00133434
ENST00000423275 RAF1 Raf-1 proto-oncogene, serine/threonine
kinase -9.032436585 6.69E-08
ENST00000635540 ROCK1 Rho associated coiled-coil containing
protein kinase 1 -10.50374244 8.23E-12 ENST00000368453 SHC1 SHC adaptor protein 1 -6.232971845 1.30E-10 ENST00000402690 SMAD2 SMAD family member 2 -2.662985055 0.00074433 ENST00000398417 SMAD4 SMAD family member 4 -7.777534707 4.53E-05 ENST00000555761 SNW1 SNW domain containing 1 -7.431403503 0.00016479
ENST00000426016 SOS1 SOS Ras/Rac guanine nucleotide
exchange factor 1 -8.32564549 2.94E-06 ENST00000389980 SPTBN1 spectrin beta, non-erythrocytic 1 11.65618569 4.17E-15
ENST00000025399 STRAP serine/threonine kinase receptor
associated protein -7.294735531 0.00029061
ENST00000567066 TGFB1I1 transforming growth factor beta 1
induced transcript 1 8.564730191 8.76E-07
ENST00000525962 TGFBR3 transforming growth factor beta
receptor 3 8.212151204 5.19E-06 ENST00000576106 TRAP1 TNF receptor associated protein 1 -3.530510601 0.00019337 ENST00000367450 UCHL5 ubiquitin C-terminal hydrolase L5 -7.556237722 0.00012556
ENST00000265428 WWP1 WW domain containing E3 ubiquitin
protein ligase 1 -9.115939287 4.09E-08 ENST00000615667 YAP1 Yes associated protein 1 8.212151204 5.19E-06 ENST00000542815 ZEB1 zinc finger E-box binding homeobox 1 9.268512943 1.64E-08 ENST00000392861 ZEB2 zinc finger E-box binding homeobox 2 4.55061543 0.00038525
312
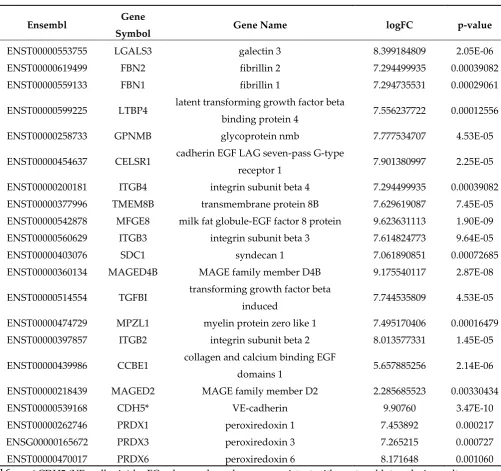
Table 3. List of cell adhesion and antioxidant genes along with ensembl, gene symbol, gene name
314
logFC, p-values in RNA seq data analysis.
315
Ensembl Gene
Symbol Gene Name logFC p-value
ENST00000553755 LGALS3 galectin 3 8.399184809 2.05E-06 ENST00000619499 FBN2 fibrillin 2 7.294499935 0.00039082 ENST00000559133 FBN1 fibrillin 1 7.294735531 0.00029061
ENST00000599225 LTBP4 latent transforming growth factor beta
binding protein 4 7.556237722 0.00012556 ENST00000258733 GPNMB glycoprotein nmb 7.777534707 4.53E-05
ENST00000454637 CELSR1 cadherin EGF LAG seven-pass G-type
receptor 1 7.901380997 2.25E-05 ENST00000200181 ITGB4 integrin subunit beta 4 7.294499935 0.00039082 ENST00000377996 TMEM8B transmembrane protein 8B 7.629619087 7.45E-05 ENST00000542878 MFGE8 milk fat globule-EGF factor 8 protein 9.623631113 1.90E-09 ENST00000560629 ITGB3 integrin subunit beta 3 7.614824773 9.64E-05 ENST00000403076 SDC1 syndecan 1 7.061890851 0.00072685 ENST00000360134 MAGED4B MAGE family member D4B 9.175540117 2.87E-08
ENST00000514554 TGFBI transforming growth factor beta
induced 7.744535809 4.53E-05 ENST00000474729 MPZL1 myelin protein zero like 1 7.495170406 0.00016479 ENST00000397857 ITGB2 integrin subunit beta 2 8.013577331 1.45E-05
ENST00000439986 CCBE1 collagen and calcium binding EGF
domains 1 5.657885256 2.14E-06 ENST00000218439 MAGED2 MAGE family member D2 2.285685523 0.00330434 ENST00000539168 CDH5* VE-cadherin 9.90760 3.47E-10 ENST00000262746 PRDX1 peroxiredoxin 1 7.453892 0.000217 ENSG00000165672 PRDX3 peroxiredoxin 3 7.265215 0.000727 ENST00000470017 PRDX6 peroxiredoxin 6 8.171648 0.001060
* CDH5 (VE-cadherin) logFC values and p-value was consistent with western blot analysis results.
316
The functional enrichment results revealed genes mainly involved in the pentose phosphate pathway
317
(Table 1), TGFβ signaling pathway (Table 2), as well as cell adhesion and antioxidant genes that we
318
have identified and tabulated (Table 3); these are all up-regulated in PlGF ab treated conditions
319
compared with the control. These results suggested that most of the genes involved in the TGFβ
320
signaling pathway might have a beneficial role in treatment of diabetic retinopathy.
321
3.2.2 Pathway-focused gene interaction network analysis
322
We performed the gene-gene network analysis of genes within each pathway using the STRING tool
323
(https://string-db.org/). Given our previous observation of the effect of high glucose on the expression
324
of PIGF, here we focused our analysis on the genes identified to be involved in the pentose phosphate
325
pathway. All the of 11 genes that were identified above were used for the gene-interaction analysis,
326
with the human genome as the background. Interestingly from the analysis, G6PD, which is a gene
327
that we previously found to be modulated under high glucose, was shown to interact with genes
such as PFKM, ALDOA, RPE, PGLS, and ALDOC (Suppl. Figure 1A). The carbon metabolism
329
pathway has 30 nodes, 195 edges, a 13 average node degree, 0.749 avg. local clustering coefficient,
330
and 9 expected number of edges with a PPI enrichment p-value < 1.0e-16 (Suppl. Figure 1B). The p53
331
signaling pathway has 22 nodes, 111 edges, a 10.1 average node degree, 0.75 avg. local clustering
332
coefficient and 15 expected number of edges with a PPI enrichment p-value < 1.0e-16 (Suppl.
333
Figure1C). The apoptosis pathway has 31 nodes, 207 edges, a 13.4 average node degree, 0.728 avg.
334
local clustering coefficient, and 30 expected number of edges with a PPI enrichment p-value <
1.0e-335
16 (Suppl. Figure1D). The Pyrimidine metabolism pathway has 27 nodes, 159 edges, 11.8 average
336
node degree, 0.715 avg. local clustering coefficient, and 12 expected number of edges with a PPI
337
enrichment p-value < 1.0e-16 (Suppl. Figure2A). The ubiquitin-mediated proteolysis pathway has 15
338
nodes, 56 edges, a 7.47 average node degree, 0.717 avg. local clustering coefficient, and 8 expected
339
number of edges with a PPI enrichment p-value < 1.0e-16 (Suppl. Figure2B). The TGFβ signaling
340
pathway has 37 nodes, 162 edges, an 8.76 average node degree, 0.606 avg. local clustering coefficient,
341
and 47 expected number of edges with a PPI enrichment p-value < 1.0e-16 (Suppl. Figure2C). The
342
glycolysis pathway has 6 nodes, 15 edges, a 5.0 average node degree, 1 avg. local clustering
343
coefficient, and 1 expected number of edges with a PPI enrichment p-value < 1.0e-16 (Suppl.
344
Figure2D). The results revealed that all pathway genes interact with each other directly or indirectly,
345
except the EIF2S1 gene in the apoptosis pathway.
346
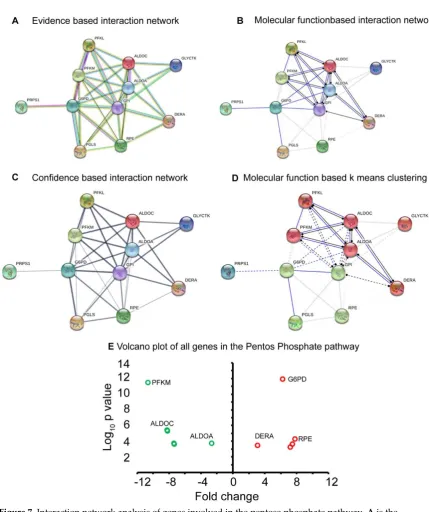
348
Figure 7. Interaction network analysis of genes involved in the pentose phosphate pathway. A is the
349
evidence-based interaction network analysis, B is the molecular function-based interaction network
350
analysis, C is the confidence-based interaction network analysis, and D is a k means cluster analysis
351
of the genes. The grey arrow in A-D points to G6PD protein. E is a volcano plot of fold change and
p-352
value of all pentose phosphate pathway genes.
353
Given our previous observation about the effect of PIGF on glucose-6-phosphate dehydrogenase
354
(G6PD) and the antioxidant system (manuscript under review), here we focused our analysis on the
355
genes identified in the pentose phosphate pathway. All of the 11 genes that were identified above
356
(under pathway enrichment analysis) were used for the gene-interaction analysis, with the human
357
genome as the background using STRING (https://string-db.org/). Evidenced-based analysis of the
358
genes showed that all the genes were inter-connected, and ALDOC was the query protein and first
359
shell of interactors. Interestingly, G6PD, a gene that we previously found to be modulated under high
360
glucose and by PlGF, was shown to interact with many genes such as PFKM, ALDOA, RPE, PGLS,
361
and ALDOC (Figure 7A). An interaction analysis based on molecular action was also performed to
362
gain insights into how these genes affect each other, and the results reveal that G6PD binds directly
with PRPS1, PGLS, GPI, ALDOA, and ALDOC (Figure 7B). Based on confidence analysis, G6PD
364
showed the highest interaction with GPI, RPE, PGLS, ALDOA, ALDOC, and high interaction with
365
PRPS (Figure 7C). Reactome pathway analysis revealed that glycolysis and TP53 regulates metabolic
366
genes and are among the enriched pathways, with FDR of 1.30e-09 and 0.0023, respectively (Supp
367
Table 1.). In addition, G6PD was involved in three of the 6 enriched Reactome pathways. Clustering
368
of the 11 genes involved in the pentose phosphate pathway revealed two distinctive clusters. In one
369
cluster genes, G6PD, PGLS, RPE, and GP1 were grouped, while PFKL, PFKM, ALDOC, ALDOA,
370
DERA, and GLYCTK clustered together. PRPS1 was the only gene that did not cluster with any of
371
the above (Figure 7D).
372
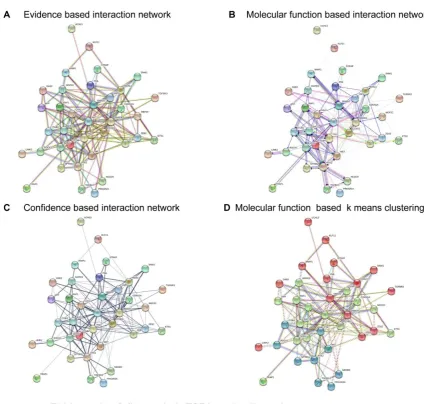
3.2.4 Gene-interaction network analysis of genes within the TGF-β signaling pathway
373
TGF-β signaling has been implicated in the pathophysiology of DR, for instance during the thickening
374
of the capillary basal lamina, mediated via pericytes. Here, we performed an in-depth analysis of the
375
genes identified from the pathway analysis involved in TGF-β signaling, in order to understand how
376
these genes interact with each other in modulating cell behavior after antibody-mediated inhibition
377
of PlGF in vitro. The evidence-based analysis identified integrin beta-4; (ITGB4) as the query protein,
378
and the first shell of interactors (Figure 8A), a protein thought to play a role in the hemidesmosome
379
of epithelial cells. Analysis based on molecular function revealed that ITGB4 binds directly to PTK2,
380
MET, ITGB3, CAV1, and SHC1, which in turn inhibit ZEB1 (Figure 8B), and a confidence-based
381
interaction analysis revealed that ITGB4 binds strongly with the above proteins (Figure 8C). Cluster
382
analysis of all the genes involved in the TGF-β pathway revealed three distinctive clusters of genes;
383
Cluster 1 (green), cluster 2 (red), and cluster 3 (Dark cyan) (Figure 8D).
384
386
Figure 8. Interaction network analysis of genes involved in the TGF-beta signaling pathway. A is the
387
evidence-based interaction network analysis, B is the molecular function-based interaction network
388
analysis, C is the confidence-based interaction network analysis, and D is a k means cluster analysis
389
of the genes. E is a volcano plot of fold change and p-value of all TGFβ signaling pathway genes.
390
391
The current study has elucidated the transcriptome-wide gene profile of HREC with the
393
presence and the absence of PlGF signaling. The DEGs identified in the PIGF treated group relative
394
to the control were further characterized and annotated for gene ontology and functional enrichment
395
analysis. The downstream genes and pathways regulated by PlGF are potentially involved in the
396
biological functions of PlGF, such as angiogenesis and EC barrier function.
397
One interesting class of genes are those involved in the TGFβ signaling pathway. The
398
functional enrichment results revealed that the AKT1, APP, CAV1, CCND1, CDKN1A, DAB2, ETS1,
399
FN1, HDAC1, ITGB3, ITGB4, KLF11, LIMK2, MAPK9, MEF2C, MET, NEDD9, PML, PRKAR2A,
400
PTK2, RAF1, ROCK1, SHC1, SMAD2, SMAD4, SNW1, SOS1, SPTBN1, STRAP, TGFB1I1, TGFBR3,
401
TRAP1, UCHL5, WWP1, YAP1, ZEB1, and ZEB2 genes are involved in the TGFβ signaling pathway.
402
TGFβ1 is a signaling protein involved in many processes, including immune system modulation, cell
403
proliferation, cell differentiation, and apoptosis [21]. After activation, TGF-β binds to the type 2 TGF
-404
β receptor, and this interaction leads to recruitment and subsequential phosphorylation of type 1
405
TGF-β receptor. In turn, the intracellular proteins Smad2 and Smad3 are recruited, and after forming
406
a complex with Smad4, TGF-β translocates into the nucleus, where it activates downstream gene
407
transcription [22].
408
With regards to BBB (blood brain barrier) permeability, evidence supports that TGFβ1 can
409
directly affect endothelial cell permeability. Behzadian et al., (2001) [23] reported that retinal
410
endothelial cells treated with TGFβ1 were found to increase MMP9 expression, which increased the
411
permeability of these endothelial cells. Our results also suggest that the MMP14 gene is up-regulated
412
and supported the above observations. Previous reports indicate that TGF-β signaling is complex,
413
with autocrine and paracrine signaling reported for multiple cell types, and widespread detection of
414
both receptor and ligand expression [24]. Moreover, recent studies of neuronal morphogenesis in the
415
brain demonstrated that TGF-β signaling is required for both axon formation and migration [25].
416
Brionne et al., (2003) [26] reported that mice exhibits lacking TGF-β1 show a widespread increase in
417
degeneration of neurons in the brain and prominent microgliosis prior to death. TGF-β1 is a
418
multifunctional growth factor that is a well-established modulator of vascular cells [27]. Previous
419
studies indicated that TGF-β1 is activated upon contact between endothelial and mesenchymal cells
420
and that it mediates a variety of actions associated with vessel maturation including inhibition of EC
421
proliferation and migration, induction of pericyte differentiation, and production of basement
422
membranes [28]. Pericytes and astrocytes may also release TGF-β, which contributes to BBB integrity
423
and function [29]. Recent studies have demonstrated that contact between endothelium cells (ECs)
424
and pericytes or astrocytes leads to TGF-β1 activation (up-regulated), a major determinant of
TGF-425
β1 availability and signaling. [30] Moreover, the loss of retinal pericytes has been speculated to be
426
permissive for the progression of diabetic retinopathy [31]. These explanations suggest that the high
427
number of pericytes in the retina reflects a significant role for constitutive TGF-β1 signaling in the
428
maintenance of retinal microvascular integrity. The above literature reports are well correlated with
429
our findings. Braunger et al., (2013) reported that the TGF-β1 signaling exerts pleiotropic effects on
430
multiple retinal cell types that underlie numerous functions ranging from maintaining retinal
431
neuronal differentiation and survival in the retina [32]. Shen et al., (2011) [33] study demonstrated
432
that TGF-β1 stimulation of both bovine retinal ECs and human BECs increase BBB permeability.
433
Notably, the increased BBB permeability was mediated by tyrosine-phosphorylation of both
claudin-434
5 and VE-cadherin. TGF-β1signaling has been acknowledged as pivotal in the differentiation of
435
vascular smooth muscle cells/pericytes at mid-gestation, as revealed by gene knockout studies on the
436
signal components, including TGF-β1, Tgfbr2, Alk1, Alk5, endoglin, Smad5, and Smad4 [34]. Our
437
findings suggest that the SMAD2 and SMAD4 genes are down-regulated in the TGF-β1signaling
438
pathway. This might have a significant role in dysregulation of the ubiquitin proteasome pathway,
439
angiogenesis pathway, p53 signaling pathway, and apoptosis pathway genes, as well as in
up-440
regulation of the many cell-cell adhesion genes including LGALS3, FBN2, FBN1, LTBP4, GPNMB,
441
CELSR1, ITGB4, TMEM8B, MFGE8, ITGB3, SDC1, MAGED4B, MPZL1, ITGB2, CCBE1, and
442
MAGED2, and increase of the BBB permeability.
The other genes of interest from the pentose phosphate pathway (PPP) and antioxidant defense
444
system, the glycolysis and carbon metabolism genes, play a beneficial role in diabetes-related
445
oxidative damage to retinal cells (diabetic retinopathy). Oxidative stress is caused by an imbalance
446
between the antioxidant defense system and the production of reactive oxygen species (ROS) [35].
447
G6PD gene plays a key role in regulating carbon flow through the pentose phosphate pathway.
448
Specifically, the enzyme affects the production of the reduced form of the extramitochondrial nicotine
449
adenosine dinucleotide phosphate (NADPH) coenzyme by controlling the conversion from
glucose-450
6-phosphate to 6-phosphogluconate in the pentose phosphate pathway. In red blood cells, defense
451
against oxidative damage is heavily dependent on G6PD activity, which is the only source of NADPH
452
[36]. Our results suggest that the G6PD gene is up-regulated in the PlGF ab treated condition. It
453
stimulates the oxidative branch of PPP to supply cytosolic NADPH to counteract oxidative damage
454
as well as up-regulating antioxidant genes such as Peroxiredoxin (Prdx)1, Prdx3, and Prdx6. Prdxs
455
are a family of highly conserved, low molecular weight (20–30 kDa) thiol peroxidases that scavenge
456
hydrogen peroxide, alkyl hydroperoxides, and peroxynitrite in living cells [37]. Prdxs play a pivotal
457
role in the response of cells to oxidative stress. Moreover, increasing evidence suggests that certain
458
Prdxs also act as redox sensors: under conditions of oxidative stress, hyperoxidation of the Prdx
459
molecule can occur via binding of a second peroxide substrate, resulting in the cellular build-up of
460
Prdx oxidation products and the local accumulation of hydrogen peroxide [38]. In the retina, only
461
Müller cells and astrocytes that play a crucial role in the maintenance of blood-retinal barrier function
462
express Prdx6. Further, decreased Prdx6 has been reported in several disease conditions where the
463
blood-retinal barrier is compromised. These include diabetic retinopathy (DR), exudative age-related
464
macular degeneration (AMD) as well as arterial and venous occlusions [37] [39]. Our previous
465
proteomics studies also reported that PlGF deficiency increases antioxidant and neuroprotective
466
proteins in the diabetic mouse retina [18]. Recent studies on tears from patients with glaucoma have
467
also identified Prdx1 as having a possible involvement in inflammation [40]. Furthermore, apart from
468
their role as antioxidants, the peroxiredoxins can affect a diverse range of biological processes that
469
include cellular proliferation, differentiation, and apoptosis by influencing signal transduction
470
pathways that employ hydrogen peroxide as a secondary messenger [41]. All of the above findings
471
suggest that PRDX1, PRDX3, and PRDX6 play a defending role in oxidative stress PlGF ab treated in
472
a high glucose condition.
473
5. Conclusions
474
Our results primarily demonstrated that neutralizing PlGF regulates a variety of gene
475
expressions that are relevant to its pathophysiological functional roles, such as angiogenesis and EC
476
barrier function. Among the most important ones are those genes involved in TGFβ, PPP, and the
477
antioxidant defense system. These newly identified genes may act as target molecules for therapeutic
478
interventions for those patients with DR refractory to the current anti-VEGF therapy.
479
480
Author Contributions: conceptualization, H.H. and M.S.S.; methodology, M.S.S. H.H. and L.F.; software,
481
M.S.S..; validation, A.L.; formal analysis, M.S..; investigation, A.L. A.M and M.S.S; resources, H.H.; data curation,
482
H.H.; writing—original draft preparation, M.S.S., H.H., A.L. and A.M.; writing—review and editing, H.H., A.L.
483
and A.M.; visualization, M.S.S., A.L and A.M.; supervision, H.H.; project administration, H.H.; funding
484
acquisition, H.H.”
485
Funding: This research was funded by National Eye Institute, grant number EY027824, and University of
486
Missouri start-up fund.
487
Acknowledgments: The authors wish to acknowledge the contribution of the Center for Biomedical Informatics
488
(CBMI) University of Missouri (Columbia, MO, USA) for computer application facilities and Mr. Dmitry
489
Rumyancev (Belgorod, Russia) for graphical abstract artwork assets design.
490
Conflicts of Interest:“The authors declare no conflict of interest.”
491
493
Supplementary Figure 1. The primary gene network is divided into sub-networks. A. Pentose
494
phosphate pathway genes sub-network B. Carbon metabolism pathway genes sub-network C. p53
495
497
Supplementary Figure 2. The primary gene network is divided into sub-networks. A. Pyrimidine
498
metabolism pathway genes sub-network B. Ubiquitin-proteasome pathway genes sub-network C.
499
TGF-beta signalling pathway genes subnetwork. D. Glycolysis pathway genes subnetwork.
500
501
References
503
1. Lee, R.; Wong, T.Y.; Sabanayagam, C. Epidemiology of diabetic retinopathy, diabetic macular edema
504
and related vision loss. Eye Vis (Lond) 2015, 2, 17.
505
2. Curtis, T.M.; Gardiner, T.A.; Stitt, A.W. Microvascular lesions of diabetic retinopathy: Clues towards
506
understanding pathogenesis? Eye (Lond) 2009, 23, 1496-1508.
507
3. Friedlander, M. Fibrosis and diseases of the eye. J Clin Invest 2007, 117, 576-586.
508
4. Elman, M.J.; Aiello, L.P.; Beck, R.W.; Bressler, N.M.; Bressler, S.B.; Edwards, A.R.; Ferris, F.L.; Friedman,
509
S.M.; Glassman, A.R.; Miller, K.M., et al. Randomized trial evaluating ranibizumab plus prompt or
510
deferred laser or triamcinolone plus prompt laser for diabetic macular edema. Ophthalmology 2010, 117,
511
1064-U1065.
512
5. Storkebaum, E.; Carmeliet, P. Vegf: A critical player in neurodegeneration. J Clin Invest 2004, 113,
14-513
18.
514
6. Aiello, L.P. Angiogenic pathways in diabetic retinopathy. New Engl J Med 2005, 353, 839-841.
515
7. Maglione, D.; Guerriero, V.; Viglietto, G.; Dellibovi, P.; Persico, M.G. Isolation of a human placenta cdna
516
coding for a protein related to the vascular-permeability factor. Proceedings of the National Academy of
517
Sciences of the United States of America 1991, 88, 9267-9271.
518
8. Saddala, M.S.; Lennikov, A.; Grab, D.J.; Liu, G.S.; Tang, S.B.; Huang, H. Proteomics reveals ablation of
519
pigf increases antioxidant and neuroprotective proteins in the diabetic mouse retina. Scientific reports
520
2018, 8.
521
9. Ohno-Matsui, K.; Uetama, T.; Yoshida, T.; Hayano, M.; Itoh, T.; Morita, I.; Mochizuki, M. Reduced
522
retinal angiogenesis in mmp-2-deficient mice. Investigative ophthalmology & visual science 2003, 44,
5370-523
5375.
524
10. Autiero, M.; Waltenberger, J.; Communi, D.; Kranz, A.; Moons, L.; Lambrechts, D.; Kroll, J.; Plaisance,
525
S.; De Mol, M.; Bono, F., et al. Role of pigf in the intra- and intermolecular cross talk between the vegf
526
receptors flt1 and flk1. Nature medicine 2003, 9, 936-943.
527
11. Carmeliet, P.; Moons, L.; Luttun, A.; Vincenti, V.; Compernolle, V.; De Mol, M.; Wu, Y.; Bon, F.; Devy,
528
L.; Beck, H., et al. Synergism between vascular endothelial growth factor and placental growth factor
529
contributes to angiogenesis and plasma extravasation in pathological conditions. Nature medicine 2001,
530
7, 575-583.
531
12. Huang, H.; He, J.B.; Johnson, D.; Wei, Y.H.; Liu, Y.; Wang, S.; Lutty, G.A.; Duh, E.J.; Semba, R.D.;
532
Carmeliet, P. Deletion of placental growth factor prevents diabetic retinopathy and is associated with
533
akt activation and hif1 alpha-vegf pathway inhibition (vol 64, pg 200, 2015). Diabetes 2015, 64,
1067-534
1067.
535
13. Giaever, I.; Keese, C.R. Micromotion of mammalian cells measured electrically. Proceedings of the
536
National Academy of Sciences of the United States of America 1991, 88, 7896-7900.
537
14. Huang, H.; Shen, J.; Vinores, S.A. Blockade of vegfr1 and 2 suppresses pathological angiogenesis and
538
vascular leakage in the eye. PLoS One 2011, 6, e21411.
539
15. Huang, H.; Van de Veire, S.; Dalal, M.; Parlier, R.; Semba, R.D.; Carmeliet, P.; Vinores, S.A. Reduced
540
retinal neovascularization, vascular permeability, and apoptosis in ischemic retinopathy in the absence
541
of prolyl hydroxylase-1 due to the prevention of hyperoxia-induced vascular obliteration. Investigative
542
ophthalmology & visual science 2011, 52, 7565-7573.
543
16. Bolger, A.M.; Lohse, M.; Usadel, B. Trimmomatic: A flexible trimmer for illumina sequence data.
544
17. Huang, D.W.; Sherman, B.T.; Tan, Q.; Kir, J.; Liu, D.; Bryant, D.; Guo, Y.; Stephens, R.; Baseler, M.W.;
546
Lane, H.C., et al. David bioinformatics resources: Expanded annotation database and novel algorithms
547
to better extract biology from large gene lists. Nucleic Acids Res 2007, 35, W169-175.
548
18. Saddala, M.S.; Lennikov, A.; Grab, D.J.; Liu, G.S.; Tang, S.; Huang, H. Proteomics reveals ablation of
549
plgf increases antioxidant and neuroprotective proteins in the diabetic mouse retina. Scientific reports
550
2018, 8, 16728.
551
19. Rivals, I.; Personnaz, L.; Taing, L.; Potier, M.C. Enrichment or depletion of a go category within a class
552
of genes: Which test? Bioinformatics 2007, 23, 401-407.
553
20. Dennis, G.; Sherman, B.T.; Hosack, D.A.; Yang, J.; Gao, W.; Lane, H.C.; Lempicki, R.A. David: Database
554
for annotation, visualization, and integrated discovery. Genome biology 2003, 4, R60.
555
21. Yoshimura, A.; Wakabayashi, Y.; Mori, T. Cellular and molecular basis for the regulation of
556
inflammation by tgf-beta. Journal of biochemistry 2010, 147, 781-792.
557
22. Derynck, R.; Zhang, Y.E. Smad-dependent and smad-independent pathways in tgf-beta family
558
signalling. Nature 2003, 425, 577-584.
559
23. Behzadian, M.A.; Wang, X.L.; Windsor, L.J.; Ghaly, N.; Caldwell, R.B. Tgf-beta increases retinal
560
endothelial cell permeability by increasing mmp-9: Possible role of glial cells in endothelial barrier
561
function. Investigative ophthalmology & visual science 2001, 42, 853-859.
562
24. Close, J.L.; Gumuscu, B.; Reh, T.A. Retinal neurons regulate proliferation of postnatal progenitors and
563
muller glia in the rat retina via tgf beta signaling. Development 2005, 132, 3015-3026.
564
25. Yi, J.J.; Barnes, A.P.; Hand, R.; Polleux, F.; Ehlers, M.D. Tgf-beta signaling specifies axons during brain
565
development. Cell 2010, 142, 144-157.
566
26. Brionne, T.C.; Tesseur, I.; Masliah, E.; Wyss-Coray, T. Loss of tgf-beta 1 leads to increased neuronal cell
567
death and microgliosis in mouse brain. Neuron 2003, 40, 1133-1145.
568
27. ten Dijke, P.; Arthur, H.M. Extracellular control of tgfbeta signalling in vascular development and
569
disease. Nature reviews. Molecular cell biology 2007, 8, 857-869.
570
28. Neubauer, K.; Kruger, M.; Quondamatteo, F.; Knittel, T.; Saile, B.; Ramadori, G. Transforming growth
571
factor-beta1 stimulates the synthesis of basement membrane proteins laminin, collagen type iv and
572
entactin in rat liver sinusoidal endothelial cells. Journal of hepatology 1999, 31, 692-702.
573
29. Obermeier, B.; Daneman, R.; Ransohoff, R.M. Development, maintenance and disruption of the
blood-574
brain barrier. Nature medicine 2013, 19, 1584-1596.
575
30. Song, L.; Yan, Y.; Marzano, M.; Li, Y. Studying heterotypic cell⁻cell interactions in the human brain
576
using pluripotent stem cell models for neurodegeneration. Cells 2019, 8, 299.
577
31. Hammes, H.P. Pericytes and the pathogenesis of diabetic retinopathy. Horm Metab Res 2005, 37 Suppl 1,
578
39-43.
579
32. Braunger, B.M.; Pielmeier, S.; Demmer, C.; Landstorfer, V.; Kawall, D.; Abramov, N.; Leibinger, M.;
580
Kleiter, I.; Fischer, D.; Jagle, H., et al. Tgf-beta signaling protects retinal neurons from programmed cell
581
death during the development of the mammalian eye. J Neurosci 2013, 33, 14246-14258.
582
33. Shen, W.; Li, S.; Chung, S.H.; Zhu, L.; Stayt, J.; Su, T.; Couraud, P.O.; Romero, I.A.; Weksler, B.; Gillies,
583
M.C. Tyrosine phosphorylation of ve-cadherin and claudin-5 is associated with tgf-beta1-induced
584
permeability of centrally derived vascular endothelium. European journal of cell biology 2011, 90, 323-332.
585
34. Lan, Y.; Liu, B.; Yao, H.; Li, F.; Weng, T.; Yang, G.; Li, W.; Cheng, X.; Mao, N.; Yang, X. Essential role of
586
endothelial smad4 in vascular remodeling and integrity. Molecular and cellular biology 2007, 27,
7683-587
35. Masuda, T.; Shimazawa, M.; Hara, H. Retinal diseases associated with oxidative stress and the effects
589
of a free radical scavenger (edaravone). Oxidative medicine and cellular longevity 2017, 2017, 9208489.
590
36. Pinna, A.; Carru, C.; Solinas, G.; Zinellu, A.; Carta, F. Glucose-6-phosphate dehydrogenase deficiency
591
in retinal vein occlusion. Investigative ophthalmology & visual science 2007, 48, 2747-2752.
592
37. Chidlow, G.; Wood, J.P.; Knoops, B.; Casson, R.J. Expression and distribution of peroxiredoxins in the
593
retina and optic nerve. Brain structure & function 2016, 221, 3903-3925.
594
38. Rhee, S.G.; Woo, H.A. Multiple functions of peroxiredoxins: Peroxidases, sensors and regulators of the
595
intracellular messenger h(2)o(2), and protein chaperones. Antioxid Redox Signal 2011, 15, 781-794.
596
39. Saddala, M.S.; Lennikov, A.; Mukwaya, A.; Fan, L.; Hu, Z.; Huang, H. Transcriptome-wide analysis of
597
differentially expressed chemokine receptors, snps, and ssrs in the age-related macular degeneration.
598
Human genomics 2019, 13, 15.
599
40. Pieragostino, D.; Agnifili, L.; Fasanella, V.; D'Aguanno, S.; Mastropasqua, R.; Di Ilio, C.; Sacchetta, P.;
600
Urbani, A.; Del Boccio, P. Shotgun proteomics reveals specific modulated protein patterns in tears of
601
patients with primary open angle glaucoma naive to therapy. Molecular bioSystems 2013, 9, 1108-1116.
602
41. Immenschuh, S.; Baumgart-Vogt, E. Peroxiredoxins, oxidative stress, and cell proliferation. Antioxid
603
Redox Signal 2005, 7, 768-777.