Random walker Segmentation based Cancer
Detection technique
Ruchi Thakur Prof. Piyush Singh Prof. Gourav Shrivastava Department of Computer Science Department of Computer Science Department of Computer Science
RKDF IST RKDF IST RKDF IST Bhopal, India Bhopal, India Bhopal, India
Abstract—Cancer detection using image processing is an important field for the detection of cancer by extraction the features from the image. Since various cancers detection techniques are implemented such as using biclustering. Here in this paper an efficient technique is implemented for the cancer detection using segmentation method is proposed. The proposed methodology implemented here provides high accuracy of detection as compared to the other existing techniques for cancer detection.
Key Terms: Biclustering, GSEA, Segmentation, Random Walker, walk-trap.
I.INTRODUCTION
To finding of the cancer is a difficult problem, due to the organization of the cancer cells. Cancer passes on to the uncontrolled multiplication of a group of cells in a particular location of the body of environmental interactions and genetic which act in concert for influence the progression and onset of disease. Cancer being detected at early stages can save millions, if valuable treatment is making available. It can cause harm to any part of body. Early detection of cancer all the way through screening and diagnostic mammography enlarges breast cancer treatment options and survival rates. Unluckily, due to the human aspect occupied in the selection procedure, detection of suspicious abnormalities is lying face down to a high degree of error. Consequently of this error rate, biopsies are frequently performed on compassionate wounds, resulting in unwarranted expenditure and anxiety for the patient involved.
One of the representations to detect cancer is Biclustering algorithm, which is not a precise scheme as only one row and column can be segmented at the same time. Clustering and biclustering methods are the most important methods occupied in analyzing gene idiom data which comprise grouping of genes, classification of genes and classification of an illustration.
A group of rapidly dividing cells may form a lump, micro calcifications or architectural distortions which are usually referred to as tumors. Breast cancer is any form of malignant tumor which develops from breast cells. Breast cancers are traditionally known to be one of the major causes of death among women. Mortality rates due to breast cancer have been reducing due to better diagnostic facilities and effective treatments. Early detection of breast cancer through screening and diagnostic mammography increases breast cancer treatment options and survival rates.
Unfortunately, due to the human factor involved in the screening process, detection of suspicious abnormalities is prone to a high degree of error. As a result of this error rate, biopsies are frequently performed on benign lesions, resulting in unwarranted expenditure and anxiety for the patient involved.
This Gene set enrichment approaches leverage pathway information and genomic interaction so that the study of putative genes in the context of their biological processes can be done. Basically, Gene Set Enrichment Analysis (GSEA) [1] involves computational method which considers a priori defined gene sets for investigation of expression data for considerably augmented sets of genes or alleyways. GSEA focuses on the consequence of groups of work together genes moderately than entity genes; and discrepancies have been extended to get better statistical legitimacy [2-5]. Such approaches set aside explanation of considerable genes in the situation of their pathway relations and functional significance; On the other hand, they are bounded in their capability to search for considerably put across genes that form a small module of large pathways or interrelate crossways which have multiple gene sets.
Network analyses gives a framework for the study of genes in context of interactions which are derived from multiple data sources and combined as a global interactive. Numerous studies appraise the topologies of disease genes in global interaction networks which have establish the interrelated disease genes are more likely to work together, and that cancer genes are connected with high network centrality [6-8].
To defeat this inadequacy, biclustering algorithms group genes and tumor samples at the same time, to recognize subsets of genes with related idiom patterns over subsets of tumor samples.
communities using distances originated from the random walk process are discovered. At last, a score is computed for each group of people and modules are ranked by consequences.
II.LITERATURE REVIEW
The objective of segmentation is to make simpler and/or modify the demonstration of an image into incredible that is more significant and easier to investigate. Image Segmentation is characteristically used to find boundaries and objects( curves, lines, etc.) in images. More specifically, image segmentation is the process of allocating a label for every pixel in an image so that pixels having same tag distribute definite visual distinctiveness [11]. The outcome of image segmentation contain set of segments which cooperatively wrap the whole image, or a set of contours take out from the image (detection of edge). Each pixel of this region is related with value to some distinguishing or calculated property, such as intensity, texture or color, intensity. Adjacent regions are considerably different with respect to the same features.
Here they have propose[16] a segmentation process which recognize on a mammogram the obscure areas, guess or not, present in the image using vector quantization which put away sensible time but make available good accuracy with less complication. Watershed algorithm has a disadvantage of over-segmenting the image making it difficult to understand for detection of tumor. Segmentation using gray level co-occurrence matrix necessitated enormous time for tumor separation with smaller amount correctness. Vector quantization segmentation algorithm tries to conquer such weaknesses. Consequently, any segmentation method which utilizes an apriori or single threshold value technique is extremely probable to generate serious segmentation errors. Additionally, tumors or calcifications are embedded in an inhomogeneous environment. In mammograms, environment objects may even become visible brighter. Consequently, global threshold techniques endure substantial problem. Vector quantization segmentation algorithm attempts to conquer such problems. Vector quantization is foundation on clustering algorithm.
Biclustering was first used and useful in gene expression outlining studies by Cheng and Church [12] for data analysis. Since then a variety of biclustering approaches have been proposed caused that biclustering may be able to recognize clinically-considerable gene expression parts that satisfy breast cancers according to inter-tumor heterogeneity. It be in the right places to a distinctive class of clustering algorithms that execute synchronous row-column clustering and permitting for feature set and test set clustering (supervised or unsupervised) concurrently. Biclustering algorithms have been proposed which are used in various application fields such as co-clustering, bi-dimensional clustering, two-mode clustering and subspace clustering [13]. Biclustering is an essential method in two way data analysis. It locates clusters of samples possessing comparable distinctiveness simultaneously with
characteristics creating these similarities. The necessitated uniformity of sample and feature classification gives biclustering an benefit over other methodologies treating samples and features of a dataset individually of each other Biclustering is an tremendously useful data mining tool used for recognizing patterns, where different genes are correlated based on the subset of conditions in the gene expression dataset. This method is successfully applied to pull out finer aspects about the performance of genes beneath confident untried. Thus biclustering can be just fine used for detecting cancer.
In 2013 Uma Sahu, Antony John, Ancy Alphonso, Amit Kamath and Amiya Tripathy gave a survey on Biclustering algorithms. Biclustering gives big contributions to biology and to other fields. They analyse that how microarray helps in biclustering through image processing, transformation and data normalization. It analyzes data from different individuals suffering from different types of cancer. At first it collects data from several individuals with a particular cancer or healthy people and after that test on various kinds of cancerous tissue is applied and can try to find out the present stage of the cancerous patient. [19]
In 2013 Tatsuya Saito, Kohei Kawahara, and Yoshifumi Okada introduces products and information matching user preferences, it can used in online stores. The collaborative filtering method recommends similar items that the user already knows. This protocol improves the collaborative filtering method it performs a wider and more relevant search of items that match the user’s preferences in a database. The proposed method expresses the transitivity of preferences between groups of users who like similar items as bicluster networks and recommends items on the basis of these bicluster networks. It performs simulation experiment using film rating data to compare recommendation accuracy. [20]
A seed-based clustering algorithm that use a seed-based clustering algorithm to discover important modules in human cell cycle data and yeast, discovered by Shamir and Ulitsky [18]. These are providing multiple heuristics for generating seeds for network and for building modules which are based of similarity in expression values. This study arrives that mining of significant genes of dense subgraphs in interaction networks which disclose modules of genomic interactions which are functionally connected to certain phenotypes of interest.
For identifying novel disease genes based on proximity for known disease on the basis of eQTL, genome mapping and interaction data a random walk based on functional interaction network is used by Kholer et al. [14].He concluded that random walk is more profitable than other distance-based methods used for prioritizing disease genes, many same methods has been applied for genome-phenomenon networks.
which reflects relevance or correlation which shows interaction between nodes.
Based on greedy search heuristics, optimization strategies and calculation of distance metrics pons P et al. [15] implemented random walks. We use a random-walk algorithm; to integrate community search based on distance and to optimize large network which are derived transition Walktrap is used. A scoring method used for ranking significant modules, to configure the algorithm which improves the search based on information modules which includes the series of stopping principle used during merge process, module size, maximum module and using modularity, for guiding clustering. The random walk algorithm used for genomic modules ie Walktrap-GM, which is applied for guiding a semi-supervised search used for cancer-related modules in expression-weighted interactome. Walktrap-GM shows strong performance in comparison to similar tools which are developed for identifying subnet work of disease genes for interaction networks, also highlights ability for the interaction in cancer and role of candidate genes.
III.PROPOSEDMETHODOLOGY
The proposed methodology mainly works in the following stages:
1. Take an input image of cancer.
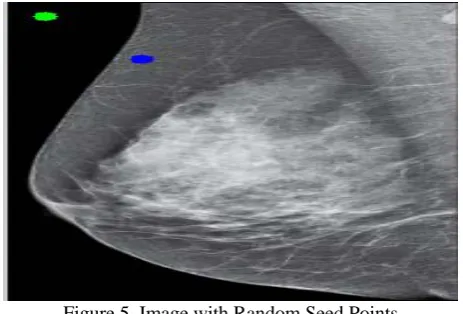
2. Take two seed points on the image, one seed point on the background of the image and the other point is on the object of the image.
3. Now starting with the background seed point random walk of the pixel is traversed until the pixels intensity matches.
4. Detect the region whose pixels intensity differs from the object pixel intensity.
5. Detect the cancer region in the image.
Random Walker Segmentation
It is also known as K-way image segmentation where the user defines seeds which contains k objects.
Given that a random walker starting from a particular location so that what is the probability that is first reaches each of the K seed points.
Figure 1. Random walker first reaches each of the K seed points
1. Using,
map the image intensities to edge weights in the lattice.
2. Obtain a set, VM, of marked (labeled) pixels with K labels, either interactively or automatically.
3. Solve
outright for the potentials or solve
for each label except the final one, f. Set
4. Obtain a final segmentation by assigning to each node, vi, the label corresponding to
IV.RESULT ANALYSIS
The experimental is performed on various cancer images.
Figure 2. Image with seed points
Figure 3. Original Image
Figure 5. Image with Random Seed Points
Figure 6. Cancer Detection using Random Walker
Algorithm CPU time Mean Squre Error PSNR
Base Work 0.8455 9.75E+06 38.6734 Proposed Work 0.5843 5.08E+04 54.5234
Table 1. Result Analysis of base and proposed work
Algorithms Base Work Proposed Work
Probability of Cancer detection
50-80% Above 90%
Table 2. Probability of Cancer Detection
V.CONCLUSION
The proposed methodology implemented here provides efficient probability of cancer detection as compared to the cancer detection using biclustering. The result analysis shows the performance of the proposed methodology that is random walker segmentation based cancer detection. It provides 90% of the cancer detection in the image with efficient results of the region of the cancer.
REFERENCES
[1] Subramanian A, Tamayo P, Mootha VK, Mukherjee S, Ebert BL, Gillette MA, Paulovich A, Pomeroy SL, Golub TR, Lander ES, Mesirov JP: Gene set enrichment analysis: a knowledge-based approach for interpreting genome-wide expression profiles.Proc Natl Acad Sci USA 2005, 102(43):15545-15550. [2] Goeman JJ, van de Geer SA, de Kort F, van
Houwelingen HC: A global test for groups of genes:
testing association with a clinical outcome. Bioinformatics 2004, 20(1):93-99.
[3] Dinu I, Potter JD, Mueller T, Liu Q, Adewale AJ, Jhangri GS, Einecke G, Famulski KS, Halloran P, Yasui Y: Improving gene set analysis of microarray data by SAM-GS. BMC Bioinformatics 2007, 8:242. [4] Bild AH, Yao G, Chang JT, Wang Q, Potti A, Chasse
D, Joshi MB, Harpole D, Lancaster JM, Berchuck A, Olson JA Jr, Marks JR, Dressman HK, West M, Nevins JR: Oncogenic pathway signatures in human cancers as a guide to targeted therapies. Nature 2006, 439(7074):353-357.
[5] Liu D, Ghosh D, Lin X: Estimation and testing for the effect of a genetic pathway on a disease outcome using logistic kernel machine regression via logistic mixed models. BMC Bioinformatics 2008, 9:292.
[6] Goh KI, Cusick ME, Valle D, Childs B, Vidal M, Barabasi AL: The human disease network. Proc Natl Acad Sci USA 2007, 104(21):8685-8690.
[7] Jonsson PF, Bates PA: Global topological features of cancer proteins in the human interactome. Bioinformatics 2006, 22(18):2291-2297.
[8] Petrochilos D, Abernethy N: Assessing network characteristics of cancer associated genes in metabolic and signaling networks. San Diego, CA; 290-297. [Computational Intelligence in Bioinformatics and Computational Biology (CIBCB), 2012 IEEE Symposium on 2012.
[9] Ogata H, Goto S, Sato K, Fujibuchi W, Bono H, Kanehisa M: KEGG: Kyoto Encyclopedia of Genes and Genomes. Nucleic Acids Res 1999, 27(1):29-34. [10]Peri S, Navarro JD, Amanchy R, Kristiansen TZ,
Jonnalagadda CK, Surendranath V, Niranjan V, Muthusamy B, Gandhi TK, Gronborg M, Ibarrola N, Deshpande N, Shanker K, Shivashankar HN, Rashmi BP, Ramya MA, Zhao Z, Chandrika KN, Padma N, Harsha HC, Yatish AJ, Kavitha MP, Menezes M, Choudhury DR, Suresh S, Ghosh N, Saravana R, Chandran S, Krishna S, Joy M, et al.: Development of human protein reference database as an initial platform for approaching systems biology in humans. Genome Res 2003, 13(10):2363-2371.
[11]Linda G. Shapiro and G.C. Stockman., Computer Vision: Theory and Applications. 2001: Prentice Hall. [12]Cheng Y, Church GM: Biclustering of expression
data. Proceedings/International Conference on Intelligent Systems for Molecular Biology; ISMB International Conference on Intelligent Systems for, Molecular Biology 2000, 8:93–103.
[13]Sara C. Maderia and Arlindo L. Oliveira, “Biclustering Algorithms for Biological Data Analysis: A Survey”, IEEE Transactions on Computational Biology and Bioinformatics, vol 1, no 1, January-March 2004.
[14]Kohler S, Bauer S, Horn D, and Robinson PN: Walking the interactome for prioritization of candidate disease genes. Am J Hum Genet 2008, 82(4):949-958. [15]Pons P, Latapy M: Computing communities in large
[16]Dr. H. B. Kekre, Dr.Tanuja Sarode , “Detection of Cancer Using Vector Quantization for Segmentation“ International Journal of Computer Applications (0975 – 8887) Volume 4– No.9, August 2010.
[17]Komurov K, Dursun S, Erdin S, Ram PT: NetWalker: a contextual network analysis tool for functional genomics. BMC Genomics 2012, 13:282-2164-13-282.
[18]Ulitsky I, Shamir R: Identification of functional modules using network topology and high-throughput data. BMC Syst Biol 2007, 1:8.
[19]Uma Sahu, Antony John, Ancy Alphonso, Amit Kamath and Amiya Tripathy “Cancer Detection using Biclustering” 2013 International Conference on Computer Communication and Informatics (ICCCI -2013), Jan 2013.