Analysis of Capacitor Placement in Radial
Distribution System Using DPSO
S.Manikandan1, S.Sasitharan2
Research Scholar, Dept. of EEE, Sathyabama Institute of Science and Technology, Chennai, Tamilnadu, India1 Project Leader, ABB, Ramapuram, Chennai, Tamilnadu, India2
ABSTRACT: This paper Presents Discrete Particle Swarm Optimization based way to deal with accomplishes ideal capacitor position in the radial distribution network. Discrete nature of capacitors and its area are taken to considerations of problem formulation. Scientifically, the capacitor placement issue is a non-linear and optimized one with a set of operation constraints. The proposed technique utilizes to search for ideal areas, types, and sizes of capacitors to be set at various load levels.
KEYWORDS: Radial Distribution Systems, DPSO, Capacitor Placement, Load Flow
I. INTRODUCTION
The objectives of the capacitor placement in the radial distribution network is try to maintain constant voltage profile in that way to minimize the power loss in the radial distribution network feeder. Subsequently, feeder limit can be used in effective way during the peak hours load usages.The technique was selected because of its strength and its capacity to deal with numerous functional requirements and investigate reasonable amount of computation time [8]. Anyway heuristic strategies for feeder reconfiguration and capacitor arrangement had been exhibited [9]. The capacitor placement is very important in the distribution network. This gives reactive power compensation to the network due to this reason the voltage profile in the distribution network could be improved with its angle. The Placement of capacitor in the radial distribution network analyzed by various researchers. The dynamic programming techniques solved the problem of size and placement of the capacitor. Due to growing of power requirement and atomization in the power world, the placement of the capacitor is major role to reduce the power loss. Its necessary to investigate the placement of the capacitor in the radial distribution network
To analysis the distribution network the first step is to know the existing values in the system. There are many load flow algorithm has been developed based on the transmission network[1,2]. Basically this algorithm is not suitable for the distribution network due to the reason of high R/X ratio values in the distribution network. The major load flow solution techniques namely Newton-Raphson (NR) method [3], the Fast Decoupled Load Flow (FDLF) method [4] and their modifications [5] are not suitable for solving the load flow problem in distribution system. Capacitor Placement Problem is presented in two ways [6]. One is based on cost of the capacitor and its life time. The other is based on performance of the capacitor in the radial network. Implementation of the capacitor placement problem in the radial network is solved by Genetic Algorithm based. The feeder voltage reduction and implementation of the capacitor is discussed [7,8,9].In this paper , the proposed algorithm is going to determine the size and place of the capacitor in radial distribution system. These problem could be solved in two methods; first find out the weaken node in the feeder and then select the capacity of the capacitor. These above two problems is solved by power loss index method used to find the location of the capacitor and capacity of the capacitor is calculated by using DPSO method.
II. LOAD FLOW ANALYSIS
A simple load flow method is used to find the placement capacitor in the radial distribution feeders.
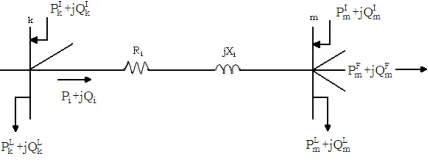
Fig. 1 Circuit model of branch i
Fig. 1 shows a single line diagram of simple radial distribution system. The branch is marked as i, node k is represented sending end side and node m is represented by receiving end side . The voltage at k node is 1.0 p.u. The voltage at node m, can be written as
Vm
Vk Ii Zi
(1)The branch ‘i’ real and reactive power loss can calculated as
P
L
|
I
i|
2R
i (2)Q
L
|
I
i|
2X
i , for i=1,2,…nb (3)The total real and reactive power loss of radial distribution system can be calculated as PL Li
1
T
P
nb
i
(4)QL Li
1
T
nb
i
Q
(5)III. MATHEMATICAL FORMULATION
The main aim of this method is to reduce the cost of the capacitor and reduce the power loss by placing the capacitor in the proper place in the radial network,Also maintain the node voltage within the limit
Objective function
The objective function is:
Max. SAV=K kinetic - K installation (6) Where,
SAV= saving in (Rs)
K kinetic= energy saving (kWH).
K installation = Installation cost of the capacitor.
(i) Energy saving (Kkinetic) is given by
Where,
∆ K kinetic E = saving in energy loss.
= (Annual energy loss before installing the capacitor) - (Annual energy loss after installing capacitor). r = rate of energy in Rs/kWH. (Taken as Rs.3/ kWH).
(ii) Cost of installation of capacitor (K installation) is given as
K installation=Qc × ICK installation × IK installation (8)
Where
Qc = size of capacitor (kVAR).
ICKinstallation=cost of capacitor/kVAR (Rs.200/kVAR)
IKinstallation=annual rate of cost of capacitor (taken as 0.2)
Practically, all the capacitor is grouped together to form a capacitor bank, its value is 150kVAR therefore, capacitor sizes are regarded as integer multiples of the standard size of one bank. The candidate node identification for the capacitor placement is explained in the following section.
IV. IMPLEMENTATION OF DPSO
Flow Chart for Optimal place and capacity of the Capacitor is shown in Fig.2
6
14 9
5
2
13
3 4 5
1 2 3 4
S/S
7 10
8 14
6 11
11 15
9 12
7
12
8
13
V.RESULTSANDANALYSIS
The proposed algorithm is tested on 15-node system and 33-node system. The capacitors locations are obtained by using candidate node identification algorithm using PLI and its value of the nodes are obtained from DPSO. These capacitors are kept at reference nodes and conduct the load flow analysis to know the improvement in voltage profile, power loss reduction and net saving for these systems.
EXAMPLE:
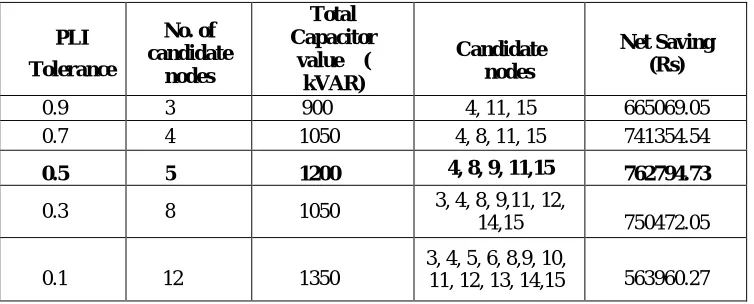
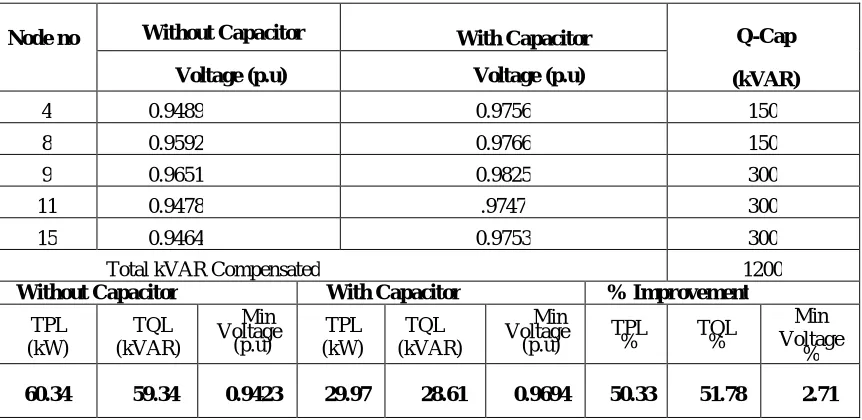
The proposed algorithm is tested on 15-node radial distribution system whose single line diagrams with capacitors is shown in Fig.1.The net saving for different PLI tolerance values are given in Table 1. From Table 1, it seems that the power loss index (PLI) tolerance of 0.5.is chosen to get maximum net saving and the corresponding nodes are 4, 8, 9, 11, and 15. Hence these nodes are suitable for optimal capacitor placement for obtaining maximum net saving By applying the proposed DPSO algorithm the capacitor sizes are obtained at nodes 4, 8 ,9, 11, 15 are 150,150,300,300,300 kVAR respectively. Power losses of 15-node radial distribution system are given in Table 2. The capacitor allocation and loss reduction are given in Table 3.
Fig. 3 15-Node RDS with capacitors
Table 1: Net saving for different PLI tolerance values for 15-node RDS for capacitor placement
PLI
Tolerance
No. of candidate
nodes
Total Capacitor
value ( kVAR)
Candidate nodes
Net Saving (Rs)
0.9 3 900 4, 11, 15 665069.05 0.7 4 1050 4, 8, 11, 15 741354.54
0.5 5 1200 4, 8, 9, 11,15 762794.73
0.3 8 1050 3, 4, 8, 9,11, 12,
14,15 750472.05 0.1 12 1350
3, 4, 5, 6, 8,9, 10,
Table 2 Power Losses of 15-Node RDS for Capacitor Placement
Br.
No Sendin g Node
Receivin g Node
Without
Capacitors With Capacitors Plo ss (k W) Qloss kVAR) ss Plo
(k W) Qlos s (kVA R)
1 1 2 37.72 36.89 17.70 17.32
2 2 3 11.33 14.01 5.26 6.51
3 3 4 2.45 2.40 1.15 1.12
4 4 5 0.05 0.03 0.05 0.03
5 2 9 1.60 1.08 0.88 0.59
6 9 10 0.15 0.10 0.14 0.09
7 2 6 3.01 2.03 1.69 1.14
8 6 7 0.03 0.02 0.03 0.02
9 6 8 0.44 0.30 0.21 0.14
10 3 11 2.18 1.54 1.03 0.73
11 11 12 0.60 0.40 0.57 0.38
12 12 13 0.07 0.05 0.07 0.04
13 4 14 0.20 0.13 0.19 0.13
14 4 15 0.44 0.29 0.46 0.31
Total losses 60.34 59.34 29.97 28.61
Table 3 Capacitor allocation and loss reduction for 15-node RDS
Node no Without Capacitor With Capacitor Q-Cap
(kVAR)
Voltage (p.u) Voltage (p.u)
4 0.9489 0.9756 150 8 0.9592 0.9766 150 9 0.9651 0.9825 300 11 0.9478 .9747 300 15 0.9464 0.9753 300 Total kVAR Compensated 1200
Without Capacitor With Capacitor % Improvement
TPL (kW) TQL (kVAR) Min Voltage
(p.u) (kW) TPL (kVAR) TQL
Min Voltage
(p.u) TPL % TQL %
Min Voltage
%
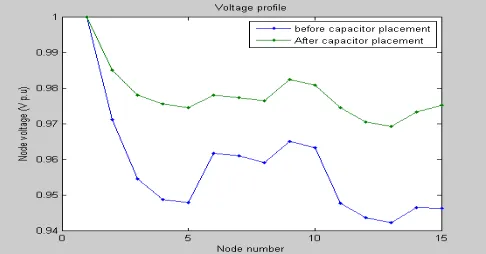
Fig 5. Voltage profile at load level 1.0 for 15-node RDS before and after compensation using DPSO
The proposed DPSO results are compared with existing method for 15-node RDS is given in Table 5. From the Table 5., it is observed that DPSO has succeeded in finding the global solution with a high probability. The total real power losses are reduced from 60.3482 kW to 29.9765 kW, i.e.50.33%, reduction. The total reactive power losses are reduced from 59.3421 kVAR to 28.6149 kVAR, i.e.51.78% reduction. The minimum voltage improved from 0.9423p.u. at node 13 to 0.9694p.u. at node 13. Thus maximum voltage regulation from 5.77% to 3.06%, i.e.,46.96% improved. The net saving is Rs.7,62,794/-with capacitor placement at optimal location. To show the average performance of the algorithm, it is run 100 times, out of which proposed method converged to optimum solution 92 times whereas the existing method converged 71 times. The CPU time for the proposed method is reduced from 2.7545sec to 1.7233sec on Core 2 Duo compared with the existing method.
Table 5 comparison of test results of 15- Node RDS for capacitor placement
Uncom pensated
Compensated
Existing Method[10] Proposed Method
Optimal locations and Size
---
Node Size (kVAR) Node (kVAR) Size 4 450 4 150 8 150 8 150 9 150 9 300 11 300 11 300 15 0 15 300 Total Active Power loss(kW) 60.34 29.9960 29.9765
Total Reactive power loss
(kVAR) 59.34 29.1128 28.6149 Net Saving
(Rs.)
Best
---
756168.28 762794.73 Worst 530665.67 697370.94 Average 742251.61 752365.08 Percentage loss reduction --- 50.3274 51.1235
Min.Voltage(p.u) 0.94 0.9677 0.9694 Voltage Regulation(%) 5.77 3.23 3.06 No. of times best solution
VI.CONCLUSIONS
A DPSO algorithm for solving the capacitor placement problem in radial distribution systems has proposed in this chapter. With full considerations of different load levels, and practical aspects of fixed or switched capacitor banks, the target problem is reformulated by a comprehensive objective function .This chapter aims at discussing the placement of capacitors in order to reduce the real power losses and improve the voltage profile to maximize the net saving. The proposed method deals with selection of nodes by using power loss index (PLI) and then Discrete Particle Swarm Optimization (DPSO) has used for size with type of the capacitors to reduce the real power losses by cancelling part of the reactive power flowing in the system and to improve voltage profile. The proposed algorithm is tested with three distribution systems consisting of 15node, 33 node and 69 node radial distribution systems. From the results, we concluded as The proper placement of the capacitor reduces the power loss in the radial distribution system.In addition of power loss reduction, the voltage profile can be improved.
REFERENCES
[1] B.Stott, and O.Alsac,; “Fast decoupled load flow”, IEEE Trans. on Power Apparatus and Systems, Vol.PAS-93, No.2 May 1973, pp.859-869. [2] Van Amerongen, R.A.M.: “A general-purpose version of the fast decoupled load flow”, IEEE Trans. on Power Systems, Vol.4.No.2, May
1989,pp.760-766.
[3] Tinney, W.F., and Hart, C.E.: “Power flow solutions by Newton’s method”, IEEE Transactions on Power Apparatus and Systems, Vol PAS-86, No.11, Nov 1967, pp.1449-1457.
[4] Haque, M.H.: “Novel decoupled load flow method”, IEE Procedings-C, Generation Transmission and Distributions 1993, 140, No.3, 1993, pp.199-205
[5] Shrimohammadi, D., Hong, H.W., Semlyen, A., and Luo, G.X.: “A compensation-based power flow method for weakly meshed distribution and transmission networks”, IEEE Transactions on Power systems, Vol- 3,No 2,May 1988,pp.753-762.
[6] M. H. Shwehdi, Mantawi, A. Selim, S, Al-Shehri, A, Al-Bassam, G.K., A. Mantawi; “Capacitor Placement in distribution systems, A new formulation” IEEE Bologna Power Tech Conference, Bologna, Italy, June 2003.
[7] S.Nuchprayoon, and N.Wieaphorn.: “Implementation of capacitor placement and voltage reduction on distribution feeder” 2007 IEEE Canada ,Electrical Power Conference EPC-2007, pp 456-460.
[8] Damon W. Holladay, Clifford H. Grigg, and Bruce D. Dallman,: “Equipment Performance Study on Voltage Regulators” IEEE Transaction on Power Delivery, Vol. 23, No. 4, October 2008.pp 2496-2512.
[9] D.Jiang, and R.Baldick,: “Optimal electric distribution system switch reconfiguration and capacitor control”, IEEE Trans. Power Systems, Vol. 11, No.2, May 1996, pp.890-897.