ISSN (Print) : 2320 – 3765 ISSN (Online): 2278 – 8875
I
nternational
J
ournal of
A
dvanced
R
esearch in
E
lectrical,
E
lectronics and
I
nstrumentation
E
ngineering
(A High Impact Factor, Monthly, Peer Reviewed Journal)
Website: www.ijareeie.com
Vol. 7, Issue 11, November 2018
ANFIS Controller for Battery Control Used in
Three Phase Grid Connected PV System
N.Vasuki1, Dr.K.Punitha2 , Er.C.Kavitha3
PG Scholar, Department of Electrical and Electrical Engineering, P.S.R.Rengasamy College of Engineering for Women, Sivakasi, Tamilnadu, India1
Head of the Department, Department of Electrical and Electrical Engineering, P.S.R.Rengasamy College of Engineering for Women, Sivakasi, Tamilnadu, India2
Assistant Professor, Department of Electrical and Electronics Engineering, P.S.R.Rengasamy College of Engineering for Women, Sivakasi, Tamilnadu, India3
ABSTRACT: This project proposes LUO converter based grid voltage stability in PV system based three phase AC grid using Neuro Fuzzy based MPPT algorithm. The LUO converter is used to maintain constant voltage to the three phase voltage source inverter by MPPT algorithm. This enables grid to always supply/absorb a balanced set of fundamental currents at unity power factor. The energy management is achieved using Bidirectional converter with buck and boost operation. This project is implemented in Matlab simulation.
I. INTRODUCTION
Due to the critical condition of industrial fuels which include oil, gas and others, the development of renewable energy sources is continuously improving. This is the reason why renewable energy sources have become more important these days. Few other reasons include advantages like abundant availability in nature, eco-friendly and recyclable. Many renewable energy sources like solar, wind, hydel and tidal are there.
Among these renewable sources solar and wind energy are the world’s fastest growing energy resources. With no emission of pollutants, energy conversion is done through wind and PV cells.
Day by day, the demand for electricity is rapidly increasing. But the available base load plants are not able to supply electricity as per demand. So these energy sources can be used to bridge the gap between supply and demand during peak loads. This kind of small scale stand-alone power generating systems can also be used in remote areas where conventional power generation is impractical.
ISSN (Print) : 2320 – 3765 ISSN (Online): 2278 – 8875
I
nternational
J
ournal of
A
dvanced
R
esearch in
E
lectrical,
E
lectronics and
I
nstrumentation
E
ngineering
(A High Impact Factor, Monthly, Peer Reviewed Journal)
Website: www.ijareeie.com
Vol. 7, Issue 11, November 2018
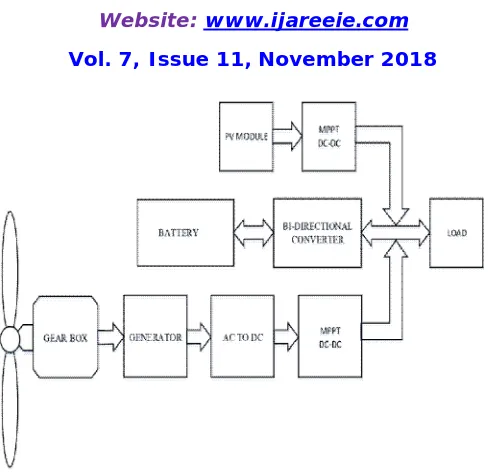
Fig 1.1: Block diagram of hybrid system
The entire hybrid system comprises of PV and the wind systems. The PV system is powered by the solar energy which is abundantly available in nature. PV modules, maximum power point tracing systems make the PV energy system. The light incident on the PV cells is converted into electrical energy by solar energy harvesting means. The maximum power point tracking system with Perturb & absorb algorithm is used, which extracts the maximum possible power from the PV modules. The ac-dc converter is used to converter ac voltage to dc.
Wind turbine, gear box, generator and an AC – DC converter are included in the wind energy system. The wind turbine is used to convert wind energy to rotational mechanical energy and this mechanical energy available at the turbine shaft is converted to electrical energy using a generator. To coerce the maximum power from wind system we used a maximum power point tracing system.
Both the energy systems are used to charge a battery using bi-directional converter. Bidirectional converter and the battery form the common additional load to the wind and PV energy systems.
Hybrid generation systems that use more than a single power source can greatly enhance the certainty of load demands all the time. Even higher generating capacities can be achieved by hybrid system. In stand-alone system we can able to provide fluctuation free output to the load irrespective of weathers condition. To get the energy output of the PV system converted to storage energy, and constant power delivered by the wind turbine, an efficient energy storage mechanism is required, which can be realized by the battery bank.
II. LITERATURE REVIEW
Due to high demand of energy and limited availability of conventional energy, nonconventional sources become more popular among researchers. A lot of research work is going on to enhance the power efficiency of non-conventional sources and make it more reliable and beneficial.
ISSN (Print) : 2320 – 3765 ISSN (Online): 2278 – 8875
I
nternational
J
ournal of
A
dvanced
R
esearch in
E
lectrical,
E
lectronics and
I
nstrumentation
E
ngineering
(A High Impact Factor, Monthly, Peer Reviewed Journal)
Website: www.ijareeie.com
Vol. 7, Issue 11, November 2018
III. SYSTEM IMPLEMENTATION
The main objective of the thesis is to implement a power system that is a hybrid of both Photovoltaic and wind powers. The step by step objectives are
To study and model PV cell, PV array and PV panels
To study the characteristic curves and effect of variation of environmental conditions like temperature and irradiation on them
To study the PV module’s behavior under partial shading condition
To trace the maximum power point of operation the PV panel irrespective of the changes in the environmental
conditions
To study and simulate the wind power system and track its maximum power point
Implement hybrid system
A) PHOTVOLTAIC ARRANGEMENT
A photovoltaic energy system is mainly powered by solar energy. The configuration of PV system is manifested in figure 2.1.
Fig.2.1 Overall block diagram of PV energy system
It contains PV modules or arrays, which convert solar energy in the form of solar irradiation into electric energy. The dc-dc converter changes the level of the voltage to match it with the electrical appliances that are supplied by this system. This DC-DC converter may be either buck or boost or buck-boost contingent on the required and available voltage levels. The maximum power point tracing system coerces the maximum power from the PV modules. A bi-directional converter which is able to supply the current in both the directions is used to charge the battery when there is a power surplus and the energy stored by the battery is discharged into the load when there is a power deficit.
B)MAXIMUM POWER POINT TRACKING
ISSN (Print) : 2320 – 3765 ISSN (Online): 2278 – 8875
I
nternational
J
ournal of
A
dvanced
R
esearch in
E
lectrical,
E
lectronics and
I
nstrumentation
E
ngineering
(A High Impact Factor, Monthly, Peer Reviewed Journal)
Website: www.ijareeie.com
Vol. 7, Issue 11, November 2018
a) P&O algorithm
b) IC algorithm
c) Parasitic capacitance
d) Voltage based peak power tracking
e) Current Based peak power tracking
(i) Perturb and observe
Each and every MPPT algorithm has its own advantages and disadvantages. Perturb and observe (P&O) method is widely used due its simplicity. In this algorithm we introduce a perturbation in the operating voltage of the panel. Perturbation in voltage can be done by altering the value of duty-cycle of dc-dc converter.
Fig. 2.11 P-V characteristics (basicidea of P&O algorithm)
Fig 2.11 show the p-v characteristics of a photovoltaic system, by analyzing the pv characteristics we can see that on right side of MPP as the voltage decreases the power increases but on left side of MPP increasing voltage will increase power. This is the main idea we have used in the P&O algorithm to track the MPP [11]. The flow chart of P&O algorithm is manifested in figure 2.12.
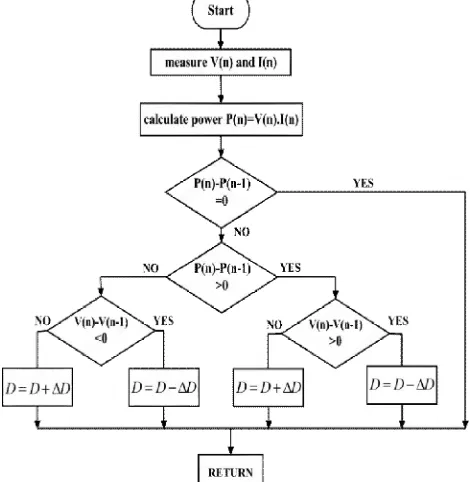
Fig.2.12 Flowchart of Perturb & Observe MPPT algorithm
.
MPP
P O ( W at )
ISSN (Print) : 2320 – 3765 ISSN (Online): 2278 – 8875
I
nternational
J
ournal of
A
dvanced
R
esearch in
E
lectrical,
E
lectronics and
I
nstrumentation
E
ngineering
(A High Impact Factor, Monthly, Peer Reviewed Journal)
Website: www.ijareeie.com
Vol. 7, Issue 11, November 2018
As we can see from the flow chart first of all we measure voltage and current, by using these values we calculate power, calculated power is compared with previous one and accordingly we increase or decrease the voltage to locate the Maximum Power Point by altering the duty cycle of converter.
IV. RESULTS AND DISCUSSIONS
The parameters used for the modeling of PV module are shown in table 2.1 [2]
Sl.no. Parameter Value
1 Imp 7.61 A
2 Vmp 26.3 V
3 Isc 8.21 A
4 Pmax 200.143 W
5 Voc 32.9 V
6 Kv -0.1230 V/K
7 Ki 0.0032 A/K
8 Ns 54
9 Np 4
TABLE 2.1 Parameters of the PVarray at 250C, 1000w/m2
Simulation results of PV module
ISSN (Print) : 2320 – 3765 ISSN (Online): 2278 – 8875
I
nternational
J
ournal of
A
dvanced
R
esearch in
E
lectrical,
E
lectronics and
I
nstrumentation
E
ngineering
(A High Impact Factor, Monthly, Peer Reviewed Journal)
Website: www.ijareeie.com
Vol. 7, Issue 11, November 2018
Fig. 5.2 P-V curve of PV module
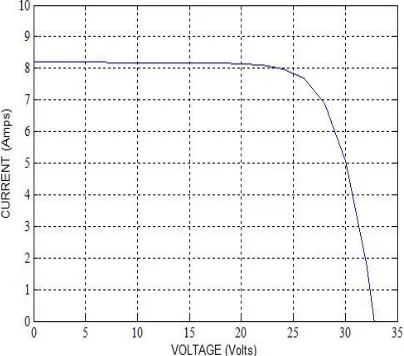
Fig 5.1, 5.2 represent the I-V and P-V characteristics of a PV module. From fig 5.1 we can see that short circuit current (Isc) of PV module is approximately 8.2A and open circuit voltage (Voc) is approximately 32.9 volts. From fig 5.2 we
can observe that maximum power is approximately 200W and it occurs at a current of 7.61A and voltage at 26.3V approximately.
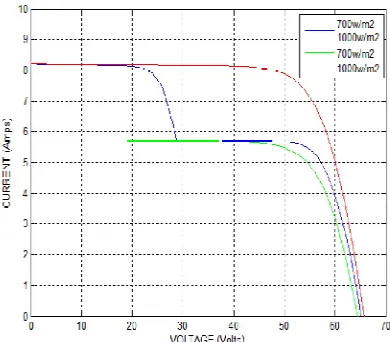
Effect of variation of irradiation
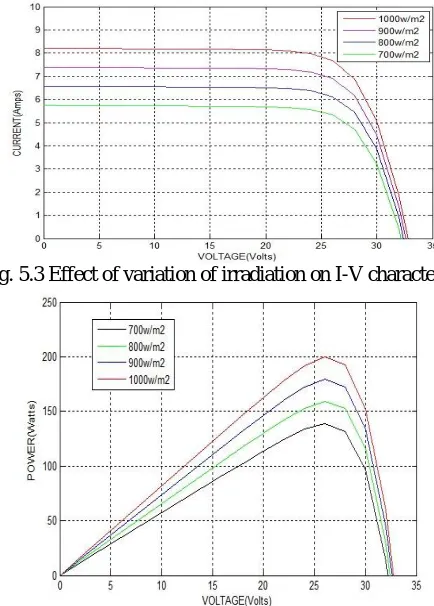
Fig. 5.3 Effect of variation of irradiation on I-V characteristics
ISSN (Print) : 2320 – 3765 ISSN (Online): 2278 – 8875
I
nternational
J
ournal of
A
dvanced
R
esearch in
E
lectrical,
E
lectronics and
I
nstrumentation
E
ngineering
(A High Impact Factor, Monthly, Peer Reviewed Journal)
Website: www.ijareeie.com
Vol. 7, Issue 11, November 2018
In fig 5.3, 5.4 we can see the effect of change in solar irradiation on PV characteristics. From fig 5.3 we observe that as we increase the solar irradiation short circuit current increases. Variation in Solar irradiation effects mostly on current, as we can observe from fig 5.3 as we increase solar irradiation from 700 w/m2 to 1000 w/m2 current increases from 5.7A to 8.2A approximately but effect of variation of solar irradiation on voltage is very less. Fig 5.4 shows the effect of variation of solar irradiation on P-V characteristics. As solar irradiation increases, power generated also increases. Increase in power is mainly due to increment in current.
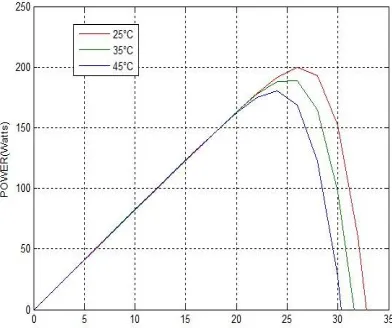
Effect of variation of temperature
Fig. 5.5 Effect of variation of temperature on I-V characteristics
The outcome of variation of temperature on I-V characteristics is shown in the fig 5.5. From the fig 5.5 we can see the variation of temperature mostly effects voltage, as we increase the temperature voltage decreases but current remains almost unaltered. Fig 5.6 shows effect of temperature variation on the P-V characteristics. As temperature increases power generated decreases, because on increment of temperature voltage decreases.
ISSN (Print) : 2320 – 3765 ISSN (Online): 2278 – 8875
I
nternational
J
ournal of
A
dvanced
R
esearch in
E
lectrical,
E
lectronics and
I
nstrumentation
E
ngineering
(A High Impact Factor, Monthly, Peer Reviewed Journal)
Website: www.ijareeie.com
Vol. 7, Issue 11, November 2018
Shading effect on PV array
Fig. 5.7V-I characteristics in partial shading condition
Fig.6.8 P-V characteristics in partial shading condition
I-V, P-V characteristics of a PV array in shading condition can be seen in fig. 5.7 and fig 5.8. As we can observe from fig 5.6 partially shaded PV modules generate less current than the unshaded module. Under partially shading condition we can observe more than one maximum power picks from fig 5.8.
Outputs after MPPT
ISSN (Print) : 2320 – 3765 ISSN (Online): 2278 – 8875
I
nternational
J
ournal of
A
dvanced
R
esearch in
E
lectrical,
E
lectronics and
I
nstrumentation
E
ngineering
(A High Impact Factor, Monthly, Peer Reviewed Journal)
Website: www.ijareeie.com
Vol. 7, Issue 11, November 2018
Fig. 5.9 Output power of PV module after MPPT
Fig. 5.10 Output voltage of PV module after MPPT
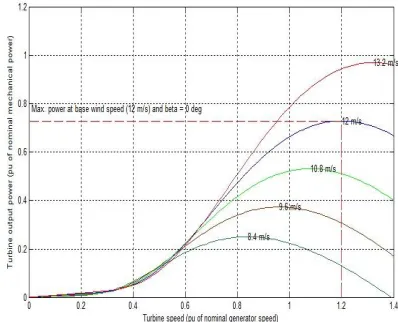
Simulation result of wind energy system
Fig 6.11 shows turbine power characteristics at different wind speed. From the fig 6.11 we can observe that as wind speed increases turbine output power also increases.
ISSN (Print) : 2320 – 3765 ISSN (Online): 2278 – 8875
I
nternational
J
ournal of
A
dvanced
R
esearch in
E
lectrical,
E
lectronics and
I
nstrumentation
E
ngineering
(A High Impact Factor, Monthly, Peer Reviewed Journal)
Website: www.ijareeie.com
Vol. 7, Issue 11, November 2018
Fig 5.12 Three phase line output voltage of PMSG
PMSG output is shown in the fig 5.12.The point of operation of crest power of wind generator output is traced by a maximum power point tracing system is shown in the fig 5.13 given below. Output Voltage of wind generator at which maximum power is achieved is shown in the fig 5.14.
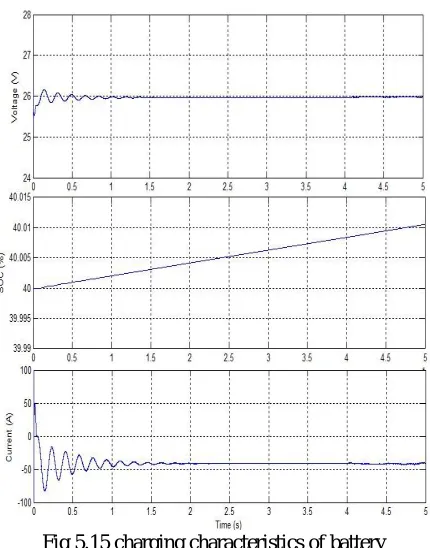
Simulation results of charging/ discharging
Fig 5.15 charging characteristics of battery
ISSN (Print) : 2320 – 3765 ISSN (Online): 2278 – 8875
I
nternational
J
ournal of
A
dvanced
R
esearch in
E
lectrical,
E
lectronics and
I
nstrumentation
E
ngineering
(A High Impact Factor, Monthly, Peer Reviewed Journal)
Website: www.ijareeie.com
Vol. 7, Issue 11, November 2018
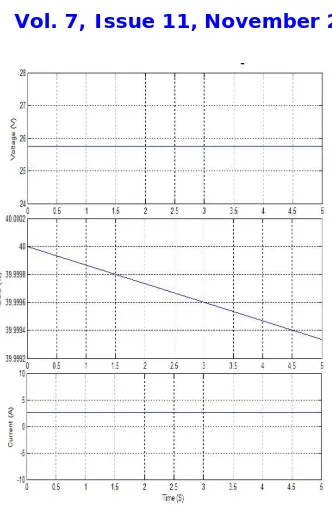
Fig 5.16 Discharging characteristics of battery
From fig 5.16 we can see during discharging, battery start supplying constant voltage and state of charge start decreasing and also during discharging current become positive, which shows battery is supplying the power to the load.
V. CONCLUSIONS
PV cell, module and array are simulated and effect of environmental conditions on their characteristics is studied
Wind energy system has been studied and simulated
Maximum power point of operation is tracked for both the systems using P&O algorithm
Both the systems are integrated and the hybrid system is used for battery charging and discharging
FUTURE SCOPE
MPP can be tracked using different algorithms
Battery charge controller can be designed for more reliable operation and better battery life
REFERENCES
1. T. Salmi, M. Bouzguenda, A. Gagtli, “MATLAB/Simulink based modeling of solar photovoltaic cell,” International journal of renewable energy research, vol.2, no.2, 2012.
2. S. Meenakshi, K.Rajambal, S. Elangovan “Intelligent controller for stand-alone hybrid generation system,” IEEE, May. 2006.
3. Nabil A. Ahmed, MasafumiMiyatake, “A stand-alone hybrid generation system combining solar photovoltaic and wind turbine with simple maximum power point tracking control,” IPEMC 2006, IEEE, 2006.
4. M. G. Villalva, J. R. Gazoli, “Modeling and circuit based simulation of photovoltaic arrays,” Brazilian power electronics conference (COBEP), 2009.
5. Marcelo GradellaVillalva, Jonas RafelGazoli, “Comprehensive approach to modeling and simulation of photovoltaic arrays,” IEEE transaction on power electronics, vol.24, no.5, May 2009.
6. Hiren Patel and VivekAgarwal, “Matlab based modeling to study the effect of partial shading on PV array characteristics,” IEEE transaction on energy conversion,
vol.23, no.1, March 2008.
7. Mohammed Abdulazeez, IresIskender, “Simulation and experimental study of shading effect on series and parallel connected PV modules,” IEEE transaction on energy conversion, vol.27, no.2, March 2008.
8. SiyuGuo, Timothly Michael Walsh, “Analyzing partial shading of PV module by circuit modeling,” IEEE 2011.
9. Zhou Xuesong, Song Daichun, Ma Youjie, Chen Deshu, “The simulation and design for MPPT of PV system based on Incremental conductance method,” Wase International conference on information engineering, 2010.
10. Azadeh Safari, SaadMekhilef, “Simulation and Hardware Implementation of Incremental Conductance MPPT with Direct Control Method Using Cuk Converter,”