Trend and Volatility in Wheat, Rice and Cotton Prices
Sunil Phougat
Assistant Professor, Department of Economics, Govt. College Jassia, Rohtak (Haryana)
Abstract
The objective of the present study is to examine the price trends and volatility in agricultural commodities mainly wheat, rice and cotton. It has observed that international prices of agricultural commodities are highly volatile and are characterized by cyclical variations. Among these, prices of food grains and cotton have fluctuated around a static mean. However, due to WTO commitments, domestic produces can’t be protected from international price shocks. If such shocks are transmitted to farm level, it would destabilize the crop pattern and supply. Since vast majority of the Indian farmers is either small or marginal, they do not have resources and capabilities to change their cropping patterns in a short period as necessitated by the change in international prices. Since under WTO obligations, temporary imports and price shocks can’t be checked, there is need to develop mechanism to regulate the unwanted imports and exports.
Keywords: WTO, India, Price Trend, Volatility, Agricultural Commodity
I Introduction
Agricultural trade policy has two dimensions i.e. the producer welfare and the consumer welfare. Producer welfare is enhanced when the exported commodity fetches a higher price in international markets. The consumer welfare is diminished in this case by a rise in domestic prices due to decreased availability
in domestic markets. The net social welfare may be positive or negative depending upon which of these effects is larger. Reverse is the case for importable (commodities with lower international prices). The issues in question are food security (for exportable particularly basic food stuffs) and livelihood security (for importable). Exports (imports) can be a good policy in cases where the producer (consumer) welfare is consistently higher than the consumer (producer) welfare and the losers can be compensated by the gainers directly or through some other institutional mechanism.
reason for gluts remains huge subsidies in Europe, the USA, and Japan. Farmers are a powerful vote bank the world over. They force governments to keep subsidies and import tariffs high. Every country is subsidizing exports at less than cost, so prices are crashing.
II Objective of the Study
The present study is mainly focused on the price trends and volatility in agriculture. In this way, the objective of the study is to examine the price trends and volatility in agricultural commodities mainly wheat, rice and cotton.
III Methodology
In the present study, secondary data is used for analysis and collected from various sources i.e. International Financial Statistics, Yearbook, IMF etc. For analysis, the study period has been taken from 1950 to 2015. Graphs have been used to analyze the data.
IV Price Trends and Volatility of
Selected Agricultural Commodities
India, being an economy which is still, by large, dependent on agriculture, must categories the agricultural commodities in such groups which are easy to identify for exports/imports and then form policies to remain export competitive in comparison to the international prices and on the other hand, be ready with the purchasing policies to be an effective and cautious buyer. Behavior of international prices in terms of their level, trend and fluctuations is the most important factors in determining competitiveness, exports, imports and choice of tariffs, by any trading country.
Information about past trends is also useful to draw inferences for future prices and to formulate long term strategy on trade. The
international view about the agricultural prices was based mainly on the assumption that demand for food grows at a faster rate than the growth of supply, and that this would result in rising trend in prices of food and similar agricultural commodities. However, this view has been refuted by the dynamics of demand and supply as real prices of food have followed downward trends notwithstanding occasional price hikes during the last 50 years. The decline is attributed to improvement in supply that has resulted from application of biological and chemical sciences to agriculture which enabled sharp increase in grain yields first in developed countries and with some leg in the developing countries. It is felt that world food situation would continue to improve over the next two to three decades and grains prices in real terms would continue to decline. For developing countries where agriculture and grains dominate the economy, the implications are serious underscoring the need for continued technological degradation. Another aspect of behavior of international prices relevant to trade policy is their volatility.
have been rounded off to near complete digit for easy calculations and representations
through charts:
Table 1
Nominal International Prices of Selected Agricultural Commodities (1950-2015)
US $/ Tonne
YEAR Wheat (US HRW) FOB Gulf
Rice Thai (5% Broken) FOB
Bangkok Cotton Liverpool Index
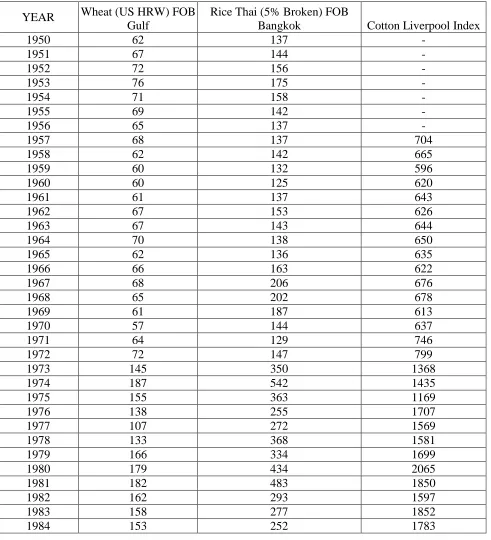
1950 62 137 -
1951 67 144 -
1952 72 156 -
1953 76 175 -
1954 71 158 -
1955 69 142 -
1956 65 137 -
1957 68 137 704
1958 62 142 665
1959 60 132 596
1960 60 125 620
1961 61 137 643
1962 67 153 626
1963 67 143 644
1964 70 138 650
1965 62 136 635
1966 66 163 622
1967 68 206 676
1968 65 202 678
1969 61 187 613
1970 57 144 637
1971 64 129 746
1972 72 147 799
1973 145 350 1368
1974 187 542 1435
1975 155 363 1169
1976 138 255 1707
1977 107 272 1569
1978 133 368 1581
1979 166 334 1699
1980 179 434 2065
1981 182 483 1850
1982 162 293 1597
1983 158 277 1852
Source: 1. International Financial Statistics, Yearbook, IMF, Various Issues.
2. www.thairiceexporters.org. 3. www.knoema.com
4. www.isosugar.org
For analysis of international price trends, seven commodities namely US Hard Red Winter (US HRW) wheat FOB Gulf, Thai Rice (5% Broken) FOB Bangkok, Sugar at Caribbean Ports, Cotton Liverpool Index, Spices(Black pepper Singapore), Tea have been taken with their international market
prices in US $ to bring in uniformity in pricing. Quantity for US HRW, Thai Rice, Sugar, Cotton, Tea, Black pepper has been recorded in Tonnes.
International Price trend of US Hard Red Winter (HRW) wheat FOB Gulf
1985 138 216 1320
1986 115 211 1056
1987 115 230 1647
1988 146 302 1399
1989 170 320 1673
1990 137 271 1819
1991 129 294 1694
1992 152 268 1276
1993 141 237 1278
1994 151 270 1760
1995 178 321 2165
1996 210 338 1774
1997 162 302 1745
1998 127 305 1443
1999 112 248 1170
2000 115 202 1291
2001 169 227 1196
2002 182 215 1278
2003 219 236 1299
2004 270 249 1306
2005 267 237 1359
2006 271 256 1325
2007 278 289 1360
2008 287 297 1379
2009 291 323 1442
2010 299 304 1390
2011 298 367 1408
2012 311 389 1445
2013 305 403 1449
2014 313 411 1423
0 50 100 150 200 250 300 350
19
50
19
52
19
55
19
58
19
61
19
64
19
67
19
70
19
73
19
76
19
79
19
82
19
85
19
88
19
91
19
94
19
97
20
00
20
03
20
06
20
09
20
12
20
15
US
$/
To
n
n
e
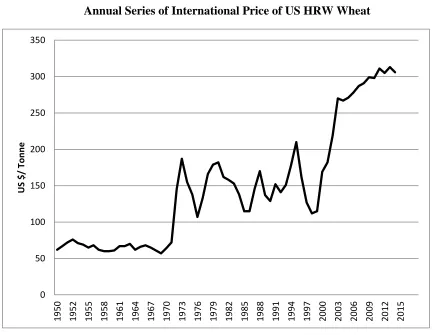
As mentioned earlier, food grain prices remained somewhat static till 1970, and then shoot up to unexpectedly very high peaks because of oil shock, US HRW wheat prices too had a quantum leap and in 1973, it reached to US $145 from US $ 72 in 1972, just an year ago. It was more than double of the price a year before. Immediate next year also witnessed another surge and it was
priced at US $ 187 in 1974. This price was recorded all time high price till the year 1996 when price for US HRW had touched US $ 210 per tonne. Afterwards, prices have been bit stable and no such huge variations in the prices had been observed. In recent years US HRW has been hovering around US $ 300 per tonne. It can be seen by the following figure:
Figure 1
Annual Series of International Price of US HRW Wheat
Source: Table 1
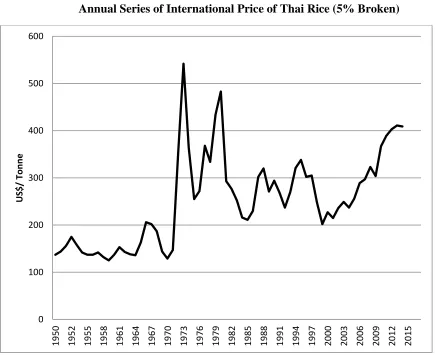
International Price Trend of Thai Rice (5% Broken) at FOB Bangkok
International price of Thai rice (5% broken) at FOB Bangkok shows some cyclic movement around a horizontal line. The fluctuations were very violent during the
the rice are at around US $ 410 per tonne. Prices have been moving up and down, but steep increase of 1970 was never repeated and somehow stabilized prices ruled the
international market trading. The figure is representing the movement of prices is given below:
Figure 2
Annual Series of International Price of Thai Rice (5% Broken)
Source: Table 1.
It is cleared from the figure 2 that the certain unexpected peaks appeared in and around 1970-1975 and 1980-1985. Year 1977, 1986 and 2001 had correction and downward revision of prices, and after 2000, prices have been on increasing side with little up and downward movements. But the recent prices too are far below than the prices of 1970s.
International Price Trend of Cotton
Absence of authentic and reliable data regarding international prices of cotton for the initial years 1950-1956 made it difficult to establish a trend of the prices of cotton in the international market place. Recorded prices of cotton at Liverpool index were available from the year 1957 onwards and the
0 100 200 300 400 500 600
19
50
19
52
19
55
19
58
19
61
19
64
19
67
19
70
19
73
19
76
19
79
19
82
19
85
19
88
19
91
19
94
19
97
20
00
20
03
20
06
20
09
20
12
20
15
US
$/
To
n
n
same have been taken into consideration for finding the trends in the cotton prices. It can
be seen by the following figure:
Figure 3
Annual Series of International Price of Cotton Liverpool Index
Source: Table 1
After through survey of price data, Liverpool prices of cotton, which represent prices of cheapest five of ten varieties, were chosen to represent international prices of cotton. The prices moved in a narrow range of us $ 596 and $799 per tonne from 1957 to 1972 and rose by 71% in 1973 to mark a new trend. International price of cotton since then fluctuated around long run average of US $ 1578 per tonne till 2000. The average price has been around US $ 1375 to US $ 1400 per tonne from the year 2000 to 2015 with latest price being US $ 1460 per tonne.
V Conclusion
To sum up, it has observed that international prices of agricultural commodities are highly volatile and are characterized by cyclical variations. Among these, prices of food grains and cotton have fluctuated around a static mean. However, due to WTO commitments, domestic produces can’t be protected from international price shocks. If such shocks are transmitted to farm level, it would destabilize the crop pattern and supply. Since vast majority of the Indian farmers is either small or marginal, they do not have resources and capabilities to change their cropping patterns in a short period as
0 500 1000 1500 2000 2500
19
57
19
59
19
61
19
63
19
65
19
67
19
69
19
71
19
73
19
75
19
77
19
79
19
81
19
83
19
85
19
87
19
89
19
91
19
93
19
95
19
97
19
99
20
01
20
03
20
05
20
07
20
09
20
11
20
13
20
15
US
$/
To
n
n
necessitated by the change in international prices. Since under WTO obligations, temporary imports and price shocks can’t be checked, there is need to develop mechanism to regulate the unwanted imports and exports.
Increase in the world prices adversely affects the welfare of least developed countries that are net importer of food grains. India is a net exporter of agricultural products. Hence if all these related distortions are removed India would stand to gain in her share of agricultural exports. Moreover a strategy to promote exports is also highlighted. It is suggested that to improvement in the quality of agricultural products. India has to develop brand quality of these agricultural products and they have also suggested that India has to develop a team of expert having excellent knowledge of legal economics and political aspect of various WTO provisions to protect the countries interest in the WTO meetings and conferences.
References:
[1] Chand, Ramesh (2002), “Trade Liberalisation, Agricultural Prices and Net Social Welfare in India”, in S.S. Acharya, Surjit Singh and Vidya Sagar (eds),
Sustainable Agriculture, Poverty and Food Security, Volume 2, Rawat Publications, Jaipur, pp. 791-820.
[2] Chand, Ramesh (2002), “Trade Liberalization WTO and Indian Agriculture”, Mittal Publications, New Delhi.
[3] Dhiman N.; Harish (2014), “Price Fluctuations in International Trade: Reasons and Remedies”, Business Review and Forecasts, Vol.46, No. 9, Jan 14, pp. 341-362.
[4] GOI, Agricultural Statistics at a Glance, Various Issues, Ministry of
Agriculture, Department of Agriculture & Cooperative, New Delhi.
[5] International Financial Statistics, Yearbook, IMF, Various Issues.
[6] Jayasheela and Vishwantha (2008), “Agriculture Credit in the Post WTO Period”, Agriculture Situation in India, NCAP Pusa, New Delhi.
[7] Jayman et al. (2015) “Decreasing Share in International Trade: Big Concern for India” Monthly Economic Digest, Vol. 21, No.8, 2015.
[8] Phougat, Sunil; Kumar, Surender (2009), “Performance and Prospects of India’s Agricultural Export”, Southern Economist, Vol. 48, No. 7, pp. 37-40.
[9] V. Balasubramanian (2013), “WTO and Indian Agriculture Insight, Implication and Imperatives”, Asian Journal of Business and Management”, Vol. 6, No. 23.
[10] Verma et al. (2013), “Tools to Counter Price Volatility In International Trade”, International Food Policy Research Institute (IFPRI), Washington, D.C., U.S.A. (Mimeo).