c e-ISSN: 2348-6848, p- ISSN: 2348-795X Volume 2, Issue 12, December 2015
International Journal of Research (IJR)
Available at http://internationaljournalofresearch.org
Analysis of IEEE 802.11a standard performance in mobile
environment
Thota Ambika
1& Ravi Kumar Kota
21.
M.Tech Student of VasireddyVenkatadri Institute of Technology Numbur AP-India,
2
Assistant Professor, ECE Dept., VasireddyVenkatadri Institute Of Technology Nambur, AP-India
Mail:
[email protected]
1; [email protected]
2Abstract
The IEEE802.11a standard uses Orthogonal Frequency Division Multiplexing (OFDM). It can provide data rate up to 54 Mbps in Wireless Local Area Networks (WLAN’s). This standard is used in indoor applications as well as in vehicles i.e. mobile environments. In this paper, we evaluate Bit Error Rate (BER) by changing the number of pilots such as 2 4 6 8 velocity and b.e.r is graphed using multiple modulation schemes such as QPSK, and 256QAM. The overall simulation has been performed using MATLAB as the simulation tool.
Keywords: IEEE 802.11a; WAVE; Wireless Access for
the Vehicular Environment; wireless LAN;
mobile/wireless systems for transportation; experimental performance
I. INTRODUCTION
The application space for to-vehicle and vehicle-to-roadside communication is vast. Uses range from toll collection, through intersection collision avoidance, to Obtaining up-to-date traffic information. As a
consequence, various different communications
technologies have been proposed for enabling this new generation of sentient vehicles. These include the various versions of the IEEE 802.11 standard, as well as the 802.20 Mobile Broadband for Wireless Access (MBWA) standard, and the 802.16e Mobile WiMAX draft. In the United States, the Dedicated Short Range
Communication (DSRC) standard for vehicular
communication will utilize 802.11p Wireless Access for Vehicular Environments (WAVE) technology, which is very similar to the 802.11astandard. The former will utilize spectrum at 5.9 GHz, whilst the latter exists in the 5.2 GHz range. Hence, evaluation of802.11a hardware, which is widely available, will yield a good indication of
the performance of forthcoming DSRC devices.The
IEEE 802.11a protocol [8] differs from the
802.11b“WiFi” protocol in both the frequency range used and the multiplexing scheme. Whilst the former uses Orthogonal Frequency Division Multiplexing, the latter uses Direct Sequence Spread Spectrum techniques in the 2.4 GHz band. Maximum data rates are quoted as 54 Mbps and 11 Mbps respectively,802.11a achieving substantially higher throughput in part due to offering 64-QAM modulation.
In practice, data rates achieved at higher protocol layers are lower than those given above, as the overhead of encapsulation is significant. For example, a TCP or UDP packet must be placed in an IP datagram, and subsequently in a MAC layer frame for output by the radio transmitter. Hence, maximum UDP data rates for 802.11a are in the region of 30 Mbps.
II. RELATED WORK
c e-ISSN: 2348-6848, p- ISSN: 2348-795X Volume 2, Issue 12, December 2015
International Journal of Research (IJR)
Available at http://internationaljournalofresearch.org
and packet size are further examined. Work has also been carried out analysing the theoretical and practical performance for intervehicular networks. This again has centred around IEEE 802.11b, mostly in motorway environments.The Drive-Thru Internet project has analysed these environments in detail,and proposed a disconnection-tolerant architecture that is optimized for such short-lived connections.
The performance of the DSRC standard has also been simulated. The results suggest that delays are highly variable, contingent on whether there is line of sight communication, and the transmission range (assuming that a lower range implies multipath components cannot be resolved,
resulting in frequency flat-fading). The Bit Error Rate (BER) is found, by simulation, to vary significantly with the relative speed of the transmitter and receiver. High vehicle speeds mean that the channel characteristics may change in the middle of a packet transmission, which increases the BER as training sequences only exist at the start of each packet.
Previous work has mostly taken place under desert or test track conditions, at high speeds. Our work differs from these in that it analyses the “a” version of 802.11 in a realistic urban environment at low (<50 km/h) speeds. These velocities are particularly important as they are the norm in a congested urban environment, where there is likely to be the greatest density of access points. It is also the case that in cities users are more likely to require extra information to be downloaded to their vehicles, such as more detailed map or traffic information.
Fig. 1. Throughput for two oppositely-directed passes of n 802.11a AP at 7 km/h at 10 Mbps
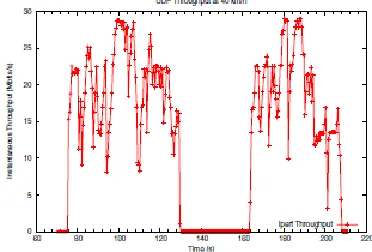
Fig. 2. Throughput for two oppositely-directed passes of an 802.11a AP at 45 km/h at 10 Mbps
Fig. 3. Throughput for two oppositely-directed passes of an 802.11a AP at 7 km/h at 30 Mbps
Fig. 4. Throughput for two oppositely-directed passes of an 802.11a AP at 45 km/h at 30 Mbps
III. EXPERIMENTAL SET-UP
c e-ISSN: 2348-6848, p- ISSN: 2348-795X Volume 2, Issue 12, December 2015
International Journal of Research (IJR)
Available at http://internationaljournalofresearch.org
band. All tests were performed using the iperf1 network measurement tool, with the server being the laptop with the 802.11a
PCMCIA card, and the client connected to the access point. In each test UDP datagram’s of 1470 bytes in size were transmitted from the client to the server, and the average throughput (of uncorrupted packets received by the server) for each 0.5 second interval calculated. The two attempted throughputs (i.e.,the rate at which the client sent packets to the access point) were 10 and 30 Mbps.
The reasons for using UDP, and not TCP were:
• TCP infers congestion from packet loss and scales back its send window accordingly. For these experiments, the aim was to ascertain how throughput is affected by the wireless propagation characteristics of the channel, rather than due to protocol-induced throughput reductions.
• TCP uses an ARQ mechanism to retransmit lost packets, causing the sending of normal data to cease temporarily. Again, the desire was to analyze the performance of the underlying data-link layer rather than ARQ-based protocols being carried over it.
• Although TCP is used for many network applications, the majority of transmissions of vehicles are likely to be broadcast, best-effort streams (e.g., traffic updates). For tests of performance at varying speeds, the access point was placed on a metal stepladder, at a height of approximately 1.8 meters above the road, with the laptop connected to it by 3 meters of Ethernet cable. The access point’s antenna was placed with its largest face orthogonal to the direction of the road, to achieve the best possible propagation characteristics. The laptop acting as the server was placed inside a small van, and the antenna externally attached to the roof rack. The test environment was a straight, two-lane road, with low levels of traffic. There are few buildings close to the road, and these are only on one side, with the other being bounded by fields. The distance between the start and end points of each drive past the access point was approximately 460 meters, with the access point being placed in a lay-by 270 meters from one end. The end points were chosen such that the vehicle was out of wireless coverage when it reached the extremes.
IV. PERFORMANCE AT LOW SPEEDS
We performed a large number of experiments assessing the performance of a connection from a moving vehicle to an access point beside the road, concentrating on two speeds, 7km/h and 45 km/h. The former is characteristic of a heavily congested inner city road and the latter of a similar road in a free flow situation. The speeds were kept as constant as possible using the vehicle’s speedometer, and were verified using an onboard GPS unit. The results from two sample runs at an attempted UDP throughput of 10 Mbps are shown2 in Figures 1 and 2, whilst those for 30 Mbps are shown in Figures 3 and 4.
At 10 Mbps there is no difference in the throughput at the two speeds, with both traces showing that the throughput is either zero or approximately 100% of that attempted3. In contrast, at 30 Mbps the connection is less “binary”, and exhibits a much greater variability in throughput at 7 km/h.
A. Throughput Variability
For many multimedia applications, such as Voice over IP, not only is total data transmitted or received important, but also the variability of the throughput over the lifetime of the connection. Figures 5 to 8 show histograms of the throughputs achieved at the two test speeds, with attempted throughputs of 10 and 30 Mbps.
The variation in throughput when using 30 Mbps can be attributed to the modulation scheme used to be 64-QAM, rather than QPSK, for 10 Mbps. The former is more sensitive to interference, and hence more likely to incur a packet loss for a given amount of noise.
B. Null Zones
When the receiver antenna is in a null zone a greater proportion of packets are lost than when it is not. This will therefore affect the performance of a wireless connection at low speeds for a vehicle passing an access point. The propagation environment, and hence the number and position of null zones, will only be affected by how the objects in the area are positioned and the frequency of transmission, (provided that there is no time-varying RF interference). Hence, for any vehicle speed, we can say that the range of the AP is constant, and that the number and total length of the null zones within that coverage area is also fixed. Therefore, as speed increases the total time spent in null zones decreases. This therefore means that the absolute packet loss decreases at the expense of less time being spent in the fixed-length coverage region. Reduced packet loss implies a greater average throughput, and hence a greater transfer size. Hence, it is important to ascertain how the spread of throughputs changes with different vehicle speeds.
C. Connection Times
The tables I and II summarizes the data from more extensive experiments, only subsets of which are presented in graphical format in the figures in this paper. All data given in the tables are derived using the following criteria:
c e-ISSN: 2348-6848, p- ISSN: 2348-795X Volume 2, Issue 12, December 2015
International Journal of Research (IJR)
Available at http://internationaljournalofresearch.org
this interruption would therefore have made the results meaningless. The cause of such interruptions may be due to occasional
Shadowing of the access point by other vehicles.
• Zone 2 is defined as the time period, regardless of interruption, that the connection’s achieved throughput was greater than 10% of the attempted send rate.
• Zone 3, sporadic connectivity, is similar to zone 2, save that any achieved throughput above zero may be counted.
The data given, are all the mean connection times, with their corresponding standard deviations, in seconds.
D. Antenna Positioning
There appeared to be no significant effect due to the position of the antenna on the vehicle, confirming the results reported, Two locations were used, one at the front of the vehicle nearest the passenger side, attached to the roof rack, and the other diametrically opposite, on the back roof rack.
V. Simulation Results
Inputs to the design are provided by Matlab coding and are as shown in Fig1. , Fig. 2 represent BER with varying pilot signals to obtain QPSK modulated signal& QAM. Fig. 3 represents the BER vs. Velocity of QPSK& QAMmodulated signal. Fig. 4, Fig.5, Fig.6, represents the comparison signal for QAM & QPSK scheme.
0 5 10 15 20 25 30 35
96 96.5 97 97.5 98 98.5 99
Signal to Noise Ratio, dB
B it s u c e s s R a te i n %
BER WITH VARYING PILOTS 256QAM
2pilots 4pilots 6pilots 8pilots
0 5 10 15 20 25 30 35
93 94 95 96 97 98 99
Signal to Noise Ratio, dB
B it S u c e s s R a te i n %
BER WITH VARYING PILOTS 256PSK
2pilots 4pilots 6pilots 8pilots
20 30 40 50 60 70 80 90
0 0.005 0.01 0.015 0.02 0.025 0.03 0.035
Velocity in Km/Hr
BER
BER Vs Velocity
SNR=13 SNR=7 SNR=5 SNR=3
0 5 10 15 20 25 30 35
97 97.2 97.4 97.6 97.8 98 98.2 98.4 98.6 98.8
Signal to Noise Ratio, dB
B it s u c e s s R a te i n %
BER WITH VARYING PILOTS 256QAM VS 256PSK
2pilotsQAM 2pilotsPSK
0 5 10 15 20 25 30 35
96 96.5 97 97.5 98 98.5
Signal to Noise Ratio, dB
B it s u c e s s R a te i n %
BER WITH VARYING PILOTS 256QAM VS 256PSK
c e-ISSN: 2348-6848, p- ISSN: 2348-795X Volume 2, Issue 12, December 2015
International Journal of Research (IJR)
Available at http://internationaljournalofresearch.org
VI. CONCLUSION
We shown the results of an evaluation of the Performance of the IEEE 802.11a wireless networking standard. In particular, we have shown that at low speeds, a vehicle passing an access point will experience a greater variation in throughput than that at higher speeds due to the effect of null zones in the propagation environment. This is important when considering performance in urban environments, where there is likely to be a greater density of wireless deployment than motorway scenarios. We have also outlined how connection times are not directly proportional to the speed of travel, but instead are also dependant on the association time. Our current work is focusing on improving the performance of 802.11a by utilizing more than one receiving antenna, to negate the effect of null zones.
REFERENCES
[1] AMI-C. AMI-C use cases. Technical Report 1001, AMI-C, January2003.
[2] P. Bergamo, D. Maniezzo, K. Yao, M. Cesana, G. Pau, M. Gerla, andD. Whiteman. IEEE 802.11 wireless network under aggressive mobilityscenarios. In Proc. International Telemetry
Conference, October 2003.
[3] Jonathan J. Davies, David N. Cottingham, and Brian D. Jones. A sensorplatform for sentient transportationresearch. In
Proc. 1st EuropeanConference on Smart Sensing and Context,
volume LNCS 4272, pages226–229, October 2006.
[4] A. Ebner, H. Rohling, L. Wischhof, R. Halfmann, and M. Lott.Performance of UTRA TDD ad-hoc and IEEE 802.11b in vehicularenvironments. In Proc. IEEE VTC, April 2003.
[5] R. Gass, J. Scott, and C. Diot. Measurements of in-motion 802.11networking. In Proc. IEEE WMCSA, 2006.
0 5 10 15 20 25 30 35
94.5 95 95.5 96 96.5 97 97.5 98 98.5 99
Signal to Noise Ratio, dB
B
it
s
u
c
e
s
s
R
a
te
i
n
%
BER WITH VARYING PILOTS 256QAM VS PSK