MULTIPLE PERFORMANCE MEASUREMENT AND MANAGEMENT SYSTEMS IN AUSTRALIAN BUSINESS ORGANISATIONS
BY
ZDENKO MIHOLCIC
A THESIS SUBMITTED TO THE GRADUATE SCHOOL OF BUSINESS
VICTORIA UNIVERSITY
IN PARTIAL FUFILLMENT OF THE REQUIREMENTS FOR THE DEGREE OF
THESIS
658.40130994 MIH 30001008803753 Miholcic, zdenko Multiple performance
Abstract
There has been widespread adoption of the performance measurement and management systems (PMMS) including both financial and non-financial measures. Despite the literature advocating the benefits of PMMS, the empirical work is insufficient, and the synthesis of the findings is minimal. Based on the findings of prior case studies, survey research, and the normative guidelines about the design and implementation of the multiple perspectives performance measurement and management systems (PMMS), mainly the Balanced Scorecard, a questionnaire-based study was conducted to explore PMMS on the following: (1) types and extent of PMMS benefits; and (2) identification and evaluation of primary determinants of PMMS success, and complementary organisational, PMMS champion, use and design determinants. Responses were received from 135 business organisations, listed on the Australian Stock Exchange.
The research clearly identifies the usefulness of PMMS in strategic uses and financial improvements, and demonstrates wide use of PMMS in business functions and processes. The relevance of twenty-nine itemised primary determinants of PMMS
I, Zdenko Miholcic, declare that the DBA thesis entitled Multiple performance
measurement and management systems in Australian business organisations is no
more than 65,000 words in length, exclusive of tables, figures, appendices, references and footnotes. This thesis contains no material that has been submitted previously, in whole or in part, for the award of any other academic degree or diploma. Except where otherwise indicated, this thesis is my own work.
Acknowledgements
Table of contents
Chapter 1 Introduction 1
1.1 Emergence of PMMS 1 1.2 Rationale for research 2 1.3 Contribution to knowledge 4
1.4 Research aims 6 1.5 Overview of the dissertation 8
Chapter! Literature Review 9
2.1 OperationalisationofthePMMS 9
2.1.1 Introduction 9 2.1.2 PMMS frameworks 11
2.2 Success factors and barriers to PMMS design and implementation 22
2.2.1 hitroduction 22 2.2.2 Success factors 23 2.2.3 PMMS Barriers 34 2.3 Complementarities to PMMS outcomes 48
2.3.1 hitroduction 48 2.3.2 Size of organisation 49
2.3.3 PMMS design factors 50 2.3.4 PMMS use factors 68 2.3.5 PMMS champion characteristics 71
2.4 PMMS as strategic management systems 72
2.4.1 Introduction 72 2.4.2 Strategy uses of PMMS ^ 76
2.5 Summary 84
Chapter 3 Research design and method 86
3.1 Infroduction 86 3.2 Sampling procedure 86
3.3 Data collection 93 3.4 Development and validation of questionnaire measures 98
3.4.2.1 Determinants of PMMS success 105 3.4.2.2 Complementarities to PMMS success 108
3.4.3 Overview of variables 112 3.5 Validation of variables 113 3.5.1 Preliminary validation 113 3.5.2 Variability and discriminant rehability 114
3.5.3 Construct reliability 119 3.5.4 Autocorrelation effect 124 3.6 Selection of statistical techniques and tests 125
3.6.1 Introduction 125 3.6.2 Establishing the relevance of PMMS success determinants and benefits 127
3.6.3 Establishing the correlations between PMMS determinants and benefits 128
3.6.4 Identification of PMMS complementarities 132 3.6.4.1 Identification of binary complementarity 134 3.6.4.2 Identification of complementarities with three or more groups 134
Chapter 4 Findings and Discussion 138
4.1 Determination of PMMS success factors, barriers and benefits relevance 138
4.1.2 PMMS success factors 138
4.1.3 PMMS barriers 140 4.1.4 PMMS use for strategic purposes 142
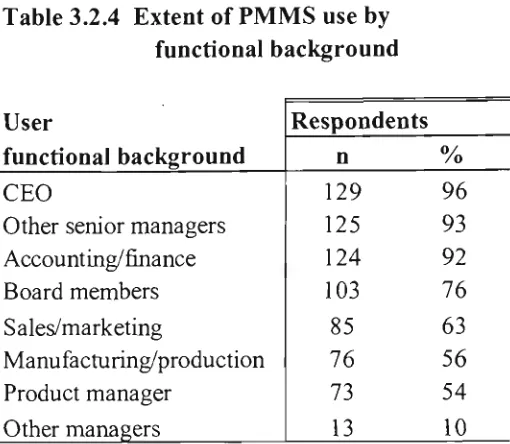
4.1.5 Extent of PMMS use by various users 143 4.1.6 PMMS use in specific decision areas 144 4.1.7 Extent of dollar improvements 145 4.2 Correlations between PMMS success factors, barriers and benefits 146
4.2.1 Overview of the section 146 4.2.2 Item-to-item correlations 147 4.2.3 Correlations between PMMS success factors and PMMS benefits 151"
4.2.4 Correlations between PMMS barriers and PMMS benefits 163
4.2.5 Summary of findings 172
4.3.5 Summary of findings 216
Chapters Concluding remarks 220
5.1 Contribution to knowledge 220
5.2 Limitations of the study 231
5.3 Recommendations for future research 233
REFERENCE LIST 234
Appendices
Questionnaire
Survey letter
List of Tables
1.4.1 Constructs, variables and hypotheses ^ 2.3.3.1 Employee and Executive Scorecards 64 2.4.2.1 Non-Financial Factors Used by Investors 81 3.2.1 Industry difference between population and sample ^^
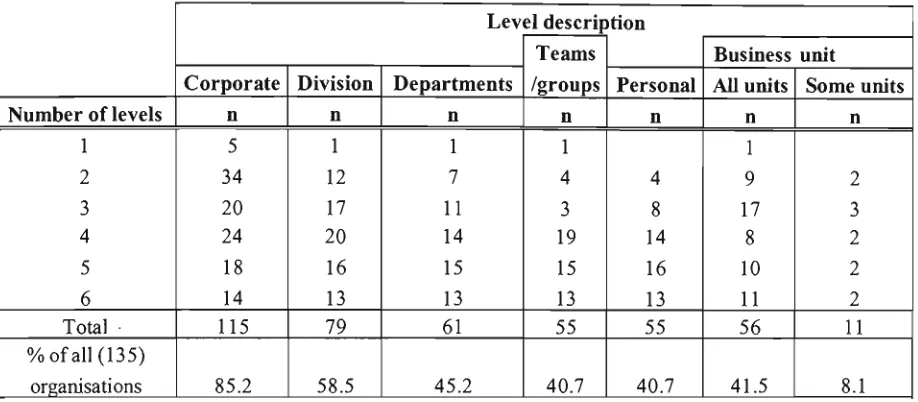
3.2.2 Distribution of PMMS used by organisational level 91
3.2.3 Extent of PMMS use for strategic purposes 91 3.2.4 Extent of PMMS use by functional background 92 3.4.1.1 Rangesof composite dependent variables ^^^ 3.4.1.2 Correspondence between items in variable 'Extent of dollar
improvements' 104 3.4.2.1 Ranges of composite independent variables 106
3.4.3.1 Constructs and variables 112 3.5.2.1 Variability of scores of'Satisfaction with PMMS use for strategic
purposes' 115 3.5.2.2 Variability of scores of'Satisfaction with PMMS use in specific business
decision areas' 116 3.5.2.3 Variability of scores of'Extent of PMMS attributed dollar improvements' 116
3.5.2.4 Variability of scores of'Extent of PMMS use by users of various
managerial and functional background' 117 3.5.2.5 Variability of scores of'Importance of PMMS success factors' 118
3.5.2.6 Variability of scores of'Importance of PMMS barriers' 118 3.5.3.1 Item - total statistics of variable 'PMMS use for strategic purposes' 120
3.5.3.2 Item-total statistics ofvariable'PMMS user functional background' " 121 3.5.3.3 Item - total statistics ofvariable 'PMMS use in specific decision areas' 121 3.5.3.4 Item - total statistics ofvariable 'PMMS attributable dollar improvement' 122
3.5.3.5 Item - total statistics ofvariable 'PMMS success factors' 123
3.5.3.6 Item - total statistics of variable'PMMS barriers' 124 3.5.4.1 Correlations between PMMS benefits variables 125
3.5.4.2 Interpretation of correlation coefficients 125 3.6.4.1 PMMS complementarities and statistical tests 133
4.1.2.2 PMMS success factors ranking by number of years PMMS in use with Jonckheere-Terpstra test, pairwise comparison, and coefficient of
determination 140 4.1.3.1 Importance of PMMS barriers 141
4.1.3.2 PMMS barriers ranking by number of years PMMS in use with Jonckheere-Terpstra test, pairwise comparison, and coefficient of
Determination 141 4.1.4.1 Satisfaction with PMMS use for strategic purposes 143
4.1.5.1 Extent of PMMS use by fimctional background 144
4.1.6.1 Satisfaction with PMMS decision areas 145 4.1.7.1 Extent of PMMS dollar improvements 146 4.2.3.1 Correlation between 'PMMS success factors' and 'PMMS use for
strategic purposes' 152 4.2.3.2 Ranges of composite variables 'PMMS use for strategic purposes',
'PMMS success factors', and correlations at low, middle and high
section 153 4.2.3.3 Correlation coefficients of PMMS success factors and PMMS strategic
purposes satisfaction 154 4.2.3.4 Correlation between 'PMMS success factors' and 'PMMS use by users of
various functional and managerial background' 155 4.2.3.5 Ranges of composite variables 'Extent of PMMS use by various users',
'PMMS success factors', and correlations at low, middle and high
section 157 4.2.3.6 Correlation coefficients of PMMS success factors importance and extent
of PMMS use 157 4.2.3.7 Correlation between 'PMMS success factors' and 'PMMS use in specific
business decision areas' 158 4.2.3.8 Ranges of composite variables 'Decision areas supported by PMMS',
'PMMS success factors', and correlations at low, middle and high
section 159 4.2.3.9 Correlation coefficients of PMMS success factors importance and
4.2.3.11 Ranges of composite variables 'Extent of dollar improvements', 'PMMS success factors', and correlations at low, middle and high
section 162 4.2.3.12 Correlation coefficients of PMMS success factors importance and
extent of PMMS attributed dollar improvements 162 4.2.4.1 Correlation between 'PMMS barriers' and 'PMMS use for strategic
purposes' 163 4.2.4.2 Ranges of composite variables 'PMMS use for sti*ategic purposes',
'PMMS barriers', and correlations at low, middle and high section 165 4.2.4.3 Correlation coefficients of PMMS barriers importance and PMMS
strategic purposes satisfaction 165 4.2.4.4 Correlation between 'PMMS barriers' and 'PMMS use by users of
various functional and managerial background' 166 4.2.4.5 Ranges of composite variables 'Extent of PMMS use by various users',
'PMMS barriers', and correlations at low, middle and high section 167 4.2.4.6 Correlation coefficients of PMMS barriers importance and PMMS use 167 4.2.4.7 Correlation between 'PMMS barriers' and 'PMMS use in specific
business decision areas' 168 4.2.4.8 Ranges of composite variables 'Decision areas supported by PMMS',
'PMMS barriers', and correlations at low, middle and high section 169 4.2.4.9 Correlation coefficients of PMMS barriers importance and specific
PMMS decision areas satisfaction 170 4.2.4.10 Correlation between 'PMMS barriers' and 'PMMS attributed dollar
improvement' 171 4.2.4.11 Ranges of composite variables 'Extent of dollar improvements',
'PMMS barriers', and correlations at low, middle and high section 171 4.2.4.12 Correlation coefficients of PMMS barriers importance and PMMS
attributed extent of dollar improvements 172 4.2.5.1 Overview of correlations {r&) between composite variables 173
4.2.5.2 Overview of correlations at 'Low', 'Middle', and 'High' ranges of dependent
variables 174 4.2.5.3 Overview of item-to-item correlations 174
4.3.1.3 PMMS success dimensions ranking by industry with Kmskal-Wallis Test,
pairwise comparisons, and coefficients of determination 178 4.3.1.4 Organisation distribution by number of employees 179 4.3.1.5 PMMS success dimensions ranking by number of employees with
Jonckheere-Terpstra test, pairwise comparisons, and coefficients
of determination 180 4.3.1.6 Organisation distribution by market capitalization 181
4.3.1.7 PMMS success dimensions ranking by market capitalisation with
Jonckheere-Terp stra test 181 4.3.2.1 Distribution of PMMS by type 183
4.3.2.2 Other PMMS systems 184 4.3.2.3 PMMS success dimensions ranking by PMMS type with Kruskal-Walhs
Test, pairwise comparison, and coefficient of determination 185
4.3.2.4 Distribution of PMMS by number of perspectives 186 4.3.2.5 t test for equality of mean number of PMMS perspectives 187
4.3.2.6 Distribution of PMMS perspectives by industry 188 4.3.2.7 Distribution of PMMS perspectives by number of employees 189
4.3.2.8 Distribution of PMMS perspectives by market capitalization 190
4.3.2.9 Distribution of perspectives by PMMS type 191 4.3.2.10 Distribution of perspectives by time PMMS in use 192
4.3.2.11 PMMS success dimensions ranking by number of performance areas with Jonckheere-Terpstra test, pairwise comparisons, and coefficients
of determination 194 4.3.2.12 Distribution of PMMS perspectives with mode ranges 195
4.3.2.13 Distribution of no. of measures by PMMS perspectives 196 4.3.2.14 PMMS success dimensions ranking by number of financial measures
with Jonckheere-Terpstra test, pairwise comparisons, and
coefficients of determination 197 4.3.2.15 PMMS success dimensions ranking by number of customer measures
with Jonckheere-Terpstra test, pairwise comparisons, and
coefficient of determination 198 4.3.2.16 PMMS success dimensions ranking by number of process measures
4.3.2.17 PMMS success dimensions ranking by number of learning and
innovation measures with Jonckheere-Terpstra test 199 4.3.2.18 PMMS success dimensions ranking by number of other measures
with Jonckheere-Terpstra test 1 ^^
4.3.2.19 Use of other performance measures 200 4.3.2.20 Distribution ofPMMS by source of software 201
4.3.2.21 PMMS success dimensions ranking by PMMS software source with
Kruskal-Wallis Test 202 4.3.2.22 Respondent distribution by type of causal link 203
4.3.2.23 PMMS success dimensions ranking by type of causal link between drivers and outcomes with Kruskal-Wallis Test, Jonckheere-Terpsti-a
Test, pairwise comparisons, and coefficients of determination 204
4.3.3.1 Respondent distribution by time PMMS in use 205 4.3.3.2 PMMS success dimensions ranking by number of years PMMS used,
Jonckheere-Terpstia test, pairwise comparisons, and coefficients of
determination 206 4.3.3.3 Respondent distribution by status of PMMS use 207
4.3.3.4 PMMS success dimensions ranking by organisation PMMS status with Jonckheere-Terpstra test, pairwise comparisons, and coefficients of
determination 207 4.3.3.5 PMMS success dimensions ranking by number of organisational levels
at which PMMS is used, Jonckheere-Terpstra test, pairwise
comparisons, and coefficients of determination 208 4.3.3.6 PMMS success dimensions ranking by organisation use of management
tools, Jonckheere-Terpstra test, pairwise comparisons, and coefficients
of determination 209 4.3.4.1 PMMS success dimensions ranking by type of respondent position with
Kruskal-Wallis Test, pairwise comparisons, and coefficient of
determination 211 4.3.4.2 PMMS success dimensions ranking by type of respondent primary area
of expertise with Kruskal-Wallis Test 212 4.3.4.3 PMMS success dimensions ranking by type of respondent current
position tenure with Jonckheere-Terpstra Test, pairwise comparisons,
4.3 A A PMMS success dimensions ranking by type of respondent organization
tenure with Jonckheere-Terpstra Test 214 4.3.4.5 PMMS success dimensions ranking by respondent formal responsibility
for performance measurement and Mann-Whitney Test 214 4.3.4.6 PMMS success dimensions ranking by respondent level of education
with Jonckheere-Terpstra test, pairwise comparisons, and
coefficients of determination 215 4.3.4.7 Respondent postgraduate qualification 216
4.3.5.1 Overview of organisation complementarities to PMMS benefits
withrj values 217 4.3.5.2 Overview of PMMS design complementarities to PMMS benefits
withri values 217 4.3.5.3 Overview of PMMS use complementarities to PMMS benefits
with ri"^ values 218 4.3.5.4 Overview of respondent complementarities to PMMS benefits
List of Figures
2.1.2.1 Balanced Scorecard ^3 2.1.2.2 Causal links in the Balanced Scorecard
2.1.2.3 Performance Pyramid diagram ^0 2.1.2.4 Results and Determinants Framework ^ ^
2.1.2.5 Performance Measurement Matrix 22 2.3.3.1 Cause and effect relationships in the Balanced Scorecard 52
2.3.3.2 Example of a strategy map ^4 2.3.3.3 Employee and Executive Scorecards 64
2.4.1.1 Balanced Scorecard as a Strategic Management System 75 4.2.3.1 Scattergram of 'PMMS use for strategic purposes' and 'PMMS success
factors' 152 4.2.3.2 Scattergram of 'PMMS use by users of various functional and managerial
background' 'PMMS success factors' 156 4.2.3.3 Scattergram of'PMMS use in specific decision areas' and 'PMMS success
factors' 159 4.2.3.4 Scattergram of'PMMS dollar improvements' and 'PMMS success factors' 161
4.2.4.1. Scattergram of 'PMMS use for stiategic purposes' and 'PMMS barriers' 164 4.2.4.2 Scattergram of'PMMS use by users of various functional and managerial
background'and'PMMS barriers' 166 4.2.4.3 Scattergram of'PMMS use in specific decision areas' and 'PMMS
barriers' 169 4.2.4.4. Scattergram of 'PMMS dollar improvements' and 'PMMS barriers' 171
4.3.2.1 Distribution of no. of PMMS perspectives by industry 188 4.3.2.2 Distribution of no. of PMMS perspectives by no. of employees 189
4.3.2.3 Distribution of no. of PMMS perspectives by market capitalisation 190
4.3.2.4 Distiibution of no. of PMMS perspectives by PMMS type 192 4.3.2.5 Distiibution of no. of PMMS perspectives by time PMMS in use 193
Chapter 1 Introduction
1.1 Emergence of PMMS
Substantial changes, often characterized as 'revolutionary' (Eccles, 1991), in methods of performance measurement and management have occurred during the past decade, resulting in enormous development of methods of management control based on non-financial performance measurement. It is held in almost universal agreement among researchers that, to a considerable degree, these changes have been driven by changes in the business environment, resulting in increased globalisation and stiffening competition (Kald and Nillson, 2000; Chenhall and Langfield-Smith, 1998a; Kaplan and Norton, 1996c). Increased competition is forcing companies to review ways of becoming more efficient and effective. These challenges have imposed new demands on business, including broader product lines, higher quality, on-time delivery, and lower prices. As a consequence, companies have increased their investment in research and development, new technology, and new processes (Kaplan and Norton, 1996c; Bromwich and Bhimani,
1994).
encompassing a wide range of concepts and frameworks. Organisations were prompted to expand the measures used to evaluate execution of business strategy, and to complement traditional measurement practices. This has led to increased recognition of customer, employee, process, and other non-financial measures, and their relevance tor organisational performance, and to the development and design of the 'Balanced Scorecard' and other systems and frameworks of integrated financial and non-financial measures (Ittner and Larcker, 2000).
In recent years, the topics of non-financial organisational performance measurement and management in general and the Balanced Scorecard in particular have been frequently discussed in the professional and academic literature. At this point of time, the idea of the Balanced Scorecard, set forth and developed by Kaplan and Norton (1996a,b,c, 1993,
1992) has gained significant acceptance in managerial circles in a number of countries. Estimates have put the number of the 1000 largest listed companies in the U.S.A, using the Balanced Scorecard, to approximately 60 percent (Silk, 1998), and the worldwide estimate by Rigby (2001) was 44 percent.
On the supply side, these changes have been paralleled by a proliferation of theoretical concepts, models, and frameworks, and subsequent commercialization of innovative management tools and software packages, by management consultants, software developers, conference organisers and other vendors. The topic has become increasingly prominent in popular managerial press, and has been promoted and discussed on numerous internet sites. The Balanced Scorecard computer packages and similar systems are provided by several jsoftware vendors, who also may provide training and other consultancy services related to the installation and maintenance of their systems.
1.2 Rationale for research
comprising several non-financial performance perspectives populated with various measures of performance, in addition to fraditional financial measures. An increasing number of organisations have adopted performance measurement systems with non-fmancial metrics, such as Telsfra, Carter Holt Harvey, Australia Post, Westpac, Australian Central Credit Union, Unilever Foods, BASF, ATSIC, Colgate-Palmolive, Bicentennial Park, Sydney Theatre Company (Creating the Strategy-focused Organisation with the Balanced Scorecard, conference, 2000), Ansett Australia, Meadow Lea Foods, Qantas Airways, Ericsson Australia, Nestle, AMP Society, TNT Australia, St George Bank, Amotts, Uncle Toby's, National Mutual, Commonwealth Bank, Toll Logistics, Whirlpool Australia, Western Power Corp, Zurich, Polygram Ausfralia, KPMG, NCR Australia, O'Brien Glass, Integral Energy, Ampol, CSR Emoleum, DHL Intemational, ICI Pharmaceuticals, Pioneer International, Citibank, Orica and CSR (Watty, 2001; How to use the Balanced Scorecard as a Strategic Management System, conference, 1998)
High rates of adoption of the Balanced Scorecard and other similar non-financial systems in a variety of settings, including corporate, governmental, non-profit and other organisations, have been reported (Walsh, 2000). PMMS are being widely deployed throughout industry, government, and other types of institutions. Applications within business organisations proliferate (Hoque and James, 2000; Chenhall and Langfield-Smith, 1999a & b; 1998a & c), and many organisations have now developed PMMS across various organisational processes and managerial levels.
business organisations, except for the universally acknowledged survey studies by Chenhall and Langfield-Smith (1998a & c) and Hoque and James (2000).
Despite the case studies and conferences promoting the virtues and alleged benefits or PMMS, the literattire is fragmented, and weighs heavily towards anecdotes and conceptual frameworks, with insufficient empirical work and minimal synthesis ot fmdings. As the number of organisations implementing PMMS increases and applications within organisations proliferate, identification and empirical confirmation of the determinants and the complementary factors important to success becomes essential.
1.3 Contribution to knowledge
and implementation of innovative management accounting systems, including the Balanced Scorecards and key performance indicators, in five manufacturing companies.
As noted by several authors (Chenhall, 2004; Davis and Albright, 2004; Ittner and Larcker, 1998b), very few studies have attempted to provide the objective evidence of the impact of the PMMS on the 'bottom line' and other organisational outcomes, that is, the causal relationship has not been documented and elaborated upon. In Australia, the Balanced Scorecard software vendors (Penny, 1998) have so far delivered only one presentation paper on calculating the actual financial retums from implementing the Balanced Scorecard, which is conspicuously insufficient given that the Balanced Scorecard packages have been intensely promoted and solicited for the last nine to ten years. Conference and seminar presenters have elaborated on an array of other Balanced Scorecard aspects.
Despite "the balanced scorecard buzz, propelled by the ceaseless proselytising of its creators" (Schatz, 2000, p.40) and numerous consulting firms, apart from the studies mentioned in the preceding paragraphs, no other systematic critical analyses of the PMMS efficiency in Ausfralian organisations have been conducted so far. Consequently, existing literature provides little evidence of a relationship between the use of PMMS and changes in organisational performance. Thus, by achieving the aims of the research, an original contribution to the body of knowledge on the PMMS has been made.
level. The broad research objectives were to carefully evaluate the benefits of PMMS, to better understand the factors related to success or failure when applying the PMMS, and to ascertain why some organisations are more successful than others with rMM applications.
1.4 Research aims
The primary aim of the research was to systematically identify and empirically test and evaluate the comprehensive set of determinants, i.e., the success factors and barriers, of PMMS benefits in Ausfralian business organisations. The likely determinants and PMMS benefits were identified in the literattire. This sttidy draws from several bodies of literature, predominantiy the general normative and prescriptive literature on the design and implementation of tiie Balanced Scorecard, and other PMMS concepttial frameworks, and, to a lesser extent, case studies and survey-based empirical investigations. Data on primary determinants and benefits of PMMS were collected from a national survey of top 500 organisations listed on the Ausfralian Stock Exchange, and were used to ascertain the actual relevance and extent of identified determinants and benefits, as well as the degree of association between the determinants and benefits.
In addition, the broad set of data on the design and use of PMMS was collected, to illusfrate the PMMS practices, and to investigate any differences in the extent of benefits that may be associated with the different PMMS structures and applications, and with the use of other innovative managerial tools. The differences in perceived benefits were also investigated on the basis of the demographic information on the respondents and their organisations.
characteristics. Based on the findings by Hoque and James (2000), the size of organisation was assumed to be positively associated with the extent of PMMS benefits, and the variables of size were correlated with the PMMS benefits grouped into four distinct variables. Time in use of PMMS was also assumed to be positively correlated with the PMMS benefits. Direction of association between the primary determinants of PMMS benefits and the PMMS benefits was determined in accordance with the broad character of particular determinants, such that all success factors were assumed to be positively associated with the PMMS benefits, and all PMMS barriers negatively.
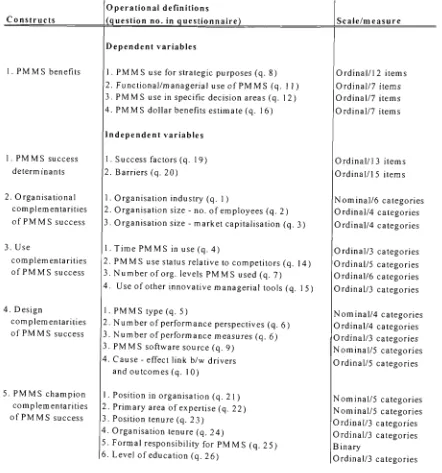
The entire set of the primary determinants of PMMS benefits, and other potential factors effecting the extent of PMMS benefits, as well as PMMS benefits, is presented in Table
1.4.1, as are the directions of the tested hypotheses.
Table 1.4.1 Constructs, variables and hypotheses
Constructs
1. PMMS benefits
1. PMMS success determinants 2. Organisational
complemaitarities of PMMS success 3. Use
compl emraitarities of PMMS success 4. Design
complementarities of PMMS success
5. PMMS champion complementarities of PMMS success
Operational defmitions
Dependent variables
1. PMMS use for strategic purposes 2. Functional/managerial use of PMMS 3. PMMS use in specific decision areas 4. PMMS dollar benefits estimate
Independent variables
1. Success fectors 2. Barriers
1. Organisation industry
2. Organisation size - no. of employees 3. Organisation size - market capitalisation 1. Time PMMS in use
2. PMMS use status relative to competitors 3. Number of org. levels PMMS used 4. Use of other innovative managerial tools 1. PMMS type
2. Number of performance perspectives 3. Number of performance measures 3. PMMS software source 4. Cause - effect link b/w drivers
and outcomes 1. Position in organisation 2. Primary area of expertise 3. Position tenure 4. Organisation tenure
5. Formal responsibility for PMMS 6. Level of education
Direction of research hypothesis (association b/w independent and dependent variable)
1.5 Overview of the dissertation
Chapter 2 Literature Review
2.1 OperationalisationofthePMMS
2.1.1 Introduction
The baseline definition of the PMMS in this study refers to systems that comprise a set of performance measures that are multi-dimensional (Kennerley and Neely, 2002), with at least one performance measurement area, in addition to the financial measures and indicators. Such a definition corresponds to the concept of "a mixture of financial and non-financial measures" (Kaplan and Norton, 2001a, p. 94), or "collections of financial and non-financial measures organized into three to five perspectives" (Kaplan and Norton, 2001a, p. 97). Such 'measurement diversity' is characterized by the supplementary, rather than integrative, use of the non-financial measures. The approach was identified in the early works of Kaplan and Norton (1993, 1992), by Ittner et al. (2003), and has been categorized as 'key performance indicators', or 'key result areas' by Chenhall and Langfield-Smith (1999a & b). A more complete definition has been formulated by Sinclair and Zairi (1995, p. 50), who point at the organisational pervasiveness and the purpose of PMMS: "A PMMS measurement system can be defined as a system which integrates the measurement of non-financial performance at all levels within the organisation with a view to the continuous improvement of performance against organizational objectives". The use of financial and non-financial measures at all levels of organisation has been emphasized by Gaufreau and Kleiner (2001), who note that, in the past, financial measures were used primarily to evaluate senior management's performance, while non-financial measures were used at lower levels. - '
of Kaplan and Norton (2001c, 1996c, 1992) on the Balanced Scorecard, who suggest tiiat the measures should provide a 'balanced' picture of the business.
Although the review of the literature suggests a certain level of agreement about PMMS, manifest through a shared set of concepts about the way PMMS are classified and tiieir feattires, different models or frameworks of PMMS place varying emphasis on the extent to which they "...consider multiple stakeholders; measure efficiency, effectiveness and equity; capture financial and non-financial outcomes; provide vertical links between sfrategy and operations and horizontal links across tiie value chain; provide information on how the organization relates to its extemal environment and its ability to adapt" (Chenhall, 2003, p. 136). In consequence, expected benefits and satisfaction are likely to vary depending on the different configurations of controls (Otley, 1999), i.e., the concrete type of PMMS used (Speckbacher et al, 2003).
As pointed by Kenneriey and Neely (2002), and Bititci et al. (2000), the need for more integrated, strategic and balanced PMMS has been identified m mid and late 1980s, most notably in the work of Johnson and Kaplan (1987) and McNair and Masconi (1987). This has been followed by the enormous development of frameworks, models, methodologies, tools and techniques to implement and support new performance measurement systems such as the Balanced Scorecard (Kaplan and Norton, 1992), Performance Pyramid (McNair et al., 1990; Lynch and Cross, 1991) and Performance Measurement Questionnaire (Dixon et al., 1990).
2.1.2 PMMS frameworks
Balanced Scorecard
The most popular PMMS system is the Balanced Scorecard. It has been steadily gaining in popularity for the last ten years, and has been intensely promoted by a number of consultants and software vendors. According to Neely and Bourne (2000), between 40 and 60 percent of large US firms have adopted the Balanced Scorecard, while in Ausfralia the scorecard software vendor Renaissance Worldwide estimated in early 2000 that about 30 percent of largest companies have introduced the Balanced Scorecard. Kennerley and Neely (2002) attributed the Balanced Scorecard's widespread adoption to the framework's alleged simplicity and intuitive logic, which has made it easily understood and applied by users in organisations. Tiwana and Ramesh (2000) emphasized the robustness of the Balanced Scorecard, which has enabled the successful application in many industries, as elaborated on in several case studies (Kaplan and Norton, 1996b & c).
According to Give et al. (1999), the concept of the Balanced Scorecard has taken differing forms in different organisations, as a result of the way the scorecard is used in the organisation. This makes the Balanced Scorecard difficult to define in a concise manner. Banker et al. (2002, p. 1) have defined the Balanced Scorecard as a "comprehensive performance measurement system designed to systematically link a firm's vision and sfrategy to a set of performance measures related to current and ongoing actions and decisions". Give et al. (1999) have pointed at a more basic use of the Balanced Scorecard, as a means of showing a thorough and meaningful picture of a business, with the ultimate purpose of creating a learning organisation.
measures of performance which make the one fimction look good while deflating another. The concept requires the users to limit tiie number of measures to a limited number of critical key measures in performance target areas, so that managers can obtain a quick and comprehensive assessment of tiie organisation in a smgle report, to communicate a view of the organisation's sfrategy, and to track whether improvement in one area is being achieved at the expense of anotiier area (Kaplan and Norton, 1992).
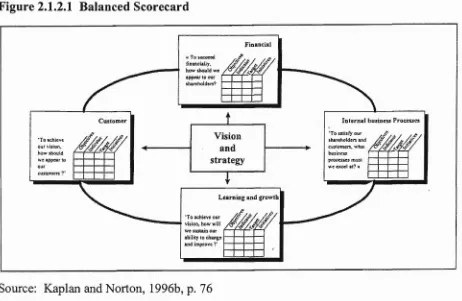
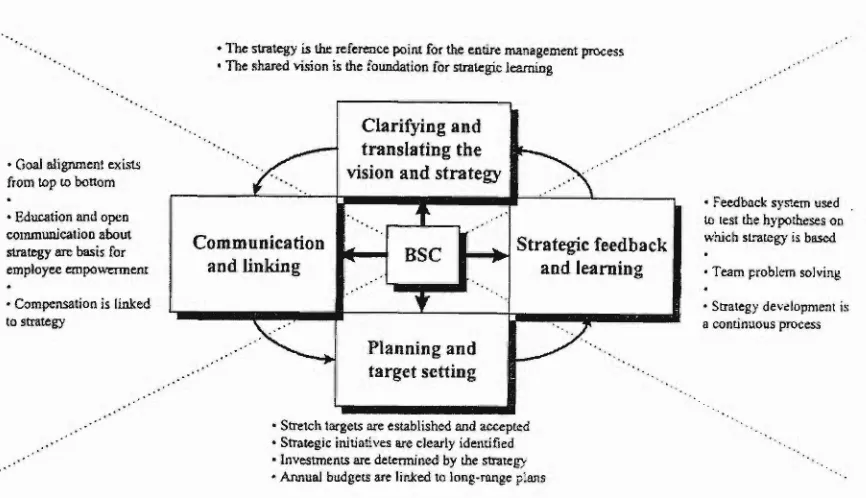
The Balanced Scorecard model disaggregates and measures overall organisational performance and well-being from four interconnected sfrategic business. perspectives, namely the fmancial, customer, intemal business process and learning and innovation (Kaplan and Norton, 1996c, 1992). The four perspectives of the scorecard permit a balance (Kaplan and Atkinson, 1998, p. 375):
1) between short and long-term objectives;
2) between extemal measures - for shareholders and customers - and intemal measures of critical business processes, innovation, and learning and growth; 3) between desired outcomes and the performance drivers of those outcomes; and 4) between hard objective measures and softer, more subjective measures.
Figure 2.1.2.1 Balanced Scorecard
«To»iccee^ fis&ncjaiiy. ' how should we
appou'toour shareholders?
Ftaancial
'To ichiev* o'jf vision.
we appear to our cUstorners ?'
' "
Customer
Vision and strategy
"T"
• ' Internal business Processes "to satisfy our ^ . ^ .
rittfshoiders and J ^ / ^ / J T / ^ / castomen, wh»i /^/^/Jy^/ business
f>rocesse5 mu^ we excel at? »
LeamtDg snd growth
vision, bow wtU we sustmo our 2bilit)> to change &nd improve ?'
Source: Kaplan and Norton, 1996b, p. 76
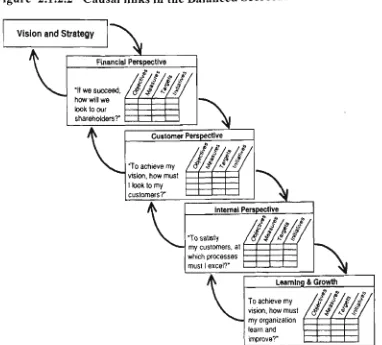
Figure 2.1.2.2 Causal links in the Balanced Scorecard
vision and Strategy ^
Financial Perspective
"If we succeed, how will we look to our shareholders?"
m/i!
: \
Cwtoraef PerspecUw
T o achieve my vision, how must I look to my custonjers?"
^
Intemal Perspectfae
"To satisly my customers, at which processes must I excel?"
""'M,
K
Learning & GrowthTo achieve my vision, how must
my organization learn and inprovB?"
/i/i/m
f/
Source: Kaplan and Norton, 2001a, p. 91
As pointed out by Tiwana and Ramesh (2000), components of the Balanced Scorecard are designed in an integrative fashion such that they reinforce each other in indicating both the current and future prospects of the company, so that the scorecard can be used as a means of organisational planning and control.
Evolution of the Balanced Scorecard concept
organisational performance, particularly with regard to key sfrategic goals. By encouraging managers to focus on a limited number of measures drawn from four 'perspectives', the original Balanced Scorecard aimed to encourage clarity and utility. Despite the prescriptive suggestion that performance measures should be closely linked to strategic priorities, the early scorecards appe^ed to be poorly aligned with the strategy. Kaplan and Norton wrote that many companies "claim to have a Balanced Scorecard because they use a mixture of financial and non-financial measures" (2001a, p. 94). As reported by Walsh (2000), early scorecards in Australian organisations were interpreted as a simple diverse set, or mix, of financial and supplementary non-financial measures, or key performance indicators, grouped into focus areas. According to Ittner and Larcker (2000), such "measurement diversity" was considered useful in preventing managers from sub-optimising by ignoring relevant performance dimensions at the
expense of others. The cause-and-effect linkages between the drivers and outcomes in various performance areas were largely absent in the early Balanced Scorecard applications, and the scorecards were perceived as performance management systems, not strategic management systems (Walsh, 2000). McJorrow and Cook (2000b), in their report on the use of the Balanced Scorecard in New Zealand, also identified the organisations in which measures were merely 'scattered' in different performance perspectives, and referred to as the Balanced Scorecard. Speckbacher et al. (2003) have identified three main types of the Balanced Scorecard, which reflect the evolution of the concept in Kaplan and Norton's writings over time. The classification corresponds to the phases of implementation of the Balanced Scorecard in organisations, which often starts with a simple and rudimentary scorecard (Kaplan and Norton, 2000b). Type I, or the
As opposed to the sunple Balanced Scorecards with a limited scope of application, which often did not measure how employees performed in relation to corporate sfrategy, the contemporary Balanced Scorecards are most frequentiy defined as performance measurement systems driven by sfrategy (Kaplan and Norton, 1996c, 2001c), to a varying extent. The Renaissance Group, tiie Balanced Scorecard software vendor, claims (http://www.rens.com/viewpoint) that the Balanced Scorecard must not be simplistically interpreted as a focused set of fmancial and non-fmancial measures. Instead, tiie PMMS must be used as a cornerstone of a successful growth sfrategy, enabling optimisation and acceleration of the business process performance, and the building of a learning organisation to achieve continuous improved performance. The Balanced Scorecards are designed to assist work units in developing objectives and measures that contiibute to achieving strategic objectives (Artley and Stroh, 2001). The idea that there must be direct linkages between strategic objectives set by the organisation and the objectives, action plans and measures of each of its work units, which forms the basis of the contemporary Balanced Scorecard framework, is often expressed as the principle of 'alignment'. Sfrategic alignment has been described (Ittner et al., 2003; Langfield-Smith, 1997) as a second general approach for developing multiple perspectives performance measurement systems, the other approach being the development of relatively simple, 'minimum-standard' systems described in previous paragraphs. Every measure in a Balanced Scorecard should address an aspect of organisation's strategy, ultimately creating a blend of strategic measures (Speckbacher et al., 2003; Kaplan and Norton, 2001 a, b, c). The Scorecard attempts to link the strategy into some form of measurement (Kaplan and Norton, 1996), and endorses the idea that employees should be observed on how they are performing with respect to organisation strategy (Give et al., 1999).
Stroh, 2001) and in fulfillment of the strategic plan. The principal aspect of the Balanced Scorecard were hypotheses about the causes of desired performance outcomes, i.e., earnings and growth in the long term. Similarly, Give et al. (1999, p. 19) identified the twofold sfrategy role of the Balanced Scorecard, as follows:
• the concept provides a compact structure for communicating strategy, and
• the cause-and-effect relationships among different factors grouped into the performance perspectives, required to articulate the sfrategic hypotheses underlying organisation's course of action.
The latter role is the most significant feature of the Type II Balanced Scorecard, which has been defined as a sfrategic multidimensional performance measurement system that describes strategy via a sequential, unidfrectional cause-and-effect relationships (Speckbacher et al., 2003). Incomplete sfrategy role of the Balanced Scorecard has also been described by McJorrow aid Cook (2000b), who reported on organisations in which the Balanced Scorecard was implemented with reference to vision and sfrategy, inasmuch the choice of measures was representative of the strategy, but the performance targets and initiatives were poorly integrated with the Balanced Scorecard. At that, the Balanced Scorecards with partial sfrategic integration were reviewed infrequently, and were not used for sfrategic learning (McJorrow and Cook, 2000b). The role of the Balanced Scorecard as a centre-piece of sfrategic communication, used by the management team to articulate, communicate and monitor implementation of sfrategy was also elaborated on in several case studies (Kaplan and Norton, 1996c).
conducive to tiie accomphshment of long-term strategic objectives (Kaplan and Norton, 1996c).
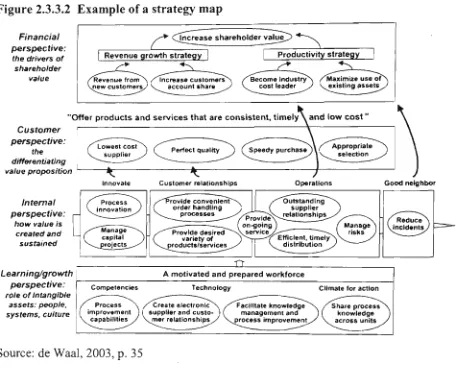
Most recently, owing to the mtroduction of the concept of 'sfrategy mapping' (Kaplan and Norton, 2001a, b &c; 2000), which was described as a flowchart of a completed business/strategic plan (Kaplan and Norton, 2001a), tiie Balanced Scorecard can be characterized as a strategic management, reporting and learning system, which is based on the company's overall goal to create value in the long term. In a 'strategy map', the cause-and-effect links between actions in the non-fmancial performance perspectives and the fmancial results are given visual form, which should enable organisations to use tiie Balanced Scorecard as a tool for sfrategic performance management and organisational change (Kaplan and Norton, 2000, 2001a, b &c).
Balanced Scorecard related and similar PMMS
Tableau de Bord
The idea of having some form of balanced picture of company performance is not new. The Tableau de Bord is a performance measurement concept that has been used in Europe, particularly France, for more than 50 years (Epstein and Manzoni, 1998), or, according to Kennerley and Neely (2002), since the early twentieth century. Tableau de Bord is a dashboard of key indicators of organisational success (Artley and Stroh, 1999), that contains essentially operational and forward looking data (Mevellec, 1995). It establishes a hierarchy of interrelated measures and cascading measures to different organisational levels, forcing functions and divisions of an organisation to position themselves in the context of the company's overall strategy, and promotes the congruence, or alignment, of sfrategic goals and initiatives and action. (Kennerley and Neely, 2002).
cause - effect relationships between actions and process performance (Epstein and Manzoni, 1998). Nowadays, it is mainly used at the top-level management level, where it provides a set of non-financial and financial indicators to monitor the progress of the business. These indicators are compared to the goals set in the context of the business unit mission, and corrective actions are taken, which is analogous to the principles and process of the Balanced Scorecard. The conceptual similarity of Tableau de Bord with the Balanced Scorecard has lead some French authors to regard the Balanced Scorecard as a special case of Tableau de Bord (Epstein and Manzoni, 1998).
Other PMMS concepts
The review of the literature on the models and approaches similar to the Kaplan and Norton's Balanced Scorecard identifies a number of alternative frameworks, of which the majority link the measures used by organisation to the overall sfrategy. Given the similarities between the PMMS frameworks, and the fact that the use of the Balanced Scorecard framework, and its variants, are reported in virtually all case studies and surveys, reviewed for this study, the alternative PMMS frameworks are discussed only briefly.
Performance Pyramid
relevant for all managers and organisational units, from busmess unit managers to tiie top executive team, i.e., from tiie operational level to senior management level.
Figure 2.1.2.3 Performance Pyramid diagram
OBJECTIVES
t
Business MEASURES Units
Business Operating
Productivity \ Systems
Departments & Worl< Centres
Source: McNair et al., 1990, p. 30
The pyramid shows how each organisational group is linked to others to achieve the company's goals and the responsibility of each group. Each level of the organisation uses thefr own combination of performance measures which support the goals of the higher level. Information flows up, down and across levels meaning managers at each level must agree on the measures, goals and potential barriers to success.
Results and Determinants Framework
The Results and Determinants Framework (Fitzgerald et al., 1991), depicted below, consists of six dimensions, or perspectives of performance, the two of which measure the results of implementing business unit competitive strategy, and comprise of financial and competitiveness measures, and four perspectives which determine those results. This approach is similar to the Balanced Scorecard model, as it consists of leading, or determinants, and lagging performance indicators, or results, i.e., the concept reflects the "concept of causality, indicating that results are a function of past business performance in relation to specific determinants" (Neely et al., 2000, p. 34).
Figure 2.1.2.4 Results and Determinants Framework
Results Determinants
Financial performance Competitiveness Quality
Flexibility
Resource utilisation Innovation
Source: Fitzgerald et al., 1991, p. 116
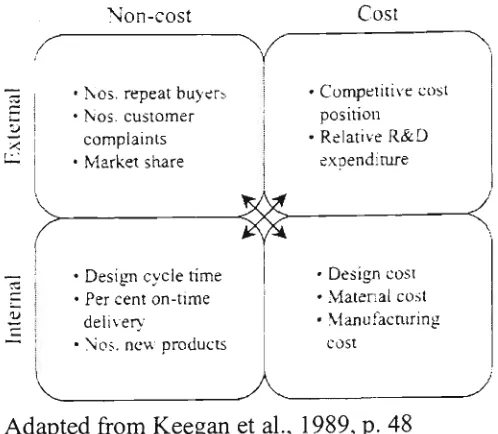
Performance Measurement Matrix
Figure 2.1.2.5 Performance Measurement Matrix
Non-cost Cost
~N,, ^
35
2
' Nos. repeat buyers ' Nos. customer
cornplaints ' Marlcet stiare
• Design cycle time • Per cent on-time
delivery
• Nos. new products
• Competitive cost position
• Relative R&D exoenditure
' Design cost • Matenal cost ' Manufacturing
cost
Adapted from Keegan et al., 1989, p. 48
2.2 Success factors and barriers to PMMS design and implementation
2.2.1 Introduction
This section lists the factors critical to successful implementation of PMMS, which had been identified through a focused literature search. Witii regard to the referenced literature, several types of sources were used to identify the determinants critical in affecting the success of PMMS, which were subsequently operationalised as measurable variables.
The literature search has resulted in compilation of a comprehensive list of factors proposed in the literature as important determinants of PMMS success. The selection highlights several critical factors related to the design of PMMS, thefr development and implementation. Given the cross-sectional sample of organisations in the survey, only generic determinants, which could be described in a generalised way (Chenhall, 2003), irrespective of the particular industry, were collated.
2.2.2 Success factors
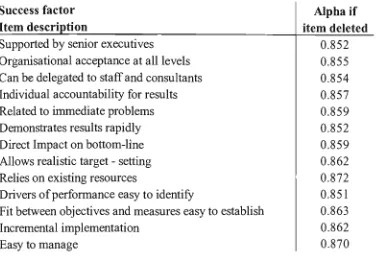
Support by senior executives
Among the numerous critical factors, the single most often discussed determinant appears to be support provided by senior executives in designing, deploying and use of PMMS in organisations. Grganisation's top management involvement, support and commitment have been described as 'critical element' by Arley and Stroh (2001) and a key predictor (Powell and Dent-Micaleff, 1997) for the success of PMMS. The importance of top-management commitment and motivation have also been emphasized by Kald and Nilsson (2000).
to the rest of the organisation, and m addition tiie CEG must take an active part m developing the first basic elements of the PMMS.
Support and sustamed commitinent by senior executives is manifested m top level nsk-takmg support, and reduces the risk of PMMS failure by making tiie personnel and monetary resources available (Rai and Bajwa, 1997; Yoon et al., 1995), and in particular sufficient time and fraining to implement the PMMS (Give et al., 1999).
The miportance of top-management support is also emphasised m integrating PMMS witii busmess sfrategy and processes (Chenhall, 2003), and ensuring continuity in PMMS investment and improvement over time (Yoon et al., 1994).
According to Andersen (2001), successftil PMMS implementation in any organisation requfres sustained management commitment to using the system, and ensuring that it drives the necessary behavioural changes within the top management and the rest of organisation. As suggested by McJorrow and Cook (2000a), articulating the intangible benefits of implementing a sfrategic PMMS framework like the Balanced Scorecard is difficult and may require a 'leap of faith', which in tum necessitates a high degree of involvement and support by senior managers to ameliorate resistance from vested interest groups in organisation (Rai and Bajwa, 1997).
Full acceptance at all levels of organisation
to ensure franslation and comparison of measures between and across multiple organisational units, departments and organisational levels (Artley and Stroh, 2001).
The recommendations concerning the methods to ensure full acceptance of PMMS at all levels of organisation unequivocally state that the PMMS design activity should be undertaken as a collective and collaborative effort (Andersen, 2001; Artley and Sfroh, 2001; Chenhall and Langfield-Smith, 1998b).
Thus, Artley and Stroh (2001) suggest that the measurements should be developed using a collaborative process including both the people whose work will be measured and the people who will implement important parts of the measurement process. According to Andersen (2001), best practice in large organisations reveals that PMMS design activity should be a collective effort drawing upon the combined operational and sfrategic insights of key employees involved with miming the business. The process of PMMS design should adopt a bottom-up approach to reviewing proposed performance objectives, measures, expectations, and results. Input from the operating personnel should be actively sought, and that input should be consolidated through successively higher levels of management, or otherwise the value and importance of organisational strategy may be undermined due to lack of support from those accountable for executing it.
In addition to enhancing the commitment to organisational strategy, having work groups at lower organisational levels develop thefr own measures also encourages experiments with new measures and methods of monitoring performance, with the interests of the entfre company in mind (Kald and Nilsson, 2000).
PMMS successfully delegated to staff and consultants
Although tiie active participation of top management in the process of development and implementation of PMMS has been sfrongly recommended at the overall level (Give et al., 1999), it has also been recognised tiiat m most organisations the process will be undertaken with varymg degrees of actiial involvement of top management, who will not have the time to participate in the project (McJorrow and Cook, 2000). hi addition to being overworked, in many cases top management may not have the necessary expertise, which design and implementation of PMMS may requfre (Yoon et al., 1995).
Given the scope and complexity of the process of design and implementation of a PMMS, top managers should be made responsible for instiUmg a sense of dfrection combined with focus and prioritization (Andersen, 2001). Correspondingly, detailed development and maintenance of a PMMS naturally promotes goal and task delegation (Andersen, 2001). According to Give et al. (1999), it is also essential to involve as many opinion leaders as possible in the initial phases of PMMS development. In the subsequent stages of the process, most employees in all parts of the organisation should take part in the discussions on how overall PMMS goals will affect day-to-day operations, and on the ways the individual employee or team can contribute towards the accomplishment of strategic goals. In practice, to ensure involvement and commitment of managers to the newly infroduced PMMS, meetings and reviews of achievement and problems associated with the implementation of PMMS were held in Australian organisations (Chenhall and Langfield-Smith, 1999b).
The decision on whom to include in project management is critical for success, and management should ensure that a project-management team is representative of component parts of the entfre organisation in order to coordinate activities with reference to a clearly articulated corporate sfrategy (Anderson, 2001). The roles of a PMMS project management team were broadly described by Give et al. (1999) as being to: "continually follow the progress of the work, offer advice, and suggest adjustments which will facilitate an understanding of the process as a whole as well as guarantee the consistency of the scorecard" (p. 46).
By enabling the development and implementation of PMMS in an organisation through delegation of the management of functional and tactical issues to a project-management team, senior managers can reduce the time spent on detailed operational confrol, and apply management resources to coordinate further development of the organisation (Anderson, 2001).
Individual accountability for results
It has been recognised that in order for a PMMS to be deployed efficiently, organisations must develop a successful system of accountability. Managers and employees must commit themselves to performance measurement by assuming responsibility for some part of the performance measurement process (Artley and Sfroh, 2001).
Personal accountability at tiie mdividual level should be ascertained during tiie phase of developmg measures. The most unportant consideration in assigning accountability is relatedness of the measure to a particular organisational role or responsibilify (Give et al.,
1999), and specifically the degree to which tiie measures can be influenced and affected by the individual.
Another unportant requfrement m establishing a system of responsibilities for the measures m PMMS is to ensure that the system is not being used for punitive purposes, mstead of diagnostic and corrective purposes (Artley and Stroh, 2001).
PMMS allows realistic target-setting
The ability of PMMS to affect goal achievement has been recognised as an important determinant of efficient use of the system, particularly with respect to promoting sfrategic alignment of activities m organisation, and affecting the employee motivation (Chenhall, 2003; Malma and Selto, 2001).
According to Miller and Israel (2002), one of the main reasons for failure of PMMS in organisations is the inabilify to link individual performance targets to corporate goals. The absence of an exphcit link with the PMMS targets resutts in lower performance than could be reasonably achieved (Malina and Selto, 2001).
Conversely, to promote effective motivation, standards of performance should not be too easy to meet, as they may not provide sufficient challenge (Chenhall, 2003). The risk of setting goals that are too easily attainable has been associated (Artley and Sfroh, 2001) with the difficulties encountered during the process of PMMS design and implementation, which in tum may result in a tendency to measure the trivial or the obvious.
Drivers of future performance easy to identify
As pointed out by Ittner and Larcker (2000), the starting point in the process of developing a PMMS is understanding an organisation's value drivers, or the factors that create stakeholders value, because these factors determine the choice of measures used to document the progress towards the long-term success. Identification of value drivers, or key success factors covering the areas for monitoring which are particularly important for the successful implementation of strategy (Kald and Nillson, 2000), is required so that organisational objectives can be translated into measures that guide managers' actions (Ittner and Larcker, 2000).
Many organisations use standard classification of performance areas proposed by the Balanced Scorecard framework, comprising financial, intemal business process, customer, and leammg and growtii categories. Such practice may be appropriate in some organisations, while in otiier organisations other non-financial dunensions may be more important, depending on the organisation's sfrategy, competitive environment and objectives (Ittner and Larcker, 2000).
The least used method to identify drivers of fiittire performance is statistical analysis of the leading and lagging indicators of fmancial performance in determinmg value drivers. The resulting 'causal business model' (Kaplan and Norton, 1996b & c) can help determine which measures predict future financial performance and can assist in assigning weightings to measures based on the strength of the statistical relationship.
Good fit between objectives and measures easy to establish
The ability to measure performance in relation to company goals or strategy has also been described as very important, and also very difficult (Gaufreau and Kleiner, 2001). Ideally, a PMMS should provide information to measure inputs, outputs, and outcomes for each business area, and should contain long-term, multiyear measures related to each objective (McJorrow and Cook, 2000a), for the purpose of monitoring long-term performance (Artley and Stroh, 2001).
With reference to objectives, Andersen (2001) emphasised the importance of clearly articulated pbjectives, in order to avoid what is being termed 'fuzzy objectives' as a frequent cause of unsuccessful implementation of PMMS. Artley and Stroh (2001) have wamed against the practice of taking the 'high road' of impossibility, resulting in establishment of unmeasurable objectives and setting unreachable goals.
links between the key success factors and future company profitability may not have been ascertained and clarified (Epstein and Manzoni, 1998).
The final set of indicators and measures covering the major goals and objectives should be evaluated against the following quantitative criteria, reported by Artley and Stroh
(2001, p. 39):
• the measures should provide a clear understanding of progress toward objectives and strategy as well as the current status, rate of improvement, and probability of achievement;
• the measures should identify gaps between current status and performance aspirations, and highlight improvement opportunities.
These criteria may be difficult to meet in development of non-financial measures, given that non-financial data are measured in many ways, and there is no common denominator, as opposed to accoimting measures. Evaluating performance or making frade-offs between attributes is difficult when some are denominated in time, some in quantities or percentages, and some in arbitrary ways (Artley and Sfroh, 2001).
Many organisations attempt to overcome this problem by rating each performance measure in terms of its strategic importance and then evaluating overall performance based on weighted average of the measures. Gthers assign arbitrary weightings to various goals. However, like all subjective assessments, these methods can lead to considerable error (Ittner and Larcker, 2000).
Can be implemented in increments
typical scorecard may take five or six months to unplement, to which an additional number of months may be needed to fme-time tiie stiuctiire, resultmg m total development tune of one year or longer. Give et al. have reported (1999) tiiat tiie development phase of tiie overall scorecard took approximately six to mne months, and have emphasised that tiie development of PMMS is the most important part of the whole process, since tiie results would greatiy affect the subsequent work of implementation. The company has had a project manager working fiill-tune witii the project for two years, assisted by a project group (Give et al., 1999). hi another example of an actiial development of a Balanced Scorecard, Neely et al. (2000) described tiie three stages of the process, which in all took seventeen months. The entire process of adopting, creating and implementing tiie Balanced Scorecard requfres about two years (Kaplan and Norton, 1996c).
Gbviously, the main obstacle to a complete and comprehensive PMMS process is the time and resource required. A balanced set of measures cannot be established overnight (Artley and Sfroh, 2001). If a PMMS project is too broad in coverage or involves too many people, there is a danger that the work will excessively consume the organisation's resources, including too much of the time of key personnel, and the project may be perceived as difficult to finish, resulting in the loss of support for the project (Gaufreau and Kleiner, 2001).
However, the recommendation that a PMMS should be implemented incrementally may coimter the very rationale for development and implementation of a PMMS. Consistent with the alleged profound benefits (Kaplan and Norton, 1996c) of the most popular PMMS, the Balanced Scorecard, some companies believe in organisation-wide implementation of the concept from the very outset, reasoning that the scorecard concept raises issues with broader ramifications. This approach forces the entfre organisation to change its philosophy of management control, and to look ahead to its goals for the future. Withrow (1995) reported on the results of a major PMMS implementation, and suggested that a better overall result and satisfaction levels were achieved through one major effort, rather than through several smaller initiatives. The drawback is that the process of gaining support, spreading the message, and instilling appropriate attitudes may take a very long time (Gaufreau and Kleiner, 2001).
Surprisingly, recently the development of the Balanced Scorecard has been delivered online on bscol.com, offering organisations a dramatic reduction of the cost and time to build their Balanced Scorecard. The Balanced Scorecard 'tool' has been automated, and the Balanced Scorecard Collaborative (BSC Gnline Member's Briefing, 2001) consultants would spend a day with the organisation's team to fransfer the knowledge and skills needed in building a scorecard. The scorecard would then be completed in only twelve weeks, and be made ready to apply to organisational units on an accelerated basis.
PMMS easy to manage
Among desirable characteristics, of decision support systems, required for successful implementation, are simplicity, ease of management, ease of understanding and manageable size (Powell and Dent-Micallef, 1997).- According to Give et al. (1999), for PMMS to be usable in practice throughout the organisation, the procedure for handling measurements must be user-friendly and not overly complicated.
absorbed by tiie process of developmg and perfectmg the PMMS, which may result in proliferation of charts, graphs and meetmgs to design and redesign tiie system. Such practice may lead to the design process takhig over overall project to improve performance (Artley and Stroh, 2001).
PMMS should not impose a large overhead, and the system should be easy to mitiate and use (Miller and Israel, 2002). Accordingly, data should be exfracted in a cost-effective and usable manner, without the need for manual intervention.
As Neely and Bourne (2000) pomt out, tiie PMMS is not likely to be adopted by employees, unless the system is efficient, which is associated with simplicity, automation, and the ability to measure as little as possible, but to ensure that only the 'things that matter' are measured.
Manoochehri (1999) has also elaborated on the desfrable characteristics of information technology platforms for managing the performance systems, and has found that a number of software tools, such as IPM, Ithink analyst, PerformancePlus, and Pb views, provide the benefit of the simple maintenance of the information contained within the system. In addition, commonly quoted widely by suppliers of such systems are the following desirable features:
• The information is presented in a communicative manner, in numbers, figures, diagrams, or multimedia which facilitate an overview;
• The information is presented in a user-friendly envfronment by using a simple, familiar interface;
• The information is easy to access by the person who needs the information.
2.2.3 PMMS Barriers
PMMS not supportive of strategy
should be tailored explicitly to support the strategy of the business to lead to competitive advantage and superior performance. In their review of the literature on the Balanced Scorecard, Malina and Selto (2001) emphasise the role of the Balanced Scorecard for strategy implementation, and sfress the alignment and links of the scorecard measures with sfrategy. Miller and Israel (2002) report the resufts of a survey by KPMG, which points at the non-alignment of the PMMS measures with strategic busmess objectives as a reason for PMMS implementation failure.
The requfrement of the PMMS providing support for the organisational strategy has been formalised by Artley and Sfroh (2001, p. 39), in suggesting that a PMMS should be subjected to a test to examine whether the system satisfies a sfrategic criterion, or specifically:
• "Do the measures enable strategic planning and then drive the deployment of the actions requfred to achieve objectives and strategies?
• Do the measures align behaviour and initiatives with strategy, and focus the organisation on its priorities? "
PMMS contains too many measures and is too complex
Among the factors which may impede the use of a PMMS and consequently lead to the failure of the system are the proliferation of the measures and the excessive complexity. These factors have been reported by Miller and Israel (2002), in the analysis of the results of a survey by KPMG, where the respondents have indicated that the PMMS in use were too complicated and measured too many things. -Such practice is in direct confrast with the principle by Simons (1995), where the information contained in a control system must be simple to understand. Similarly, Manoochehri (1999) pointed at a misconception about performance measures that 'the more is better', and stated that the overriding principle regarding performance measures is to use fewer rather than more.
therefore generating a large amount of routine data, could distract senior management's focus from those measures that are the most critical to an organisation's success (Artley and Sfroh, 2001). The process of smiplifying and distilling a large number of performance measures across tiie organisation to select a critical few tiiat drive sfrategic success should be viewed as part of tiie performance measurement process itself (Kaplan and Norton, 1996b &.c). It helps enhance understanding of the sfrategic plan and its supportmg objectives. Even tiiough compiling an exhaustive set of performance measures may accurately reflect the complexity of the organisation's tasks, eventually a pomt may be reached at which any addition of measures would be disfractmg, confusing, and costiy to administer. The problem witii having too many measures is that the high number of measures confuses the users who may not know the relative importance of the measures and, therefore, may not focus on the most important ones (Manoochehri,
1999).
According to Epstein and Manzoni (1998), as well as Ittiier and Larcker (1998), some companies measure so many dimensions that capture so many trade-offs, that people reach a state of 'uiformation overload' and leam to disregard most of the data they receive, or use the data ineffectively (Artley and Sfroh, 2000). The number of measures should be limited to keep the measurement system cognitively and administratively simple, as people can only act upon a limited amount of information, and can take very seriously only a limited number of performance indicators (Epstein and Manzoni, 1998). Using too many performance measures is wasteful, as most of them will not be used (Manoochehri, 1999).
Interestingly, Lipe and Salterio (2000) have found, in an experimental study, that the cognitive difficulties were principally assocatied with the use of unique measures, as opposed to the use of common measures, which were organised within the standard Balanced Scorecard performance perspectives.
overabundance of measures dilutes the effect of the measurement process, which has been explained by Epstein and Manzoni (1998) as: "increasing the number of performance indicators probably involves decreasing marginal retums" (p. 202). Managers collect a variety of measures simultaneously, while achieving little gaui in the main drivers of success.
Neely et al. (2000) have attributed the increased complexity of PMMS in organisations to the poor updating practices of PMMS, resulting in new measures being added to the system, while obsolete measures are rarely deleted. It is also important to avoid duplication of measures and indicators, so that the information conveyed by one indicator or measure is not provided by another (Artley and Stroh, 2001).
PMMS is not understood by employees
It has been claimed that the process of the PMMS design in itself is extremely important, and everyone involved must be given enough time to gain necessary understanding (Give et al., 1999). Before implementing any new performance measures, the users are to be educated to understand: What are the new measures? What do they measure? Why are they needed? How do measures impact them? How do thefr decisions and actions impact the performance measures? How can they control the performance and the outcome? (Manoochehri, 1999, p. 228). Lack of understanding about the purpose of PMMS will probably lead to a failure of the system (Miller and Israel, 2002). It is particularly important that the causal relationships and the priorities which emerge in the discussions on the design of PMMS be well understood and widely supported (Give et al., 1999), or the process will prove very fiustrating, with a very high risk of failure of the whole undertaking.
Above all, tiie use of non-financial measures might require users' education and fraimng (Chenhall and Langfield-Smith, 1999b), as tiieir use is new to many managers (Manoochehri, 1999). Additionally, development of new sfrategies, organisation restiuctimng, or deployment of new technologies may requfre the use of new performance measures, which will in tum require users to be educated.
PMMS not adopted by employees
ft is critical that the PMMS is acttially used tiiroughout the organisation in tiie everyday aspects of management (Give et al., 1999). If it provides tiie foundation for the daily agenda of each unit, it will have a nattiral function in current reporting and confrol through its impact on day-to-day operations. According to Andersen (2001) and Tonchia (2000), a PMMS needs to be used to realize its full value. PMMS fail when, having developed sfrategic goals and identified relevant performance measures an enterprise does not use the information provided to drive changes in the way the organisation works (Schneiderman, 1999).