1298 |
P a g e
GAP ANALYSIS IN PROJECT MANAGEMENT
Shubham Vyas
Engineer, Alstom T&D India Ltd
ABSTRACT
In today’s modern world, everyone is competing to achieve their target, but there is a gap between their target & achievement.In my 6 years of carrier in EPC &eBOP project, I have never seen any project which completed in scheduled time, cost &without re-engineering, all these thingswere done within the execution phase. All these things are reflecting there is gap in project management. In this paper, we will discuss about what is gap, what are the major gaps in project management, why it is created, what are the impact of these gaps and how to overcome from it.
Keywords: Gap Analysis, Project Management, Planning, Risk And Service Quality.
I INTRODUCTION
The gap model of service quality was first developed by trio of [1] Parasuraman, Zeithaml and Berry at North Carolina university Texas in the year 1985, from their research they have identified ten requirements useful for customers’ evaluation of the quality of services: reliability, responsiveness, tangibles, communication, credibility, security, competence,courtesy, understanding the customers and service accessibility, and based on tan finding they have classified five dimensions of service quality and they are tangibility, reliability, responsiveness, assurance, and empathy. In the year 1990 proposed a [2] service quality scale called “SERVQUAL”.[3] Gronoos and Johnson have defined service quality in terms of customer satisfaction that is degree of fit between customers’ expectation and perception of service. [4] Lewis &Booms (1983) have defined service quality within the scope of service industry as meeting customers’ needs and wants and the extent the service meets the customers’ expectations.[5] Chan and Kumaraswamy (1997) conducted a survey to find delay causes in Hong Kong construction projects andhe found five major factors: delay – (a) poor risk of management and supervision (b) Unfocused site condition. (c) Slow decision making. (d) Client- initiated variation. (e) Work variance.
What is gap
?Gap is a difference between customers’ expectations and perceptions, while in term of project1299 |
P a g e
meeting expectations and using its resources effectively. Gap analysis help to project manager & stakeholders to re-examine its goals to determine whether it is on the right path to be able to accomplish them at scheduled time with same satisfactory level which was desired. Gap analysis provides a foundation for measuring fault / break point / rate of efficiency / level of satisfaction / quality of service etc, based on customer’s need by comparing time, money and need to achieve a desired outcome.Major gaps in Project:
A survey has been carried out in eachdepartment of a EPC project team, such as PMO engineering, erection testing commissioning, procurement, sourcing, engineering, team of stakeholders etc. Based on survey&questionnaires’, we have found total 36 gaps and based on [6] PMBOK we have further divided these thirty-six points into 10 knowledge areas and ranked term using matrix method. As exhibited in table 1.Data calculation method
: Based on the impact of this project to the end uses, we have given no. 0 for lowestimpact & 9 for major impact and criticality was measured from 1 to 5. By multiplying all the data using Metrix, we get grand total and which is easier to rank.Total matrix score and ranking given in table 1.
Formula
:
Using simple matrix calculation method, were A is referring impact & B is referring criticality. ON multiplication of A x B We will get total matrix score. Formula exhibited in below ( formula -1).Formula 1- Multiplication of Matrix AxB
II CLASSIFICATION OF GAPS
Based on above outcome from our data analysis, we have classified these gaps into two parts, internal gap and external gaps. Fig 1.
1300 |
P a g e
2)External gap
– The gap created by dependents such as Third parties’ agencies, Outsourcing agencies, Suppliers (vendors), Government body etc. for example, while creating power plant we depend upon land acquisition from local villagers, material not ready at supplier’s end, getting various certificate from local authoritiesFig 1- Type of Gaps
Data analysis:
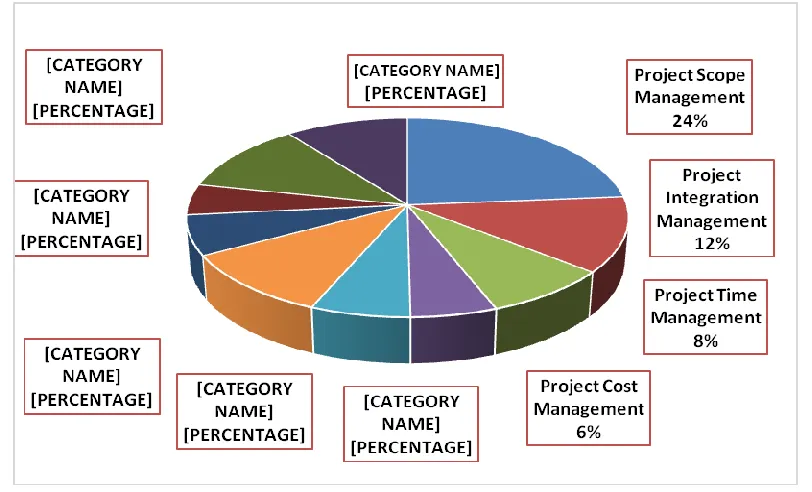
Results of our analysis are very shocking, It is beyond our expectation. We identify that majority (47%) of the gap was occurred in three knowledge area and they are Project Integration Management (12%), Project Scope Management (24%) and Project Risk Management (11%). Graph exhibited in Fig-2.
1301 |
P a g e
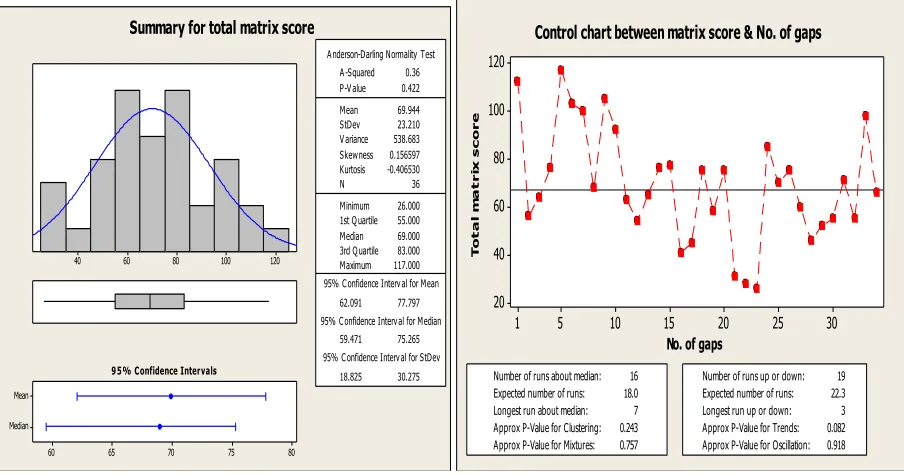
On the basis of Anderson-Darling normality test we found that Skewness &Kutosis of the response is varying widely from 0.156 to -0.406 which defined the system is unsymmetrical and confidence interval of standard deviation is varying from 18.82 to 30.27, Same was reflecting in fig 3& from control chart it is clear that total score of the matrix is varying between 117 & 26 although its mean is 69 (control line), which is exhibited in Fig 4.120 100 80 60 40 Median Mean 80 75 70 65 60
1st Quartile 55.000 Median 69.000 3rd Quartile 83.000 Maximum 117.000 62.091 77.797 59.471 75.265 18.825 30.275 A-Squared 0.36 P-Value 0.422 Mean 69.944 StDev 23.210 Variance 538.683 Skewness 0.156597 Kurtosis -0.406530 N 36 Minimum 26.000 Anderson-Darling Normality Test
95% Confidence Interval for Mean
95% Confidence Interval for Median
95% Confidence Interval for StDev
95% Confidence Intervals
Summary for total matrix score
30 25 20 15 10 5 1 120 100 80 60 40 20
No. of gaps
T o t a l m a t r ix s c o r e
Number of runs about median: 16 Expected number of runs: 18.0 Longest run about median: 7 Approx P-Value for Clustering: 0.243 Approx P-Value for Mixtures: 0.757
Number of runs up or down: 19 Expected number of runs: 22.3 Longest run up or down: 3 Approx P-Value for Trends: 0.082 Approx P-Value for Oscillation: 0.918
Control chart between matrix score & No. of gaps
Fig 3 - Total Matrix score (using Minitab) Fig4– Control chart total matrix score v/s No. of gaps
Why it is created:
There may be variable regions of these gaps, it depends from person to person, but major causes are lack of brainstorming during planning with team members of all concern departments and groups of different levels. Another cause is lack of communication between team members. It is also noticed during the survey that actual goal of the project was not known to team member’s. Based on research by [1] trio Parasuraman, Zeithaml and Berry we can say following are also be the causes of gaps in project management are: reliability, responsiveness, tangibles, communication, credibility, security, competence, courtesy, understanding the customers and service accessibility.1302 |
P a g e
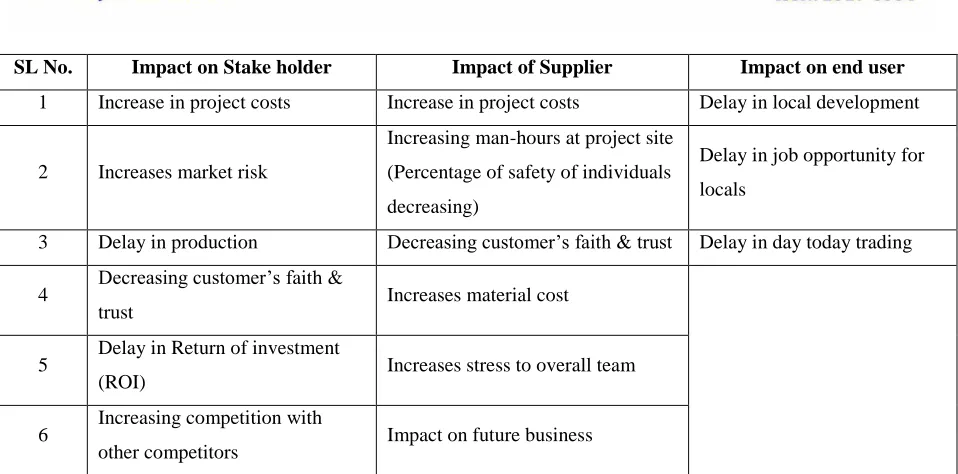
SL No. Impact on Stake holder Impact of Supplier Impact on end user1 Increase in project costs Increase in project costs Delay in local development
2 Increases market risk
Increasing man-hours at project site (Percentage of safety of individuals decreasing)
Delay in job opportunity for locals
3 Delay in production Decreasing customer’s faith & trust Delay in day today trading
4 Decreasing customer’s faith &
trust Increases material cost
5 Delay in Return of investment
(ROI) Increases stress to overall team
6 Increasing competition with
other competitors Impact on future business
Table 2 - Impact of Gap’s in Project management
III CONCLUSION
As i believe project manager must be a techno-commercial, so the team can understand both technical & commercial issues. Projects can be a small or large, simple or complex, but its rate of success or failure was depending upon effective planning.
Key findings from the research are 1) Strategic planning is the back bone of project and we must understand how to minimise criticalities and to deliver best practice world. 2) Always be ready for learning & adapting from surroundings. 3) Develop interpersonal relationship and always motivate your team member, “yes you can do”.
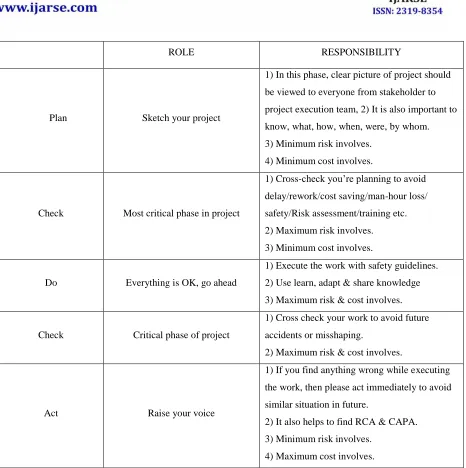
I recommend to project stakeholder and managers to focus on planning while executing project by using[7] “Plan Check Do Check Act” (PCDCA)technique, we also recommend identifying critical paths & use parallel operations where you can save time and money as well. Role & responsibility given in below table No. 3
1303 |
P a g e
ROLE RESPONSIBILITY
Plan Sketch your project
1) In this phase, clear picture of project should be viewed to everyone from stakeholder to project execution team, 2) It is also important to know, what, how, when, were, by whom. 3) Minimum risk involves.
4) Minimum cost involves.
Check Most critical phase in project
1) Cross-check you’re planning to avoid delay/rework/cost saving/man-hour loss/ safety/Risk assessment/training etc. 2) Maximum risk involves. 3) Minimum cost involves.
Do Everything is OK, go ahead
1) Execute the work with safety guidelines. 2) Use learn, adapt & share knowledge 3) Maximum risk & cost involves.
Check Critical phase of project
1) Cross check your work to avoid future accidents or misshaping.
2) Maximum risk & cost involves.
Act Raise your voice
1) If you find anything wrong while executing the work, then please act immediately to avoid similar situation in future.
2) It also helps to find RCA & CAPA. 3) Minimum risk involves.
4) Maximum cost involves.
1304 |
P a g e
Total matrix score and ranking table
:SL No Knowledge area’s Major gaps Total score Ranking
1 Project Integration Management
Lack of planning 112 02
Review meets 56 20
Decision making power 64 16
Lack of product knowledge 76 10
2 Project Scope Management
Goal not defined 117 01
Division of work (WBS) 103 04
Change in scope of work 103 04
Change in design or engineering 100 05
Synchronization between team members 68 13
change of need of customer 105 03
3 Project Time Management
Target achievement date should be fixed 92 07
Material lead time 63 17
Delay in Govt authorizations 54 22
4 Project Cost Management
Payment issue (wages to workers) 65 15
Rework 76 10
5 Project Quality Management
Quality of material 77 09
Short supply 41 26
Wrong supply 45 25
6 Project Human Resource Management
Sticks at work place 75 11
Team motivation 58 19
Ineffective supervision 75 11
Personal issues or leaves 31 27
Interpersonal relationship 28 28
7 Project Communications Management
Internal dispute 26 29
Poor communication system 85 08
Conflict between ideas 70 13
Lack of discussion 75 11
8 Project Risk Management
Act of God 75 11
Insufficient market research 60 18
1305 |
P a g e
Environmental issues 52 23
Accident at site 55 21
9 Project Procurement Management
Delay in ordering 71 12
Delay in delivering from supplier ends 55 21
10 Project Stakeholder Management
Need of customer changed 98 06
Conflict between owners or partners 66 14
Table 1 - Total matrix score and ranking table
REFERENCE
[1] Parasuraman, A, Zeithaml V.A. and Berry, L.L(1985) “A conceptual model of service quality and its implications for future research”, Journal of Marketing Vol 49, No 4, pp41-50.
[2] Zeithaml V.A., Parasuraman A, Berry L.L. “Delivering quality service: Balancing customer perceptions and expectations”. 1990. New York: The Free Press.
[3] Gronroos.C & Johnston.R(1988,) “The Six Criteria of Good Perceived SQ”, Review of Business. 9(3), pp. 10-13.
[4] Lewis, R.C. & Booms, B.H. (1983), "The marketing aspects of service quality" in Berry, L., Shostack, G. and Upah, G. (eds.), Emerging perspectives on services marketing, American Marketing Association Chicago, pp. 99-104.
[5] Chan DW, Kumaraswamy MM. “A comparative study of causes of time overruns in Hong Kong construction projects”. Int J Project Manage 1997;15(1):pp 55–63.
[6] A Guide to the Project management Body of knowledge, PMBOK®Guide–Fifth Edition, PMI, pp 87-87. [7] Vyas.S, “Managing project using 8D technique” in International journal of management, volume 7, issue 6,