690 | P a g e
CREEP AND SHRINKAGE OF HIGH PERFORMANCE
CONCRETE
ABHINAV RATHEE
1, NEETU BALHARA
21
M.Tech. Student (Civil), M.R.I.E.M. Rohtak, Haryana 2
Asst. Professor, Dept. of Civil Engineering, M.R.I.E.M., Rohtak, Haryana
ABSTRACT
The Sustained by experimental data, we conducted a complex analysis to assess the influence on high
performance concrete shrinkage and creep of several factors, such as: the age of the concrete at the
application of the load, the stress level, the temperature and relative humidity of the environment. The
experimental results were compared to several instituted predictions.
Keywords: - compression, concrete, creep, shrinkage, reinforced concrete, deformations.
1. INTRODUCTION
Latest demands regarding reinforced concrete structures, with ever expansion in height and length, require the use of
concrete with superior physical and mechanical properties.
The use of high performance concrete for reinforced concrete structures meets the requirements, with several
advantages in terms of cost and slenderness. The durability of high strength concrete is also extremely beneficial in a
long term analysis.
On the other hand, the concrete rapid increase in strength at an early age leads to a rapid removal from framework
and to an early start of service life with important financial benefits. Furthermore, this type of concrete displays
small deformations of shrinkage and creep, very good durability, high resistance to abrasion, low loss of tension and
so forth.
2. BACKGROUND OF GEO-POLYMERS
2.1 Scope and means:
Information regarding time behavior of high performance concrete is rather limited. Therefore, an experimental
program was initiated to determine the long term characteristics of high performance concrete.
The experimental program was conducted in three directions:
We monitored the shrinkage and the creep for variable curing conditions. We monitored the shrinkage and the creep for constant curing conditions
We estimated the long term behavior of high performance concrete structural members in their service
691 | P a g e
2.2 Concrete composition and testing specimens:
The concrete class studied with Portland Cement and with an addition of silica fume of 10 percent of the cement
weight. The concrete composition is detailed in Table 1.
Table 1. Concrete composition
Portland Cement CEM I 52.5 R 480 kg/m3
Silica fume 48 kg/m3 Gravel 8-16 mm 706 kg/m3 Gravel 4-8 mm 530 kg/m3 Sand 0-4 mm 530 kg/m3 Water 152 l/m3 Superplastifiant 13.5 l/m3
The test specimens were: cubes 150x150x150 mm (for compression resistance); prisms 100x100x550 mm (to determine the shrinkage); cylinders Φ90x300 mm (to determine the creep at centered compression force); prisms
40x700x500 mm (to monitor the creep at centered tensile force in time). The reinforced concrete elements consisted
in a series of 4 rectangular beams of 125x250 mm, with a length of 3200 mm, and a clear span of 3000 mm. The
longitudinal reinforcing ratio was 2.075%, of the same concrete composition.
3. VARIABLE CURING CONDITIONS
3.1 Shrinkage
The specimens were kept in water for 28 days and after that, in variable conditions of temperature and humidity. The evolution in time of the experimental results of the shrinkage “εcs” is illustrated in Figure 1, in comparison to the
design values presented in IS-456:2000.
692 | P a g e
Due to the variable curing conditions, the attenuation of the shrinkage phenomenon was observed around the age of 250 days. After approximately one year of monitoring, the value of the shrinkage was 0.480 ‰, as seen in Figure 1.
The comparison between the design values εcs,d and the experimental values εcs,e is detailed in Table 2. Table 2. Ratio variation εcs,d / εcs,e as a function of time, for different standards
Age εcs,d / εcs,e
(days) SR EN 1992-1-1 fib –1999 ACI –2005
90 1.608 1.011 1.290
190 1.591 1.311 1.217
250 1.616 1.195 1.410
380 1.345 1.115 1.320
The equations for the evaluation of the shrinkage are:
εcd(t)=βds(t,ts) ·kh ·εcd, (1)
εcds(t,ts)=εcdso(fcm)·βRH(RH)·βds(t-ts) (2)
sh
t
t
sh
u35
t
The design values closest to those obtained in the experimental program seen in Table 2.
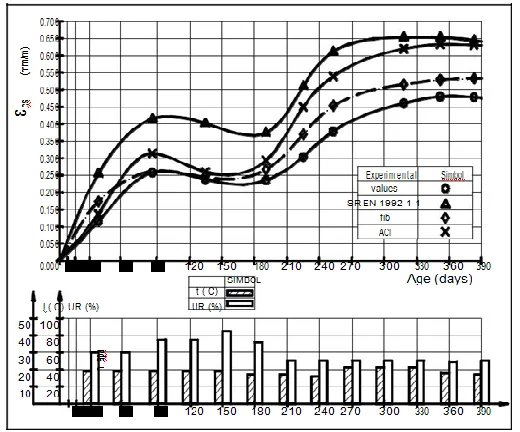
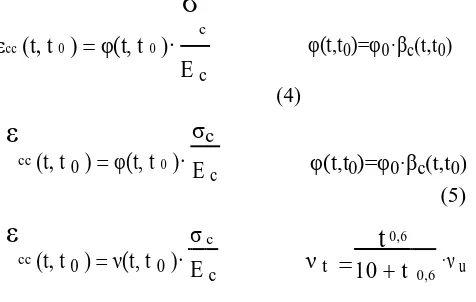
3.2 Creep
The cylinder specimens, Φ90x300 mm were subjected to long term compression loading, beginning with the age of
210 days. At this time, compression strength on cube specimens of 150x150x150 mm was of 83 MPa. The long term
loading represented 23% of the failure strength. The curing conditions were identical to the specimens used for the
shrinkage.
The specimens were monitored for 150 days under the long term loading. The evolution in time of the creep specific
deformations, the design and the experimental values, are shown in Figure 2.
693 | P a g e
The start of the attenuation takes place around the age of 90 days from the moment the loading was applied. The
design values were obtained using calculation methods of SR EN 1992-1-1 [1], fib – 1999 [2] and ACI – 2005 [3].
ε
cc(t, t
0)
φ(t, t
0)·
σ
c
φ(t,t0)=φ0·βc(t,t0)
E
c(4)
ε
cc
(t, t
0)
φ(t, t 0 )·
σ
cφ(t,t0)=φ0·βc(t,t0)
E
c(5)
ε
cc
(t, t
0)
ν(t, t
0)·
σ c
ν
t
t
0,6·ν
uE
c10
t 0,6
The comparison between the design values εcc,d and the experimental values εcc,e is detailed in Table 3.
Table 3. Ratio variation εcc,d / εcc,e as a function of time, for different standards
Age εcc,d / εcc,e
(days) SR EN fib –1999 ACI –2005 1992-1-1
28 1.316 1.382 1.470
90 1.350 1.424 1.436
150 1.230 1.286 1.318
4. CONSTANT CURING CONDITIONS (t = 200 ± 20C; RH = 60% ± 5%)
In general, the influence of relative humidity on the creep of concrete can be distinguished based on the curing
conditions prior to the application of loading. Shrinkage were studied in restrained conditions under a constant loading σ / fc,t = 0.4 during the first week after casting (7 days).
The experimental results are presented in Figure 3. The total tensile creep strain is calculated as the difference
between the cumulated restrained deformation and the unrestrained shrinkage according to the formula below:
εcc = εr – εcs (7)
Where, εc = total creep strain;
εr = restrained deformation;
694 | P a g e
Fig.3: Creep strain vs. time
4.1 Creep deformation at compression
High performance concrete is influenced by the early age at the application of the load (7 days after casting) and by the different stress / strength ratios (σ / fc,cyl): 0.23 and 0.30.
Fig.4 Creep and shrinkage vs. time
695 | P a g e
5. REINFORCED CONCRETE ELEMENTS
5.1 Test set-up
The experimental program consisted in monitoring a series of 4 rectangular beams of 125x250 mm, with a length of
3200 mm, and a clear span of 3000 mm, as shown in Figure 5.
Fig.5: Longitudinal and cross section – reinforcing and loading manner
Longitudinal reinforcing ratio is 2.075%.
The reinforcement used was PC52 with a maximum stress of σy = 300 MPa and OB37 with a maximum stress of σy
= 210 MPa.
Two elements with the same characteristics were subjected to short term loading, resulting the bending moment at
failure Mu. The bending moment related to the long term loading, Mlt, represents 40% of the bending moment at
failure: Mlt / Mu = 0.40.
The beams subjected to both short term and long term loadings are simply supported and loaded with 2 concentrated
loads applied at 1/3 of the clear span length.
The elements subjected to long term loading were monitored to the age of 360 days.
5.2 Experimental results
5.2.1 Deformations
The deflections at loading and the long term deflections, measured in the middle of the clear span are shown in
696 | P a g e
Fig.6: Instantaneous and long term deflections
At the level of loading of Mlt / Mu = 0.40, the instantaneous deflection represents 1/600 of the clear span length.
The development of the long term deflections until the age of 1 year, as shown in Figure 6, shows an attenuation of
the phenomenon after 200 days from the application of the long term loading. After 1 year, the total deflections
represent 1/300 of the clear span length l (instantaneous and long term deflections).
Time development of long term deflections φ = cc+cs / i (long term deflections / instantaneous deflections) are
shown in Figure 7.
Figure 7: Time development of φ
After approximately 200 days of long term loading,
697 | P a g e
5.2.2 Cracking
The cracking at the time of loading and its development in time are shown in Figure 8.
Fig. 8: Time development of the average crack widths
Regarding the average crack opening, measured at the center of gravity of the tensed reinforcement, the following
can be assessed:
At the time of loading with service life loads (after a preload with static service loads), the average crack width
was around 0.055mm.
The average crack width was stabilized around 0.080mm, around the age of 200 days. Above this time, until the
age of 360 days, the width of the existing cracks remained constant and no more new cracks were recorded.
6 CONCLUSIONS
The shrinkage measured on specimens subjected to variable curing conditions attenuated after 250 days from
casting. The design values closest to those obtained in the experimental program belong to fib-1999.
The attenuation of the creep measured on specimens subjected to variable curing conditions took place around the
age of 90 days from the loading point.
In case of the reinforced concrete elements, after 200 days, the long term deflections attenuated and the crack pattern
remained unchanged.
Based on the level of observations recorded so far, high performance concrete is suitable for long term loading.
However, the research is to be continued with the study of other parameters of influence, such as: the age of the
698 | P a g e
REFERENCES
[1]. IS-456:2000
[2]. Structural Concrete; Textbook on Behavior, Design and Performance, July -1999
[3]. Manual of Concrete Practice – 2005 ISSN 0065-7875
[4]. Măgureanu C. (1999) Mechanical properties of high strength concrete.
[5]. Magureanu C. – The influence of repeated loads upon short and long term strain concrete.
[6]. Magureanu C. – Influence of the long term and repeated loading on fracture mechanics of partially prestressed
beams.
[7]. Magureanu C. – Influnece of admixture on creep and shrinkage of concrete.
[8]. Al Bakri, Mohd Mustafa, H. Mohammed, H. Kamarudin, I. Khairul Niza, and Y. Zarina, "Review on fly ash-based geopolymer concrete without Portland Cement," Journalof engineering and technology research 3,vol. 1, pp. 1-4, 2011.
[9]. NS Tung, V Kamboj, A Bhardwaj, “Unit commitment dynamics-an introduction”, International Journal of
Computer Science & Information Technology Research Excellence, Volume 2, Issue 1, Pages 70-74, 2012.
[10].Preet Khandelwal, Surya Prakash Ahirwar, Amit Bhardwaj, Image Processing Based Quality Analyzer and
Controller, International Journal of Enhanced Research in Science Technology & Engineering, Volume 2,
Issue 7, 2013.