Abstract—During the operation of the Superphenix and Phenix reactors, an aberrant electrical signal was detected from the fission chambers used for neutron flux monitoring. This signal, thought to be due to partial electrical discharge (PD) is similar to the signal resulting from neutron interactions, and is generated in fission chambers at temperatures above 400 °C. This paper reports work on the characterization and localization of the source of this electrical signal in a High Temperature Fission Chamber (HTFC).
The relation between the shape of the PD signal and various parameters (nature and pressure of the chamber filling gas, electrode gap distance, and fission chamber geometry) are first described. Next, experiments designed to identify the location within the chambers where the PD are being generated are presented. After verification and refinement of the results of these localization studies, it should be possible to propose changes to the fission chamber in order to reduce or eliminate the PD signal.
Index Terms—Fission chamber, high temperature, neutron detector, partial discharge, sodium-cooled fast reactors, triple point effect.
I. INTRODUCTION
HE purpose of high temperature fission chamber (HTFC) is to detect neutrons inside the core of sodium-cooled fast reactors [1]. Multiple uses are envisaged such as reactor power control and fuel cladding failure detection.
To operate in–core, the HTFC will have to withstand the high operating temperatures, up to 650°C, of the sodium-cooled fast reactors and also to operate under high irradiation, up to 1010n/cm².s.
After years of study [2-5], it is now known that an electrical signal, more or less similar to the signal resulting from neutron
Submitted June 1, 2017. Work supported by the CEA, the French Alternative Energies and Atomic Energy Commission.
G. Galli and H. Hamrita are with the CEA, LIST, Sensors and Electronic Architectures Laboratory, Gif/Yvette, France, ([email protected]). C. Jammes is with the CEA, DEN, DER, Instrumentation, Sensors and Dosimetry Laboratory, Cadarache, Saint-Paul-lez-Durance, France. M.J. Kirkpatrick, E. Odic, Ph. Dessante and Ph. Molinie are with the GeePs | Group of electrical engineering - Paris, UMR CNRS 8507, CentraleSupélec, Univ. Paris-Sud, Université Paris-Saclay, Sorbonne Universités, UPMC Univ Paris 06, 3 & 11 rue Joliot-Curie, Plateau de Moulon 91192 Gif-sur-Yvette CEDEX, France. B. Cantonnet and J-C. Nappé are with PHOTONIS France, Nuclear Instrumentation, Brive-la-Gaillarde, France.
interactions, is generated in fission chambers at temperatures above 400 °C.
This unwanted signal poses challenges, especially during reactor start-up when the PD signal count may be on the same order of magnitude as the neutron signal count [5].
In addition to problems with reactor start-up, the unwanted signal will prohibit fuel clad failure detection, which relies on a very precise neutron count in the sodium lines.
The study presented in this paper aims to characterize this PD signal compared with the neutron pulses, and to locate the problematic zone of the chamber.
A brief summary of electrical discharge theory is described in Section II. The experimental setup is described in Section III. All results on pulse shape characterization are presented in section IV. All results on PD localization and a brief overview of the methods used are presented in section V.
II. NOTIONS OF ELECTRIC DISCHARGE THEORY
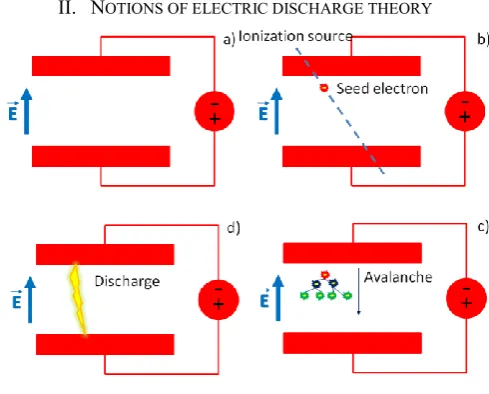
Fig. 1. Electric discharge scheme.
Electrical discharge occurs when a seed electron is accelerated by an imposed electric field, acquiring energy superior to the ionization energy of the gas atoms/molecules, leading to an electron avalanche. The schema shown in figure 1 describes the basic process. Assuming the presence of a seed electron, the conditions which will lead to an electron avalanche are
Characterization and localization of
partial-discharge-induced pulses in fission chambers
designed for sodium-cooled fast reactors
G. GALLI
1,3, H. HAMRITA
1, C. JAMMES
2, M.J. KIRKPATRICK
3, E. ODIC
3, Ph. DESSANTE
3, Ph.
MOLINIE
3, B. CANTONNET
4, J-C. NAPPÉ
4described by Paschen’s Law (eq. 1). Sources of seed electrons include cosmic rays, photo-ionization, etc.
1
1
ln
ln
ln
A
P
d
d
P
B
V
(1)Where P and d are the filling gas pressure and the inter-electrode distance, γ is the secondary emission coefficient (the yield of electrons from positive ion impact on the cathode -normally on the order of 10-4-10-2) and A and B are coefficients which depend on the gas nature and are tabulated, for the main gases, in Table 1.
TABLE 1
PASCHEN LAW EMPIRICAL COEFFICIENTS
A (Torr-1cm-1) B (V Torr-1cm-1)
H2 5 130
N2 12 342
Air 15 365
He 3 34
Ne 4 100
Ar 14 180
Xe 26 350
Figure 2 shows Paschen curves for different gases. The abscissa is the product of the pressure and the electrode separation distance, and the ordinate the voltage above which a discharge should occur. The breakdown voltage passes by a minimum value on the order of a few hundred volts, depending on gas type.
Paschen’s Law is derived for a case of infinite planar electrodes, in other words, homogeneous applied electric field. This is of course different from the case of a fission chamber, especially from the point of view that, in a fission chamber, the electrodes are held in place and electrically insulated from each other by ceramic. The presence of the insulating ceramic material, which may become electrically charged, and whose
dielectric properties are dependent on the temperature, is likely an important aspect of this type of system. In addition, the complex geometry of the system in combination with the presence of the ceramic insulator produces local electric field intensification.
III. EXPERIMENTAL SETUP
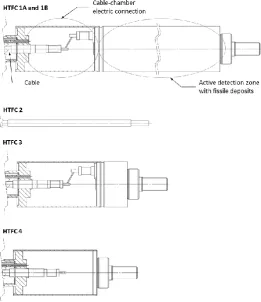
Figure 3 shows both the full and partial fission chambers used in this work; all these chambers were manufactured by Photonis using the same processes. A complete fission chamber consists of an active zone with cylindrical electrodes covered in fissile material, and a zone which serves to assure the electrical connection between the active zone and the cable which conducts signals to an amplifier. This means that there are two electrical connections in a complete chamber. The first two fission chambers, whose parameters are shown in table 1, both have the geometry shown in figure 3 (HTFC 1A and 1B), but are filled with argon to two different pressures, while the third fission chamber listed in the table is smaller (figure 2 (HTFC 2)). The last two chambers listed in Table 2 are partial chambers, having no active zone but containing either both or only one of the aforementioned electrical connectors as shown in figure 3 (HTFC 3 and 4).
All of the chambers are filled with pure Argon and the complete chambers were initially tested at room temperature and in the presence of neutron flux to ensure their proper operation under standard conditions [3].
After these tests, the fission chambers were heated to different temperatures and polarized in order to observe the appearance of partial discharges.
Fig. 2. Paschen curve for different gasses.
Fig. 3. Drawing of HTFC manufactured by PHOTONIS and used in this work.
TABLE 2 HTFCS PARAMETERS
Name HTFC 1A HTFC 1B HTFC 2 HTFC 3 HTFC 4
Diameter 48 mm 48 mm 7 mm 48 mm 48 mm
Electrodes
distance 1.5 mm 1.5 mm 0.5 mm --
--Bias
Voltage 400V 400V 200V 400V 400V
Gas
pressure 1.5 bar 3.5 bar 9 bar 3.5 bar 3.5 bar N.
electrodes 3 3 2 --
--N. fissile
deposits 4 4 2 --
--IV. PULSE SHAPE CHARACTERIZATION
The characterization of the electrical signals produced by the chambers was done for a large number of pulses (~500-10000) due to the stochastic nature of the underlying process. A given experimental condition is therefore presented here using the average pulse waveform and a corresponding histogram of the pulse Full Width at Half Maximum (FWHM).
A. Neutrons
Neutron detection signal characterization, as function of temperature, obtained from the three complete fission chambers (two chambers with geometry 1 from figure 3, and one with geometry 2) is shown in figure 4. In these experiments, the three fission chambers were polarized to their nominal bias voltage, and subjected to neutron irradiation. As seen in the figure 4, the resulting pulses have a Gaussian shape, with the exception of HTFC 2 at ambient temperature, with very similar rise and fall times; As expected, an increase in temperature causes an enlargement of the pulse FWHM. The data in figure 4 also shows that, for the smaller fission chamber (HTFC 2), the FWHM value is significantly reduced compared to the FWHM value observed for the HTFC 1A and 1B. The gas pressure does not seem to significantly affect the signal shape for the three fission chambers.
B. Partial discharges
PD pulse characterization as function of temperature, obtained from three different fission chambers, is shown in figures 5. It can be noted again here that partial discharges are only observed for cases where fission chambers are heated above about 400°C.
The PD pulses, like neutron pulses, have a Gaussian shape with very similar rise and fall times, perhaps as a consequence of the amplifier used for signal detection. .
HTFC 1B
HTFC 2
Fig. 4. (Left side) Average neutrons pulses and (Right side) histogram of Full Width Half Maximum.
HTFC 1A
HTFC 1B
HTFC 2
Fig. 5. (Left side) Average PD pulses and (Right side) histogram of Full Width Half Maximum.
described by Paschen’s Law (eq. 1). Sources of seed electrons include cosmic rays, photo-ionization, etc.
1
1
ln
ln
ln
A
P
d
d
P
B
V
(1)Where P and d are the filling gas pressure and the inter-electrode distance, γ is the secondary emission coefficient (the yield of electrons from positive ion impact on the cathode -normally on the order of 10-4-10-2) and A and B are coefficients which depend on the gas nature and are tabulated, for the main gases, in Table 1.
TABLE 1
PASCHEN LAW EMPIRICAL COEFFICIENTS
A (Torr-1cm-1) B (V Torr-1cm-1)
H2 5 130
N2 12 342
Air 15 365
He 3 34
Ne 4 100
Ar 14 180
Xe 26 350
Figure 2 shows Paschen curves for different gases. The abscissa is the product of the pressure and the electrode separation distance, and the ordinate the voltage above which a discharge should occur. The breakdown voltage passes by a minimum value on the order of a few hundred volts, depending on gas type.
Paschen’s Law is derived for a case of infinite planar electrodes, in other words, homogeneous applied electric field. This is of course different from the case of a fission chamber, especially from the point of view that, in a fission chamber, the electrodes are held in place and electrically insulated from each other by ceramic. The presence of the insulating ceramic material, which may become electrically charged, and whose
dielectric properties are dependent on the temperature, is likely an important aspect of this type of system. In addition, the complex geometry of the system in combination with the presence of the ceramic insulator produces local electric field intensification.
III. EXPERIMENTAL SETUP
Figure 3 shows both the full and partial fission chambers used in this work; all these chambers were manufactured by Photonis using the same processes. A complete fission chamber consists of an active zone with cylindrical electrodes covered in fissile material, and a zone which serves to assure the electrical connection between the active zone and the cable which conducts signals to an amplifier. This means that there are two electrical connections in a complete chamber. The first two fission chambers, whose parameters are shown in table 1, both have the geometry shown in figure 3 (HTFC 1A and 1B), but are filled with argon to two different pressures, while the third fission chamber listed in the table is smaller (figure 2 (HTFC 2)). The last two chambers listed in Table 2 are partial chambers, having no active zone but containing either both or only one of the aforementioned electrical connectors as shown in figure 3 (HTFC 3 and 4).
All of the chambers are filled with pure Argon and the complete chambers were initially tested at room temperature and in the presence of neutron flux to ensure their proper operation under standard conditions [3].
After these tests, the fission chambers were heated to different temperatures and polarized in order to observe the appearance of partial discharges.
Fig. 2. Paschen curve for different gasses.
Fig. 3. Drawing of HTFC manufactured by PHOTONIS and used in this work.
TABLE 2 HTFCS PARAMETERS
Name HTFC 1A HTFC 1B HTFC 2 HTFC 3 HTFC 4
Diameter 48 mm 48 mm 7 mm 48 mm 48 mm
Electrodes
distance 1.5 mm 1.5 mm 0.5 mm --
--Bias
Voltage 400V 400V 200V 400V 400V
Gas
pressure 1.5 bar 3.5 bar 9 bar 3.5 bar 3.5 bar N.
electrodes 3 3 2 --
--N. fissile
deposits 4 4 2 --
--IV. PULSE SHAPE CHARACTERIZATION
The characterization of the electrical signals produced by the chambers was done for a large number of pulses (~500-10000) due to the stochastic nature of the underlying process. A given experimental condition is therefore presented here using the average pulse waveform and a corresponding histogram of the pulse Full Width at Half Maximum (FWHM).
A. Neutrons
Neutron detection signal characterization, as function of temperature, obtained from the three complete fission chambers (two chambers with geometry 1 from figure 3, and one with geometry 2) is shown in figure 4. In these experiments, the three fission chambers were polarized to their nominal bias voltage, and subjected to neutron irradiation. As seen in the figure 4, the resulting pulses have a Gaussian shape, with the exception of HTFC 2 at ambient temperature, with very similar rise and fall times; As expected, an increase in temperature causes an enlargement of the pulse FWHM. The data in figure 4 also shows that, for the smaller fission chamber (HTFC 2), the FWHM value is significantly reduced compared to the FWHM value observed for the HTFC 1A and 1B. The gas pressure does not seem to significantly affect the signal shape for the three fission chambers.
B. Partial discharges
PD pulse characterization as function of temperature, obtained from three different fission chambers, is shown in figures 5. It can be noted again here that partial discharges are only observed for cases where fission chambers are heated above about 400°C.
The PD pulses, like neutron pulses, have a Gaussian shape with very similar rise and fall times, perhaps as a consequence of the amplifier used for signal detection. .
HTFC 1B
HTFC 2
Fig. 4. (Left side) Average neutrons pulses and (Right side) histogram of Full Width Half Maximum.
HTFC 1A
HTFC 1B
HTFC 2
Fig. 5. (Left side) Average PD pulses and (Right side) histogram of Full Width Half Maximum.
Stable trends in the value of the FWHM when varying the voltage or temperature are not observed as was shown for the case of neutron pulses.
However, when the diameter of the fission chamber including its electrical connection section is reduced, the FWHM tends to decrease accordingly.
Figure 5 also shows that while only one kind of PD seems to be present in HTFC 2, in HTFC 1A and 1B when the product temperature and voltage is increased beyond a certain limit, the PD pulses seem to move towards higher values of FWHM, which are indicated by arrows.
At last, HTFC 2 shows that, the PD pulses seem not to be affected by the rise of voltage and they have a small standard deviation in FWHM histogram, while HTFC 1A and 1B show that, the PD pulses seem to be affected by the rise of voltage or temperature, which increases their standard deviation in FWHM histogram.
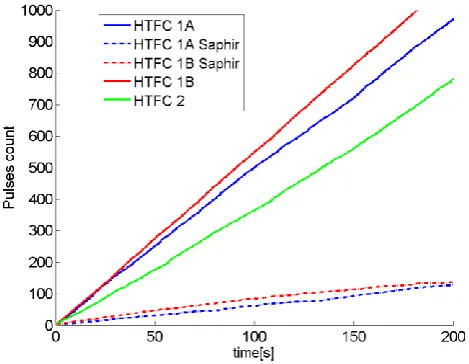
Figure 6 shows the PD count as a function of time, acquired through the PING time-stamping acquisition system, developed at the French Atomic Commission (CEA) [6]. The larger fission chambers (HTFC 1A and 1B) have been tested twice: the first test (solid line) was made in a conventional laboratory while the second tests (dashed line) were made in the underground and shielded SAPHIR facility [7] which is located at CEA in Saclay (France).
As seen in the figure 6, when the tests are performed in Saphir facility, both fission chambers have a very low PD count, and when the tests are performed in laboratory the PD count is significantly higher. The cause of very low PD count when the fission chambers were tested in the Saphir facility is then perhaps reduced ambient radiation of the Saphir facility compared to the standard laboratory.
Therefore if this reasoning is right in the experiences performed in Saphir facility the electric germ generation frequency is very small compared to the experiences performed in the standard laboratory and in this way is possible to explain the differences which we observe in figure 6.
All of this information suggests that the chamber geometry
plays a key role in the PD pulses and that there are perhaps multiple locations within the chambers where PD generation occurs.
V. NEUTRON-DISCHARGE SHAPE COMPARISON
In this section the pulse characterizations discussed in subsections A and B of part III are compared for each fission chamber.
Comparison of figures 4 and 5 shows that, in HTFC 2, neutron and PD pulses are simple to discriminate, using FWHM information, and that it is possible that they are located in different parts of the fission chamber.
Comparison of figures 4 and 5 shows that, in HTFC 1A and 1B, contrary to HTFC 2, neutron and PD pulses are very hard to discriminate because the voltage amplitude is quite similar and FWHM histogram cover the same range of values in the two cases.
VI. DISCHARGE LOCALIZATION: METHODS AND RESULTS To perform the discharges localization, we used two different methods: the first involves the use of a Phase Resolved Pattern Diagrams (PRPD), and the second is based on the comparison between the PD observed in real neutron detectors (HTFC 1B) as opposed to the PD observed in the HTFC 3 and 4, which were constructed specifically to test for electrical discharges outside of the active zone of the real fission chambers.
A. PRPD method
To perform this experiment, the HTFC 2 was placed in a tubular furnace at 650°C without any neutron source, and connected to a 50 Hz AC voltage supply. An Omicron partial discharge analyzer was then used to create the pattern diagrams, as shown in figure 7. In the PRPD, partial discharge events are displayed as points with a total charge value represented in the ordinate and the timing with respect to applied voltage in abscissa. For multiple similar discharges, a color code is used for the display, which creates the patterns seen in figure 7.
In this way it is possible to characterize different PD phenomena according to the patterns obtained or according to the way in which the patterns vary by modifying the voltage or frequency.
In figure 7, PDs were characterized with increasing applied AC voltage and it is observed that an increase in voltage leads to a left-hand motion of the resulting pattern.
Stable trends in the value of the FWHM when varying the voltage or temperature are not observed as was shown for the case of neutron pulses.
However, when the diameter of the fission chamber including its electrical connection section is reduced, the FWHM tends to decrease accordingly.
Figure 5 also shows that while only one kind of PD seems to be present in HTFC 2, in HTFC 1A and 1B when the product temperature and voltage is increased beyond a certain limit, the PD pulses seem to move towards higher values of FWHM, which are indicated by arrows.
At last, HTFC 2 shows that, the PD pulses seem not to be affected by the rise of voltage and they have a small standard deviation in FWHM histogram, while HTFC 1A and 1B show that, the PD pulses seem to be affected by the rise of voltage or temperature, which increases their standard deviation in FWHM histogram.
Figure 6 shows the PD count as a function of time, acquired through the PING time-stamping acquisition system, developed at the French Atomic Commission (CEA) [6]. The larger fission chambers (HTFC 1A and 1B) have been tested twice: the first test (solid line) was made in a conventional laboratory while the second tests (dashed line) were made in the underground and shielded SAPHIR facility [7] which is located at CEA in Saclay (France).
As seen in the figure 6, when the tests are performed in Saphir facility, both fission chambers have a very low PD count, and when the tests are performed in laboratory the PD count is significantly higher. The cause of very low PD count when the fission chambers were tested in the Saphir facility is then perhaps reduced ambient radiation of the Saphir facility compared to the standard laboratory.
Therefore if this reasoning is right in the experiences performed in Saphir facility the electric germ generation frequency is very small compared to the experiences performed in the standard laboratory and in this way is possible to explain the differences which we observe in figure 6.
All of this information suggests that the chamber geometry
plays a key role in the PD pulses and that there are perhaps multiple locations within the chambers where PD generation occurs.
V. NEUTRON-DISCHARGE SHAPE COMPARISON
In this section the pulse characterizations discussed in subsections A and B of part III are compared for each fission chamber.
Comparison of figures 4 and 5 shows that, in HTFC 2, neutron and PD pulses are simple to discriminate, using FWHM information, and that it is possible that they are located in different parts of the fission chamber.
Comparison of figures 4 and 5 shows that, in HTFC 1A and 1B, contrary to HTFC 2, neutron and PD pulses are very hard to discriminate because the voltage amplitude is quite similar and FWHM histogram cover the same range of values in the two cases.
VI. DISCHARGE LOCALIZATION: METHODS AND RESULTS To perform the discharges localization, we used two different methods: the first involves the use of a Phase Resolved Pattern Diagrams (PRPD), and the second is based on the comparison between the PD observed in real neutron detectors (HTFC 1B) as opposed to the PD observed in the HTFC 3 and 4, which were constructed specifically to test for electrical discharges outside of the active zone of the real fission chambers.
A. PRPD method
To perform this experiment, the HTFC 2 was placed in a tubular furnace at 650°C without any neutron source, and connected to a 50 Hz AC voltage supply. An Omicron partial discharge analyzer was then used to create the pattern diagrams, as shown in figure 7. In the PRPD, partial discharge events are displayed as points with a total charge value represented in the ordinate and the timing with respect to applied voltage in abscissa. For multiple similar discharges, a color code is used for the display, which creates the patterns seen in figure 7.
In this way it is possible to characterize different PD phenomena according to the patterns obtained or according to the way in which the patterns vary by modifying the voltage or frequency.
In figure 7, PDs were characterized with increasing applied AC voltage and it is observed that an increase in voltage leads to a left-hand motion of the resulting pattern.
Thanks to these results it is proposed that an insulator is involved in the phenomenon [8], and that the PD are, most likely, located in the chamber-cable electric connection zone, where most of the insulators are located, and not in the active part of the detector. This observation is supported by a separate experiment in which HTFC 1A and 1B were partially heated: either the active zone was heated, both active zone and cable connection zones were heated, or the cable only was heated. Partial discharges were only observed in these experiments for the case when the cable-chamber electrical Fig. 6. Count of PD pulses as a function of time at 650°C and 400V.
connection was heated. The fact that a heated insulator is involved in the formation of partial discharges is interesting. It is possible that increased charge transport on the surface of the insulators is responsible for the formation of partial discharges through a mechanism which may involve the metal-insulator-gas triple point. Further work will investigate this mechanism.
B. Chamber-Cable connection tests
In order to further investigate the location of the partial discharge observed in the fission chambers at high temperature, the two partial chambers shown in figure 3 (HTFC 3 and 4) were constructed by PHOTONIS and tested for partial discharge activity. Neither of the two partial chambers contain the active zone with cylindrical electrodes covered in fissile material. The first partial chamber (HTFC 3) contains both the chamber-cable electrical connection and the inner electrical connector which connects to the active zone in complete chambers. The second partial chamber contains only the external electrical connector. Otherwise, both of the partial chambers are similar to the first complete chamber shown in figure 3 (same diameter, materials, and geometry).
Both the partial chambers and the complete chamber were tested at the same temperature and the average pulse shape and pulse count were compared.
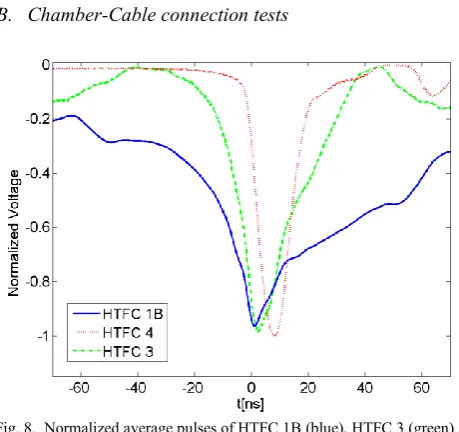
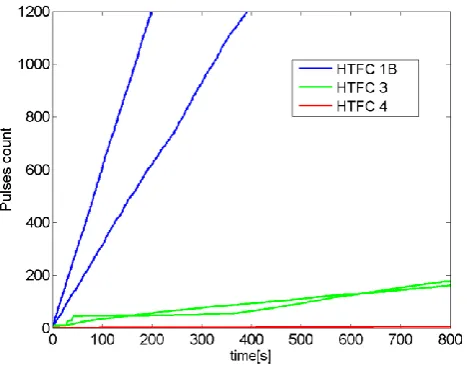
Figure 8 shows the normalized average pulse waveform for the three cases at 600°C and 400V.
The FWHM of the signal pulses appears to rise with increasing complexity of the chambers.
Figure 9 shows the PD count as a function of time, acquired through the PING time-stamping acquisition system, developed at the French Atomic Commission (CEA) [6], where the slope of the curves gives us an idea of the number of PD per second over a period of time. The partial chamber with only one of the two electrical connectors has a very low PD count, the full chamber has a high PD count, and the partial chamber with both connectors has an intermediate PD count. These results therefore indicate that the problematic zone is the junction between the active zone of the complete chamber to the intermediate zone linking the active zone with the cable, and not the junction between the intermediate zone and the cable. It is not clear at present why the PD count changes for different acquisitions made through the same fission chamber (the two blue curves in the figure 9), but this may be due to the statistical character of the partial discharge phenomenon. Further work will investigate the mechanisms Fig. 7. HTFC 2. PRPD patterns for PD in presence of a progressive increase
of 50 Hz alternative voltage.
leading to these results and seek to define design modifications to prevent PDs in fission chambers operating at high temperature.
VII. CONCLUSION
Results presented in this paper demonstrate firstly that it is difficult to discriminate between neutron detection signals and signals from partial discharges using the analysis FWHM for the case of the larger fission chambers (HTFC 1A and 1B) but may be feasible for the smaller fission chamber design (HTFC 2). The filling gas pressure was found not to significantly affect the PD pulse shape, while some broadening of the pulse signals was observed with increasing temperature. Change the environment of experiences can change completely the magnitude of PD count to the same fission chamber. Tests using an AC power supply and partial discharge analyzer indicate that the mechanism leading to partial discharges in the chambers involves an insulator.
In addition, the results on PD pulse localization show that the majority of the PDs are located near the electrical connection linking the active zone of the chamber with the intermediate zone, and therefore likely involve the alumina insulator in this connector.
Further tests will be performed to better understand the problematic zone of the chambers and the specific mechanism responsible for these discharges. A better understanding of the mechanism should then lead to the definition of design changes for the elimination of the problem of partial discharges in high temperature fission chambers.
REFERENCES
[1] C. Jammes, P. Filliatre, B. Geslot, T. Domenech, and S. Normand, “Assessment of the high temperature fission chamber technology forthe French fast reactor program”,
IEEE Trans. Nucl. Sci., vol. 59, 2012.
[2] J. P. Trapp, S. Haan, L. Martin, J. L. Perrin and M. Tixier, “High Temperature Fission Chambers: State-of-the-Art”,
In-Core Instrumentation and Reactor Core Assessment. Proceedings of a Specialist Meeting, 1997.
[3] H. Hamrita, C. Jammes, G. Galli and F. Laine, “Rejection
of partial-discharge-induced pulses in fission chambers designed for sodium-cooled fast reactors”, Nuclear Inst. and Methods in Physics Research, A, to be published.DOI: 10.1016/j.nima.2016.11.055.
[4] J. F. Miller, Fission chambers, Wiley Encyclopedia of Electrical and Electronics Engineering, to be published DOI: 10.1002/047134608X.W5203.pub2.
[5] C. Jammes et al.,“Progress in the development of the neutron flux monitoring system of the French GEN-IV SFR: simulations and experimental validations”,
Proceeding in ANIMMA, 2015.
[6] S. Normand, V. Kondrasovs, G. Corre, et al., “PING for nuclear measurements: First results”, IEEE Transactions on Nuclear Science, vol. 59, 2012.
[7] F. Carrel, et al “Characterization of Old Nuclear Waste Packages Coupling Photon Activation Analysis and Complementary Non-Destructive Techniques”, IEEE Transactions on Nuclear Science, vol. 61, 2014.
[8] C. Hudon and M. Belec, “Partial Discharge Signal Interpretation for Generator Diagnostics”, IEEE Trans. Dielectr. Electr. Insul., Vol. 12, 2005.