469 | P a g e
VISUAL DATA MINING IN SOCIAL MEDIA
Shilpy Gandharv
1, Mr. Vivek Richhariya
2, Dr. Vineet Richhariya
31
M.Tech(CSE),
2Prof. Dept. of CSE,
3Prof. & Head, Dept. of CSE
LNCT, Bhopal(M.P.)(India)
ABSTRACT
With the rapid growth of social media, the amount of customer feedback available to corporations, business
owners, and IT services managers interested in obtaining customer input is greater than ever. The total volume
of twitter comments was much larger than that of normal reviews on the web site. The tweets came in by the
minute in contrast to normal web reviews that come in on a daily basis. The enormous size of the data stream,
the diversity of the comments, and the uneven distribution of opinions over time make the analysis of twitter
data very challenging. One of the main reason of using visualizing techniques is it is easily understandable the
analysis result. Text analysis is still somewhat in its infancy, but is very promising.
Keywords—Social data, text mining, data mining, visualization.
I. INTRODUCTION
Over past 10 years, industries and organizations doesn’t have requirement to store and perform operations and analytics on information of the shoppers. However around from 2005, the requirement to rework everything into information is way amused to satisfy the wants of the individuals. therefore huge information came into image within the real time business analysis of process information. From twentieth century ahead this World Wide Web has modified the means of expressing their views. gift scenario is totally they're expressing their thoughts through on-line blogs, discussion forms and additionally some on-line applications like Facebook, Twitter, etc [3]. If we have a tendency to take Twitter as our example nearly 1TB of text information is generating inside per week within the sort of tweets. So, by this it's perceive clearly however this web is ever-changing the means of living and elegance of individuals. Among these tweets will be classified by the hash worth tags that they're commenting and posting their tweets. So, currently several corporations and additionally the survey corporations area unit mistreatment this for performing some analytics[5] specified they will predict the success rate of their product or additionally they will show the various read from the information that they need collected for analysis. But, to calculate their views is extremely troublesome during a traditional means by taking these serious information that area unit about to generate day by day.
470 | P a g e
for future analysis in mental image or different graphical tools. And, additionally to the tangible analysis advantages, text mining may be a fun and fruitful method of discovery!. Text Mining [4], is one amongst the foremost frequent nevertheless difficult exercise sweet-faced by beginners in information science / analytics consultants. the most important challenge is one has to completely assess the underlying patterns in text, that too manually. For example: it's pretty common to delete numbers from the text before we have a tendency to do any reasonably text mining. however what if we would like to extract one thing like “24/7”. Hence, the text cleansing exercise is very customized as per the target of the exercise and therefore the kind of text patterns.
II. LITERATURE REVIEW
In [1] ,they present a system for the acquisition, analysis and visualisation of Twitter data. Twitter messages are harvested and stored in a distributed cluster, and the data is processed using algorithms implemented in a MapReduce framework. We present a clustering algorithm capable of identifying the main topics of interest in a tweet data set. Also, we designed a visualization method which allows to follow the intensity of twitter activity at a given geographical location. In this paper we have presented a system for the acquisition, analysis and visualisation of Twitter data. Twitter messages are harvested and stored in a distributed cluster, and he data is processed using algorithms implemented in a MapReduce framework. We presented a clustering algorithm capable of identifying hot topics of interest in a tweet data set. Also, we designed a visualization method which allows to follow the density of twitter activity in a given geographical location. The system is a prototype and was meant to present the potential use of a social media platform as source of large scale spatio-temporal information. It represents the building ground for future social media related applications targeting a multitude of possible applications with high social impact such as emergency situation management, risk and damage assessment and even social unrest.
In this paper they can visualize the twitter data using matlab and matlab is a traditional technique which can not handle bigdata, and twitter data generates huge amount of data per data which is not able to process by traditional tools and technique, due to which we need a powerful visualizing techniques which can work on bigdata directly.
471 | P a g e
the reflection of public sentiment towards sudden events. An equivalent approach will be used as a basis for predicting future events. Twitter, one in all the foremost common on -line social media and micro-blogging services, could be a very fashionable methodology for expressing opinions and interacting with others within the on -line world. Twitter messages give real da ta within the format of short texts that categorical opinions, ideas and events captured within the moment. Tweets (Twitter posts) are well -suited sources of streaming information for opinion mining and sentiment polarity detection Opinions, evaluations , emotions and speculations usually mirror the states of individuals; they contains narrow -minded information expressed during a language composed of subjective expressions .During this paper, we tend to examine the effectiveness of a usually used text c ategorization methodology known as Bayesian supply Regression (BLR) Classification for providing positive or negative sentiment on tweets. We tend to use extracted Twitter sentiment to seem for correlations between this sentiment and major FIFA journey 2014 events as our case study.
In this paper the author calculate the polarity of the tweets wi th the help of Bayesian supply Regression (BLR) classification methodology and predict some events based on correlation between the events. But these methodology fails when data is very huge in terms of petabyte and also it cannot do real time analysis, for this we need a new tool and technique which can handle such huge and large datasets.
III. PROBLEM DEFINITION
Text mining [7] help an organization derive potentially valuable business insights from text-based content such as word documents, email and postings on social media streams like Facebook, Twitter and LinkedIn. Data mining or Text mining plays a important role in decision making because through these mining techniques we can analyse the data and on the basis of result we can take a decision. Now a days social media sites like twitter are widely used to share user opinions on various topics, twitter gives a platform to user to share their views and thoughts on various field like political, industrial, education and there is a petabytes of data generated by twitter in a day.
So the mining techniques are used to analysis the social twitter data thorough we get large amount of datasets to analysis, so the analysis of twitter data provides a better way for making decision.
IV. PROPOSED WORK
472 | P a g e
studies and journalism professionals and students to better understand user behaviour (and also user sentiment) in social networks.
V. PROPOSED METHODOLOGY
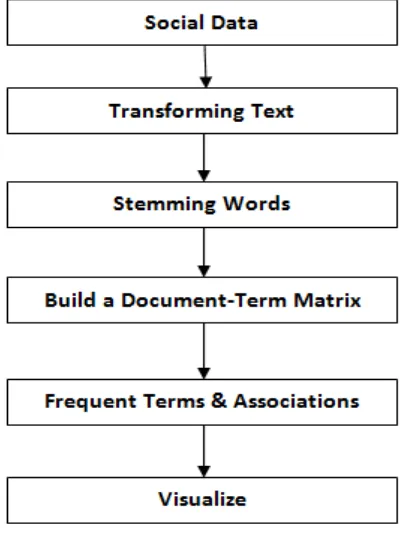
Our Steps or Algorithm Steps will follow: 1. First we get a complex social data and stored.
2. After retrieving we transformed the text, tweets are first converted to a data frame and then to a corpus. After that, the corpus needs a couple of transformations, including changing letters to lower case, removing punctuations/numbers and removing stop words.
3. In many cases, words need to be stemmed to retrieve their radicals. For instance, "example" and "examples" are both stemmed to "exampl". However, after that, one may want to complete the stems [6] to their original forms, so that the words would look "normal".
4. After transforming and stemming process is done then we build a document term matrix. Based on the matrix, many data mining tasks can be done, for example, clustering, classification and association analysis. 5. With the help of matrix we can identify the frequent words and their association between words.
6. After building a document-term matrix, we can now visualize the outputs.
Figure 2. Analysis Steps
VI. CONCLUSION
473 | P a g e
perform preprocess on these data, and analyse the unstructured data comes from twitter sites and than we can visualize the analysis result because visualization result is more easy to understand
.
REFERENCES
[1] Andrei Sechelea , Tien Do Huu, Evangelos Zimos, and Nikos Deligiannis, “Twitter Data Clustering and Visualization”, in 2016 23rd International Conference on Telecommunications (ICT), 2016 IEEE.
[2] Mr. Peiman Barnaghi and John G. Breslin , “, Opinion Mining and sentiment polarity on Twitter and correlation between Events & Sentiment”, International Conference on Big Data Computing and Application , IEEE 2016.
[3] Judith Sherin Tilsha S, Shobha M.S.,” A Survey on Twitter Data Analysis Techniques to Extract Public
Opinion.”, IJARCSE , Vol. 5 , Issue 11 , Nov 2015 , 2277128X.
[4] Lokmanyathilak Govindan Sankar Selvan,” A Framework for Fast-Feedback Opinion Mining on Twitter Data Streams”, IEEE 2015.
[5] T. K. Das , D.P. Acharjya & M. R. Patra, “ Opinion Mining about a product by Analyzing Public Tweets in Twitter “, ICCCI- 2014, Jan 03-05, 2014.
[6] Porter M.F, Snowball: A language for stemming algorithms. 2001.