Scholarship@Western
Scholarship@Western
Electronic Thesis and Dissertation Repository
9-24-2013 12:00 AM
Static and Seismic Soil Culvert Interaction
Static and Seismic Soil Culvert Interaction
Osama Salem A. Abuhajar
The University of Western Ontario
Supervisor
Dr. M. Hesham El Naggar
The University of Western Ontario Joint Supervisor Dr. Tim Newson
The University of Western Ontario
Graduate Program in Civil and Environmental Engineering
A thesis submitted in partial fulfillment of the requirements for the degree in Doctor of Philosophy
© Osama Salem A. Abuhajar 2013
Follow this and additional works at: https://ir.lib.uwo.ca/etd
Part of the Geotechnical Engineering Commons
Recommended Citation Recommended Citation
Abuhajar, Osama Salem A., "Static and Seismic Soil Culvert Interaction" (2013). Electronic Thesis and Dissertation Repository. 1659.
https://ir.lib.uwo.ca/etd/1659
This Dissertation/Thesis is brought to you for free and open access by Scholarship@Western. It has been accepted for inclusion in Electronic Thesis and Dissertation Repository by an authorized administrator of
i
STATIC AND SEISMIC SOIL CULVERT INTERACTION
(SS-SCI)
(Thesis format: Monograph)
by
Osama Salem A. Abuhajar
Graduate Program
in
Civil and Environmental Engineering
A thesis submitted in partial fulfillment
of the requirements for the degree of
Doctor of Philosophy
The School of Graduate and Postdoctoral Studies
The
University
of
Western Ontario
London, Ontario, Canada
ii
ABSTRACT
Failures of box culverts under static and earthquake loads can cause significant economic loss. Therefore, it is important to investigate the soil-culvert interaction of box culverts to understand their responses to such loads. The response of buried box culverts is a complex soil-structure interaction problem, where the relative stiffness between the soil and the soil-structure is a critical factor. Soil arching is an important aspect of the soil-culvert interaction problem, and results in the redistribution of free-field stresses due to the presence of buried structures and leads to an increase or decrease in the loading around box culverts.
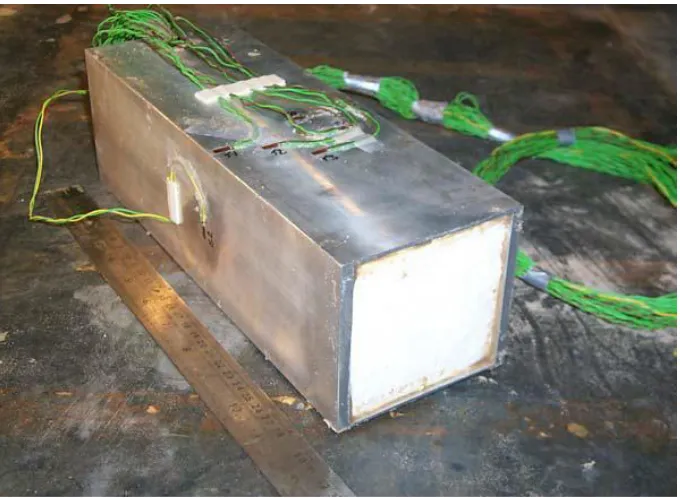
A series of static and seismic scaled physical model centrifuge tests were performed to investigate the soil culvert interaction. Two different box culvert thicknesses and two Nevada sand relative densities were used to explore the interaction between the sand and box culverts under a wide range of different conditions. The static loading consisted of the soil self-weight of and the surcharge from a surface foundation, while the seismic loading considered the application of seven earthquake shaking events for each test. Several sensors were used in these tests, including tactile pressure sensors, LVDTs, accelerometers and strain gauges. A newly developed method for installing the strain gauges inside the box culvert model is introduced. The responses of the box culvert have been compared for all of the loading conditions.
It was observed that the kinematic soil culvert interaction due to the presence of a box culvert, as well as the surface foundation, had a significant effect on reducing the peak ground acceleration at the surface when compared to the free-field peak ground acceleration. The kinematic interaction can provide up to a 50% reduction and is dependent on the amplitude of the input motion at the base of the model. Small values for the rocking of the box culvert and surface foundation were also observed, and their values changed with the amplitude of the input motion. The values observed for the foundation were higher than those for the culvert, due to the soil confinement. The lateral movement of the foundations increased as the peak ground acceleration at the base of the model increased. The racking deformation ratio of the culvert was found to change with the thickness and therefore the relative stiffness of the culvert and the soil density.
iii
observed on the culvert top slab had a parabolic shape, i.e., higher values at the edges and lower at the center than the theoretical vertical soil pressure. On the side wall, the horizontal soil pressure increased with depth. The soil-culvert interaction factors decreased at the center and increased at the edges of the top slab, as the thickness and the relative stiffness of the culvert decreased. The seismic analysis showed that the seismic bending moment increased as the peak ground acceleration at the model base and the relative stiffness of the culvert increased.
The static and seismic responses of the box culvert were analyzed using the finite difference code FLAC 2D and the results matched the experimental responses. The validated
numerical model was then used to perform a parametric study, to evaluate the effects of: culvert geometric parameters, foundation locations and soil properties for the static loading and only the culvert geometric parameters for the seismic loading. The results have been evaluated for bending moment, soil pressure and soil culvert interaction factors. Based on these analyses, charts and equations are presented to help in assessing the design values of the static soil pressure, static bending moment, and the seismic bending moments around box culverts.
Keywords
Soil arching, Soil Culvert Interaction (SCI), box culvert, foundation, Nevada sand, centrifuge modeling, finite difference modeling, kinematic interaction, rocking of structures, racking of
iv
ACKNOWLEDGEMENTS
First of all, I would like to give all the great thanks to almighty God “ALLAH” for all the
help, strength, support and patience he provided me through out the years of my study for the Ph.D. degree at Western University which made me able to finish all the requirements in the best of my capability both on the course and research levels.
Without the invaluable help of many individuals to whom I would like to express my sincere gratitude, this research would not have been completed and see the light. I would like first to thank my advisors Prof. Dr. M. Hesham El Naggar, and Dr. Tim Newson who provided me with intellectual guidance, thoughtful suggestions and continuous support through out this research. It was a great opportunity for me to work under their supervision and it was also a pleasure and privilege to work with them. The help and encouragements they provided to me during my research have great beneficial to the advances of this study. I would like also to greatly appreciate the guidance and support of Dr. Tarek Abdoun, and Dr. Inthuorn Sasanakul during the centrifuge testing program of this research at RPI. I also would like to thank several members of the centrifuge support staff and especially for Dr. Anthony Tessari for his valuable advices and interesting discussions.
Also, I would like to thank all the staff members at the administration office and at the geotechnical laboratory at the Civil and Environmental Engineering Department for their help and making my life easier through out the years of my study at Western. Many friends at Western University and RPI helped me conducting this research and I had excellent discussions
with them that helped me improve the quality of my results. Special thanks to Dr. Alper Turan at Western University and Dr. Hesham El Ganainy and Dr. Vincente Mercado from RPI.
v
TABLE OF CONTENTS
ABSTRACT ... ii
ACKNOWLEDGEMENTS ... iiv
TABLE OF CONTENTS ... v
LIST OF FIGURES ... xii
LIST OF TABLES ... xxxi
CHAPTER ONE: INTRODUCTION ... 1
1.1 INTRODUCTION ... 1
1.2 RESEARCH OBJECTIVES ... 3
1.3 ORGANIZATION OF THE THESIS ... 4
CHAPTER TWO: LITERATURE REVIEW ... 6
2.1 INTRODUCTION ... 6
2.2 PREVIOUS STUDIES RELATED TO STATIC LOADING: ... 7
2.2.1 Arching around Box Culverts ... 7
2.2.2 Investigation of Soil Structure Interaction for Box Culverts ... 16
2.2.2.1 Box culvert installation methods ... 16
2.2.2.2 Previously instrumented box culverts ... 18
2.2.2.3 Relations of soil structure interaction for box culverts ... 33
2.2.2.4 Centrifuge and numerical modeling of soil structure interaction for box culverts . ... 41
2.2.3 Soil Structure Interaction for box culverts in Codes and Standards ... 54
2.2.3.1 AASHTO ... 54
2.2.3.2 CHBDC ... 57
2.2.4 Comparison of Soil Structure Interaction Factors given in the Standards and the Literature ... 59
2.3 PREVIOUS STUDIES RELATED TO THE SEISMIC LOADING: ... 61
2.3.1 Box Culvert Behavior During Past Earthquakes ... 61
2.3.2 Soil Structure Interaction For Box Culverts In Research ... 62
2.3.2.1 Racking of rectangular/box culverts ... 67
vi
2.3.3.1 AASHTO ... 77
2.3.3.2 CHBDC ... 77
2.4 SUMMARY ... 78
CHAPTER THREE: CENTRIFUGE MODELLING TESTS ... 80
3.1 INTRODUCTION ... 80
3.2 CENTRIFUGE MODELLING ... 81
3.3 MATERIAL TESTED ... 84
3.3.1 Nevada Sand ... 84
3.3.2 Box Culvert Model ... 86
3.3.3 Foundation Model: ... 90
3.4 TEST INSTRUMENTATION ... 92
3.4.1 Accelerometers: ... 92
3.4.2 LVDTs: ... 93
3.4.3 Strain Gauges ... 94
3.4.4 Tactile Pressure Sensors ... 94
3.5 INSTRUMENT CALIBRATION ... 97
3.5.1 Accelerometer Calibration ... 97
3.5.2 LVDT Calibration... 98
3.5.3 Strain Gauge Calibration ... 99
3.5.4 Tactile Pressure Sensor Calibration ... 100
3.6 CHALLENGES DURING CENTRIFUGE TESTING: ... 105
3.6.1 LVDT Cross Bar:... 105
3.6.2 Strain Gauge Installation: ... 107
3.6.2.1 Strain gauge locations ... 111
3.7 EARTHQUAKE SIMULATION ... 113
3.7.1 Earthquake Calibration ... 114
3.7.2 Earthquakes used in the Centrifuge Tests... 116
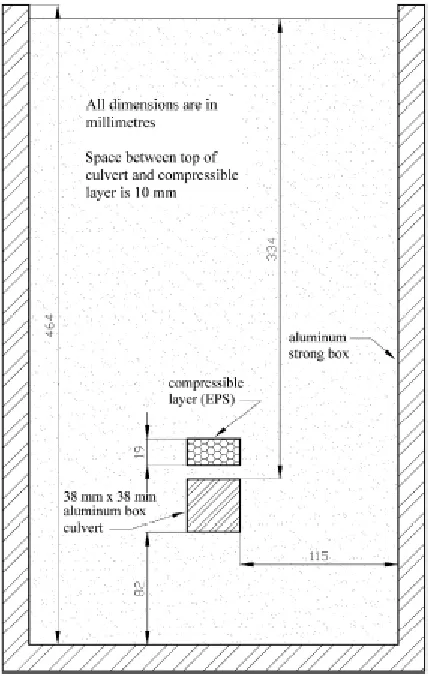
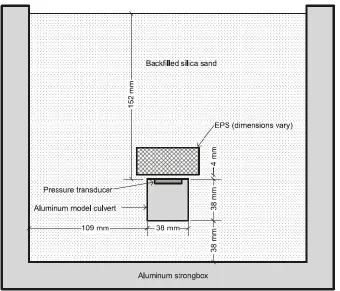
3.8 MODEL CONFIGURATION AND PREPARATION ... 122
3.8.1 Model Container ... 122
3.8.2 Model Sand Preparation ... 123
3.8.3 Model Configurations ... 125
3.8.4 Sequence for Building the Model ... 128
vii
CHAPTER FOUR: CENTRIFUGE TEST RESULTS AND INTERPRETATIONS ... 133
4.1 INTRODUCTION ... 133
4.2 MODEL SETTLEMENTS ... 134
4.3 GROUND MOTION PARAMETERS ... 139
4.3.1 Acceleration, Velocity, and Displacement Time Histories and their Frequency Content and Response Spectrum ... 140
4.3.2 Peak Ground Acceleration, Velocity, Displacement Profiles ... 142
4.3.3 PGA, PGV, PGD around Culvert ... 144
4.4 DYNAMIC SOIL PROPERTIES ... 147
4.4.1 Evaluation of Shear Stress Strain History ... 148
4.4.1.1 Effect of data filtering ... 151
4.4.2 Calculation of Shear Modulus and Damping Ratio ... 157
4.4.3 Assessment of Shear Modulus ... 159
4.4.4 Assessment of Damping Ratio ... 159
4.4.5 Evaluation of Shear Velocity ... 162
4.5 KINEMATIC SOIL CULVERT INTERACTION ... 162
4.5.1 Effect of Soil Density ... 164
4.5.2 Effect of Culvert Thickness ... 168
4.6 ROCKING OF STRUCTURES:... 170
4.7 LATERAL MOVEMENT OF FOUNDATIONS ... 174
4.8 RACKING OF BOX CULVERTS ... 177
4.8.1 Effect of Soil Density ... 177
4.8.2 Effect of Culvert Thickness ... 178
4.9 SOIL CULVERT INTERACTION PARAMETERS: ... 182
4.9.1 Static Bending Moment ... 182
4.9.1.1 Effect of surface foundation ... 182
4.9.1.2 Effect of soil density ... 185
4.9.1.3 Effect of culvert thickness ... 186
4.9.2 Static Pressure... 188
4.9.2.1 Effect of foundation ... 193
4.9.2.2 Effect of soil density ... 195
4.9.2.3 Effect of culvert thickness ... 196
4.9.2.4 Soil Culvert Interaction Factors: ... 198
viii
4.9.3.1 Effect of peak ground acceleration (PGA) ... 204
4.9.3.2 Effect of culvert thickness ... 206
4.10 SUMMARY ... 208
CHAPTER FIVE: NUMERICAL MODELLING RESULTS ... 210
5.1 INTRODUCTION ... 210
5.2 NUMERICAL SIMULATION ... 211
5.2.1 Numerical Approach ... 211
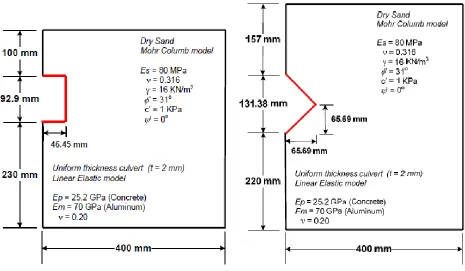
5.2.2 Model Mesh and Boundary Conditions ... 212
5.2.3 Model Parameters ... 213
5.3 SOIL-CULVERT AND SOIL-FOUNDATION INTERFACE ... 215
5.4 NUMERICAL MODEL CALIBRATION AND VERIFICATION ... 215
5.4.1 Modeling of Static Tests ... 216
5.4.1.1 Static bending moment ... 216
5.4.1.2 Static soil pressure ... 216
5.4.2 Seismic Model ... 219
5.4.2.1 Kinematic soil culvert interaction ... 219
5.4.2.2 Seismic bending moment ... 219
5.5 NUMERICAL MODEL RESULTS AND DISCUSSION ... 222
5.5.1 Effect of Soil Density ... 222
5.5.1.1 Static Bending Moment ... 222
5.5.1.2 Static Soil Pressure ... 224
5.5.1.3 Static soil culvert interaction factors ... 226
5.5.2 Seismic Bending Moment ... 228
5.5.2.1 Comparison between seismic bending moment and CHBDC ... 228
5.5.2.2 Comparisons of static, seismic and total bending moments... 230
5.5.2.3 Effect of g-level on the seismic bending moment ... 232
5.5.2.4 Ratio of seismic to static bending moment ... 235
5.6 SUMMARY ... 242
CHAPTER SIX: PARAMETRIC STUDY AND DESIGN GUIDELINES ... 243
6.1 INTRODUCTION ... 243
6.2 STATIC PARAMETRIC STUDY ... 244
ix
6.2.1.1 Bending moment ... 244
6.2.1.2 Soil pressure ... 244
6.2.1.3 Soil Culvert Interaction factors ... 254
6.2.1.4 Comparison of Soil Culvert Interaction factors with AASHTO and CBDHC . 257 6.2.1.5 Comparison of Soil Culvert Interaction factors with other researchers ... 258
6.2.2 Effect of t/Bc Ratio: ... 260
6.2.2.1 Bending moment ... 260
6.2.2.2 Soil pressure ... 261
6.2.2.3 Soil Culvert Interaction factors ... 267
6.2.2.4 Comparison of Soil Culvert Interaction factors with published literature ... 270
6.2.3 Effect of Foundation Location ... 270
6.2.3.1 Bending moment ... 271
6.2.3.2 Soil pressure ... 275
6.2.3.3 Soil Culvert Interaction factors ... 279
6.2.4 Effect of Soil Density ... 285
6.2.5 Effect of Soil Elastic Modulus... 285
6.2.5.1 Bending moment ... 285
6.2.5.2 Soil pressure ... 285
6.2.5.3 Soil Culvert Interaction factors ... 285
6.2.6 Effect of Poisson’s Ratio ... 287
6.2.6.1 Bending moment ... 287
6.2.6.2 Soil pressure ... 287
6.2.6.3 Soil Culvert Interaction factors ... 287
6.2.7 Effect of Shear Strength Parameters ... 289
6.3 SEISMIC PARAMETRIC STUDY ... 290
6.3.1 Effect of H/Bc Ratio: ... 290
6.3.1.1 PGA for Free Field (FF) and Structure Field (SF) ... 290
6.3.1.2 Comparison between seismic bending moment and CBHDC ... 291
6.3.1.3 Comparison between static, seismic and total bending moment ... 293
6.3.1.4 Static, seismic and total bending moment design observations ... 297
6.3.2 Effect of t/Bc Ratio: ... 303
6.3.2.1 Comparison between seismic bending moment and CHBDC ... 303
6.3.2.2 Comparison between static, seismic and total bending moment ... 305
x
6.4 STATIC AND SEISMIC DESIGN GUIDELINES FOR BOX CULVERT ... 314
6.4.1 Static Design Guidelines ... 314
6.4.1.1 Soil pressure distributions ... 314
6.4.1.2 Soil pressure values ... 314
6.4.1.3 Soil culvert interaction factors ... 315
6.4.2 Seismic Design Guidelines ... 316
6.4.2.1 Shape of the seismic bending moment ... 317
6.4.2.2 The seismic bending moment values ... 318
6.4.3 Design Example ... 318
6.4.4 General Recommendation ... 321
6.4.5 Kinematic Soil Culvert Interaction ... 321
6.4.6 Racking of Box Culvert ... 321
6.5 SUMMARY ... 322
CHAPTER SEVEN: SUMMARY AND CONCLUSION ... 324
7.1 RESEACH SUMMARY AND FINDINGS ... 324
7.1.1 Centrifuge Modeling... 324
7.1.1.1 Dynamic soil properties ... 325
7.1.1.2 Kinematic soil culvert interaction ... 325
7.1.1.3 Response of structures to earthquake excitations ... 326
7.1.1.4 Soil culvert interaction parameters ... 327
7.1.2 Numerical Modeling ... 328
7.1.2.1 Static analysis ... 328
7.1.2.2 Seismic analysis ... 329
7.2 RECOMMENDATIONS ... 330
BIBLIOGRAPHY ... 333
APPENDIX (A): Developed Procedure For Strain Gauge Installation Inside A Square Box Culvert Tube ... 347
APPENDIX (B): LVDT Settlement Measurements ... 360
APPENDIX (C): Acceleration, Velocity, And Displacement Time Histories, With Their Frequency Content And Response Spectrum For Test 2 - Case C ... 373
xi
APPENDIX (E): Horizontal And Vertical Peak Ground Acceleration, Velocity, And
Displacement Around Box Culvert ... 392
APPENDIX (F): Static Bending Moment From Centrifuge Results - Effect Of Strip And Rectangular Foundation ... 413
APPENDIX (G) Static Bending Moment From Centrifuge Results - Effect Of Soil Density .. 415
APPENDIX (H) Static Bending Moment From Centrifuge Results - Effect Of Culvert Thickness ... 418
APPENDIX (I) Fitting Static Bending Moment From Centrifuge Results With Different Methods... 421
APPENDIX (J) Static Tactile Pressure From Centrifuge Results - Effect Of Strip And Rectangular Foundation ... 426
APPENDIX (K) Static Tactile Pressure From Centrifuge Results - Effect Of Soil Density... 428
APPENDIX (L) Static Tactile Pressure From Centrifuge Results - Effect Of Culvert Thickness ... 431
APPENDIX (M) Comparison Of Static Pressure From Strain Gauge And Tactile Pressure Sensors In Centrifuge Tests ... 434
APPENDIX (N) Seismic Bending Moment From Centrifuge Results - Effect Of G-Level ... 439
APPENDIX (O) Seismic Bending Moment From Centrifuge Results - Effect Of Culvert Thickness ... 450
APPENDIX (P) Static Bending Moment: Centrifuge vs. FLAC 2D Results ... 459
APPENDIX (Q) Static Pressure: Centrifuge vs FLAC 2D Results ... 464
APPENDIX (R) Seismic Bending Moment: Centrifuge vs FLAC 2D Results ... 469
APPENDIX (S) Static Bending Moment From FLAC 2D Results - Effect Of Soil Density .... 472
APPENDIX (T) Static Soil Pressure From FLAC 2D Results - Effect Of Soil Density ... 475
APPENDIX (U) Seismic Bending Moment: FLAC 2D vs CHBDC Results ... 478
APPENDIX (V) Comparison Of Ststic, Seismic And Total Bending Moment From FLAC 2D Results ... 481
APPENDIX (W) Seismic Bending Moment From FLAC 2D vs CHBDC Results For Different H/Bc Ratios ... 484
APPENDIX (X) Comparison Of Ststic, Seismic And Total Bending Moment From FLAC 2D Results For Different H/Bc Ratios ... 487
APPENDIX (Y) Seismic Bending Moment From FLAC 2D vs CHBDC Results For Different t/Bc Ratios ... 490
APPENDIX (Z) Comparison Of Ststic, Seismic And Total Bending Moment From FLAC 2D Results For Different t/Bc Ratios ... 493
xii
List of Figures
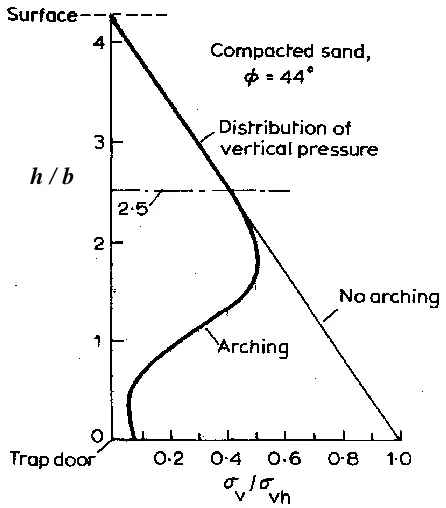
Figure 2.1: Stress distribution in the soil above yielding base ... 8
Figure 2.2:Terzaghi’s trapdoor ... 8
Figure 2.3:Janssen’s analysis ... 9
Figure 2.4:Active arching ... 10
Figure 2.5:Passive arching ... 11
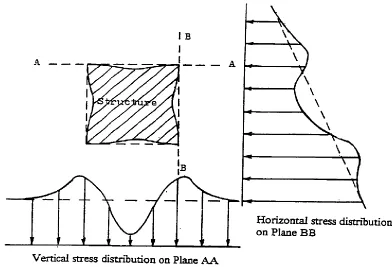
Figure 2.6: Typical deformation and stress distributions around rectangular structure with flexible sides ... 12
Figure 2.7: Active and Passive arching conditions over a box culvert ... 13
Figure 2.8: Photoelastic modeling of arching and stress bulb above the box culvert ... 13
Figure 2.9: Schematic diagram illustrating the arching mechanism for Test A and Test B ... 14
Figure 2.10: Assumed soil stress and movements around culvert ... 15
Figure 2.11: Pressure transfer within soil structure system ... 17
Figure 2.12: Imperfect trench installation ... 17
Figure 2.13: Pressure cell locations for the three culverts ... 19
Figure 2.14: Pressure cell locations for the two culverts ... 20
Figure 2.15: Instrumentation of box culvert ... 23
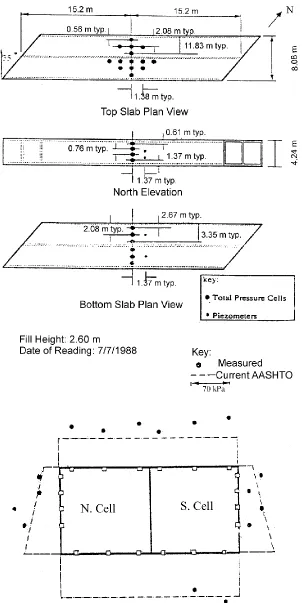
Figure 2.16: Pressure cell locations and distributions around box culvert ... 24
Figure 2.17: Pressure cell locations for the model box culvert... 25
Figure 2.18: Pressure cell locations for the model box culvert... 26
Figure 2.19: Pressure cell locations for the model box culvert... 28
Figure 2.20: Geometry and location of pressure cells on the box culvert ... 28
Figure 2.21: Evolution of global interaction factor, Fe, shear interaction factor, FV, and bending moment interaction factor, FM, for Analyses A1confined and A1elastic ... 40
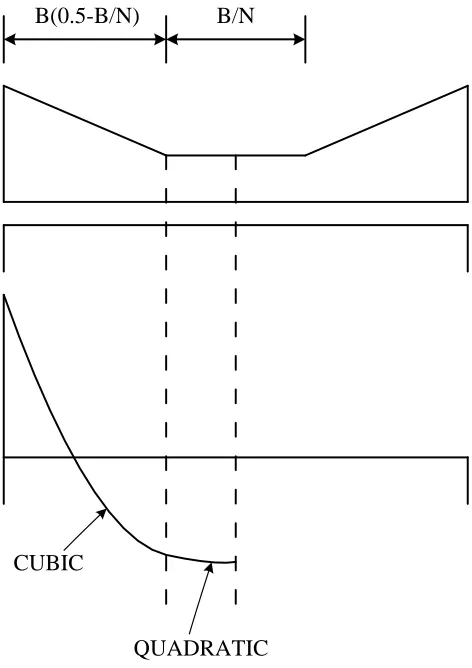
Figure 2.22: Possible loading and associated bending moment distribution in the culvert top slab ... 42
Figure 2.23: Model culvert prior to placing on sand bed ... 43
Figure 2.24: Schematic diagram showing the orientation of the two culverts and the properties used for analysis ... 44
xiii
Figure 2.26: Centrifuge strongbox dimensions and general setup for yielding foundation tests . 48
Figure 2.27: Geometry of centrifuge tests performed by Bourque (2002) ... 49
Figure 2.28: Geometry of centrifuge tests performed by McAffee (2005) ... 50
Figure 2.29: Centrifuge model set-up ... 52
Figure 2.30: Culvert dimensions and pressure cell locations ... 53
Figure 2.31: Box culvert installation ... 56
Figure 2.32: Coefficient Cdfor Trench installation. ... 56
Figure 2.33: Comparison between different methods for calculating the soil structure interaction factors Fe as a function of H/Bc ... 60
Figure 2.34: Comparison between different methods for calculating the soil structure interaction factors Feas a function of H ... 60
Figure 2.35: Layout of measuring sensors ... 65
Figure 2.36: Maximum soil pressure distribution on soil-structure interface ... 66
Figure 2.37: Racking deformations of rectangular structure ... 68
Figure 2.38: Relative stiffness of soil versus rectangular frame ... 72
Figure 2.39: Racking ratio between structure and free field ... 72
Figure 2.40: Simple frame analysis for racking deformations ... 73
Figure 2.41: Parameter M, N, and L values... 75
Figure 3.1: Centrifuge facility at RPI, Troy, NY, USA ... 81
Figure 3.2:The basic concept of the centrifuge modeling ... 82
Figure 3.3:Stresses in centrifuge modeling ... 83
Figure 3.4:Grain size distribution of 120-Nevada Sand ... 85
Figure 3.5:Box Culvert Model ... 88
Figure 3.6:Relative stiffness between the box culvert and the surrounding soil. ... 89
Figure 3.7:Foundation models. (a) Strip foundation, (b) Rectangular foundation ... 91
Figure 3.8:Accelerometer ... 92
Figure 3.9:LVDT cross section ... 93
Figure 3.10:LVDT ... 93
Figure 3.11:Strain gauges ... 94
Figure 3.12:Tactile pressure sensor ... 95
xiv
Figure 3.14:Accelerometer calibration: (a) Calibration device, (b) DAQ hardware ... 97
Figure 3.15:LVDT calibration device ... 98
Figure 3.16:Tekscan calibration machine ... 101
Figure 3.17:Tactile pressure sensors placed at the base of the centrifuge box ... 103
Figure 3.18:Tactile pressure sensor calibration ... 104
Figure 3.19:LVDTs cross bars ... 105
Figure 3.20:Displacement results. (a) Static, (b) Seismic (model scale) ... 106
Figure 3.21:Method of applying the pressure using test ball ... 108
Figure 3.22:Strain gauge installation tools inside the culvert model ... 109
Figure 3.23:Sketch of strain gauge installation tools ... 110
Figure 3.24:Schematic diagram for strain gauge locations for the thick culvert ... 112
Figure 3.25:Schematic diagram for strain gauge locations for the thin culvert ... 112
Figure 3.26:One Dimensional Box Shaker ... 113
Figure 3.27:Comparison between the input and output motion for Western Canada Earthquake from dummy test ... 115
Figure 3.28:Time histories and frequency content for the actual Kobe earthquake ... 117
Figure 3.29:Time histories and frequency content for the modeled Kobe earthquake ... 117
Figure 3.30:Time histories and frequency content for the actual Western Canada earthquake 118 Figure 3.31:Time histories and frequency content for the modeled Western Canada earthquake ... 118
Figure 3.32:Time histories and frequency content for the actual Cascadia earthquake ... 119
Figure 3.33:Time histories and frequency content for the modeled Cascadia earthquake ... 119
Figure 3.34:Rigid centrifuge model container at RPI ... 123
Figure 3.35:Model sand preparation using raining and tamping techniques ... 124
Figure 3.36:Schematic diagram for centrifuge tests ... 126
Figure 3.37:Placing the centrifuge box on the shaker and the centrifuge platform ... 129
Figure 3.38:Attaching and levelling the tactile pressure sensors to the box culvert model... 129
Figure 3.39:Sequence of building the centrifuge model ... 130
Figure 3.40:Photo of completed model ... 131
Figure 3.41:Final model with all the cases ... 131
xv
Figure 4.2:Settlement recorded from 1g to 60g for Tests 3 and 4 (Model Scale) ... 137
Figure 4.3:Settlement recorded at 60g for Test 1 Case A (Prototype Scale) ... 138
Figure 4.4:Settlement recorded at 60g for Test 1 Case C (Prototype Scale) ... 139
Figure 4.5:Acceleration, velocity, and displacement time histories with their frequencies and spectral responses for Test 2 Case C and the earthquake KEQH ... 141
Figure 4.6:Profile of PGA, PGV, and PGD for all earthquakes considered in Test 1 Case A, . 143 Figure 4.7:PGA, PGV, and PGD resulted from the horizontal and vertical accelerometers on both sides of the box culvert for all the shakings in Test 1 Case A. ... 146
Figure 4.8:Downhole accelerometer array (After Zeghal et al., 1995) ... 149
Figure 4.9:Shear stress and shear strain time history and their cyclic loops for Test 2 Case A at different depths under shaking WCM ... 150
Figure 4.10:Unfiltered frequency of the acceleration at Ac2 ... 152
Figure 4.11:Filtered frequency of the acceleration at Ac2 between 0.2 and 25 Hz ... 152
Figure 4.12:Filtered frequency of the acceleration at Ac2 between 0.3 and 1.5 Hz ... 153
Figure 4.13:Shear stress-strain cycles at different depths during WCL shaking in Test 1 Case A using filtered accelerations and filtered displacements between 0.3 and 1.5 Hz. ... 153
Figure 4.14:Shear stress-strain cycles at different depths during WCL shaking in Test 1 Case A using unfiltered accelerations and filtered displacements between 0.3 and 1.5 Hz. ... 154
Figure 4.15:Shear stress-strain cycles at different depths during WCL shaking in Test 1 Case A using filtered accelerations and filtered displacements between 0.2 and 25 Hz. ... 154
Figure 4.16:Shear stress-strain cycles at different depths during WCL shaking in Test 1 Case A using unfiltered accelerations and filtered displacements between 0.2 and 25 Hz. ... 155
Figure 4.17:Shear stress-strain cycles at different depths during WCM shaking in Test 1 Case A using unfiltered accelerations and filtered displacements between 0.2 and 25 Hz. ... 155
Figure 4.18:Shear stress-strain cycles at different depths during WCL shaking in Test 2 Case A using unfiltered accelerations and filtered displacements between 0.2 and 25 Hz. ... 156
Figure 4.19:Shear stress-strain cycles at different depths during WCM shaking in Test 2 Case A using unfiltered accelerations and filtered displacements between 0.2 and 25 Hz. ... 156
Figure 4.20:Evaluation of shear modulus and damping ratio from stress-strain loop. ... 158
Figure 4.21:Shear modulus degradation of sand under WCL and WCM shakings ... 160
xvi
Figure 4.23:Damping degradation of sand under WCL and WCM shakings in Test 1 Case A 161 Figure 4.24:Damping degradation of sand under WCL and WCM shakings in Test 2 Case A 161 Figure 4.25:Free Field and Structure Field PGA profiles for Test 1 Case C in KEQM shaking
... 164
Figure 4.26:Free Field (FF) and Structure Field (SF) PGAs due to KEQ ... 165
Figure 4.27:Free Field (FF) and Structure Field (SF) PGAs due to WC ... 166
Figure 4.28:Free Field (FF) and Structure Field (SF) PGAs due to VC ... 167
Figure 4.29:Free Field (FF) and Structure Field (SF) PGAs due to KEQ ... 168
Figure 4.30:Free Field and Structure Field PGAs due to WC ... 169
Figure 4.31:Free Field and Structure Field PGAs due to VC ... 170
Figure 4.32:Base and foundation top PGA and PGD values for Case C ... 175
Figure 4.33:Base and foundation top PGA and PGD values for Cases C and D of Tests 3 and 4 . 176 Figure 4.34:Comparison of bending moment on the top slab for all cases of Test 4 ... 184
Figure 4.35:Comparison of bending moment on the side wall for all cases of Test 4 ... 184
Figure 4.36:Comparison of bending moment on the top slab for Case A of Tests 3 and 4 ... 185
Figure 4.37:Comparison of bending moment on the side wall for Case A of Tests 3 and 4 ... 186
Figure 4.38:Comparison of bending moment on the top slab for Case A of Tests 1 and 4 ... 187
Figure 4.39:Comparison of bending moment on the side wall for Case A of Tests 1 and 4 ... 187
Figure 4.40:Fitting of bending moment resulted from strain data on the top slab... 189
Figure 4.41:Comparison of pressure resulting from 3rd order polynomial fitting of moment on the top slab for Test 1 Case A ... 191
Figure 4.42:Pressure on top slab using 4th order polynomial fitting of moment for Test 1 Case A ... 191
Figure 4.43:Pressure on the top slab using Cubic Spline fitting of moment for Test 1 Case A 192 Figure 4.44:Pressure results on the top slab from FLAC 2D for Test 1 Case A ... 192
Figure 4.45:Comparison of pressures on the side wall for Test 1 Case A ... 193
Figure 4.46:Average tactile pressure on the top slab for Test 1 ... 194
Figure 4.47:Average tactile pressure on the side wall for Test 1... 194
Figure 4.48:Average tactile pressure on the top slab for Case A of Tests 1 and 2 ... 195
xvii
Figure 4.50:Comparison of the average tactile pressure on the top slab ... 197
Figure 4.51:Comparison of the average tactile pressure on the side wall ... 197
Figure 4.52:Approximation of vertical stress distribution with depth ... 199
Figure 4.53:Strain and acceleration time histories ... 204
Figure 4.54:Effect of PGA amplitude on seismic bending moments (WC , Case A of Test 1) 205 Figure 4.55:Effect of PGA amplitude on seismic bending moments (VC, Case A of Test 1) .. 205
Figure 4.56:Effect of PGA amplitude of seismic bending moments (KEQ, Case A of Test 1) 206 Figure 4.57:Effect of culvert thickness on seismic bending moments (WCL, Tests 1A and 4A) ... 207
Figure 4.58:Effect of culvert thickness on seismic bending moments (VCL, Tests 1A and 4A) ... 207
Figure 4.59: Effect of culvert thickness on seismic bending moments (KEQL, Tests 1A and 4A) ... 208
Figure 5.1: Numerical grid and model component ... 213
Figure 5.2:Measured versus computed bending moment at the top slab - Case A of Test 1 ... 217
Figure 5.3:Measured versus computed bending moment on the side wall - Case A of Test 1 .. 217
Figure 5.4:Measured versus computed pressure at the top slab - Case A of Test 1 ... 218
Figure 5.5:Measured versus computed pressure on the side wall - Case A of Test 1 ... 218
Figure 5.6:Measured and calculated PGA values for the Free and Structural Fields for Kobe Earthquake ... 220
Figure 5.7:Measured and calculated PGA values for the Free and Structural Fields for Western Canada Earthquake ... 220
Figure 5.8:Measured and computed seismic bending moments due to KEQL on the top slab for Case A of Test 1 ... 221
Figure 5.9:Measured and computed seismic bending moments due to KEQL on the side wall for Case A of Test 1 ... 221
Figure 5.10:Bending moments on the top slab for Case A of Tests 3 and 4 ... 223
Figure 5.11:Bending moments on the side wall for Case A of Tests 3 and 4 ... 223
Figure 5.12:Soil pressures on top slab and the deflected shape ... 225
xviii
Figure 5.14:Computed seismic bending moment from FLAC 2D and from CHBDC due to KEQL on the top slab for Case A of Test 1 ... 229 Figure 5.15:Computed seismic bending moment from FLAC 2D and from CHBDC due to KEQL on the side wall for Case A of Test 1 ... 229 Figure 5.16:Computed static, seismic and total bending moments from FLAC 2D due to KEQL on the top slab for Case A of Test 1... 231 Figure 5.17:Comparison of computed static, seismic and total bending moments from FLAC 2D due to KEQL on the side wall for Case A of Test 1 ... 231
Figure 5.18:Computed seismic bending moment from FLAC 2D due to KEQ on the top slab for Case A of Test 1 ... 232 Figure 5.19:Computed seismic bending moment from FLAC 2D due to KEQ on the side wall for Case A of Test 1 ... 233 Figure 5.20:Computed seismic bending moment from FLAC 2D due to WC on the top slab for Case A of Test 1 ... 233 Figure 5.21:Computed seismic bending moment from FLAC 2D due to WC on the side wall for Case A of Test 1 ... 234 Figure 5.22:Computed seismic bending moment from FLAC 2D due to VC on the top slab for Case A of Test 1 ... 234 Figure 5.23:Computed seismic bending moment from FLAC 2D due to VC on the side wall for Case A of Test 1 ... 235 Figure 5.24:Effect of g-level on the ratio of seismic to static bending moments due to KEQ on the top slab for Case A of Test 1 ... 236 Figure 5.25:Effect of g-level on the ratio of seismic to static bending moments due to KEQ on the side wall for Case A of Test 1 ... 237 Figure 5.26:Effect of g-level on the ratio of seismic to static bending moments due to WC on the top slab for Case A of Test 1 ... 237
Figure 5.27:Effect of g-level on the ratio of seismic to static bending moments due to WC on the side wall for Case A of Test 1 ... 238
xix
Figure 5.29:Effect of g-level on the ratio of seismic to static bending moments from FLAC 2D
due to VC on the side wall for Case A of Test 1 ... 239
Figure 5.30:Effect of earthquake frequency for low g-level on the ratio of seismic to static bending moments on the top slab for Case A of Test 1 ... 240
Figure 5.31:Effect of earthquake frequency for medium g-level on the ratio of seismic to static bending moments on the top slab for Case A of Test 1 ... 240
Figure 5.32:Effect of earthquake frequency for low g-level on the ratio of seismic to static bending moments on the side wall for Case A of Test 1 ... 241
Figure 5.33:Effect of earthquake frequency for medium g-level on the ratio of seismic to static bending moments from FLAC 2D on the side wall for Case A of Test 1 ... 241
Figure 6.1: Effect of H/Bc ratio on the bending moment on the top slab (t = 0.533 m) ... 246
Figure 6.2:Effect of H/Bc ratio on the bending moment on the side wall (t = 0.533 m) ... 246
Figure 6.3:Effect of H/Bc ratio on the bending moment on the top slab (t = 0.267 m) ... 247
Figure 6.4:Effect of H/Bc ratio on the bending moment on the side wall (t = 0.267 m) ... 247
Figure 6.5:Effect of H/Bc ratio on the vertical stresses around box culvert (t = 0.533 m) ... 248
Figure 6.6:Effect of H/Bc ratio on the vertical stresses around box culvert (t = 0.267 m) ... 249
Figure 6.7:Effect of H/Bc ratio on the horizontal stresses around box culvert (t = 0.533 m) .... 250
Figure 6.8:Effect of H/Bc ratio on the horizontal stresses around box culvert (t = 0.267 m) .... 251
Figure 6.9:Effect of H/Bc ratio on the soil pressure on the top slab (t = 0.533 m) ... 252
Figure 6.10:Effect of H/Bc ratio on the soil pressure on the side wall (t = 0.533 m) ... 252
Figure 6.11:Effect of H/Bc ratio on the soil pressure on the top slab (t = 0.267 m) ... 253
Figure 6.12:Effect of H/Bc ratio on the soil pressure on the side wall (t = 0.267 m) ... 253
Figure 6.13:Effect of the thickness and the ratio H/Bc on the soil culvert interaction factors Fe on the top slab ... 255
Figure 6.14:Effect of the thickness and the ratio H/Bc on the soil culvert interaction factors Fe on the side wall at rest pressure Ko ... 255
Figure 6.15:Effect of the thickness and the ratio H/Bc on the soil culvert interaction factors Fe on the side wall at active pressure Ka ... 256
xx
Figure 6.17:Comparison between the soil culvert interaction factors Fe determined from
parametric study with ASSHTO and CHBDC... 257
Figure 6.18:Comparison between the soil culvert interaction factors Fe determined from parametric study with Bennett et al (2005) and Kang et al (2007) ... 259
Figure 6.19:Comparison between the soil culvert interaction factors Fe determined from the parametric study with Tadros et al. (1989) and Kim et al (2005) ... 259
Figure 6.20:Comparison between the soil culvert interaction factors Fe determined from the parametric study and with previous test data ... 260
Figure 6.21:Effect of t/Bc ratio on the bending moment on the top slab ... 263
Figure 6.22:Effect of t/Bc ratio on the bending moment on the side wall ... 263
Figure 6.23:Effect of t/Bc ratio on the vertical stresses around box culvert ... 264
Figure 6.24:Effect of t/Bc ratio on the horizontal stresses around box culvert ... 264
Figure 6.25:Effect of t/Bc ratio on the vertical stresses at the level of the top slab ... 265
Figure 6.26:Effect of t/Bc ratio on the horizontal stresses at the level of the side wall ... 265
Figure 6.27:Effect of t/Bc ratio on the soil pressure on the top slab ... 266
Figure 6.28:Effect of t/Bc ratio on the soil pressure on the side wall ... 266
Figure 6.29:Effect of the thickness ratio t/Bc on the soil culvert interaction factors Fe on the top slab ... 268
Figure 6.30:Effect of thickness ratio t/Bc on soil culvert interaction factors Fe on side wall at rest pressure Ko ... 269
Figure 6.31:Comparison between the soil culvert interaction factors Fe determined from parametric study with previous test data ... 270
Figure 6.32:Effect of foundation location (H=0.5BF) on the bending moment on the top slab 272 Figure 6.33:Effect of foundation location (H=0.5BF) on the bending moment on the side wall ... 272
Figure 6.34:Effect of foundation location (H=BF) on the bending moment on the top slab ... 273
Figure 6.35:Effect of foundation location (H=BF) on the bending moment on the side wall ... 273
Figure 6.36:Effect of foundation location (H=1.67BF) on the bending moment on the top slab ... 274
xxi
Figure 6.38:Effect of foundation location (H=0.5BF) on the soil pressure on the top slab ... 276 Figure 6.39:Effect of foundation location (H=0.5BF) on the soil pressure on the side wall ... 276 Figure 6.40:Effect of foundation location (H=BF) on the soil pressure on the top slab ... 277 Figure 6.41:Effect of foundation location (H=BF) on the soil pressure on the side wall ... 277 Figure 6.42:Effect of foundation location (H=1.67BF) on the soil pressure on the top slab ... 278 Figure 6.43:Effect of foundation location (H=1.67BF) on the soil pressure on the side wall ... 278 Figure 6.44:Effect of the Foundation location on the soil culvert interaction factors Fe on the top slab (H/BF = 0.5) ... 279
Figure 6.45:Effect of the Foundation location on the soil culvert interaction factors Fe on the top slab (H/BF = 1.0) ... 280 Figure 6.46:Effect of the Foundation location on the soil culvert interaction factors Fe on the top slab (H/BF = 1.67) ... 280 Figure 6.47:Effect of the Foundation location on the soil culvert interaction factors Fe on the side wall at rest pressure Ko (H/BF = 0.5) ... 281 Figure 6.48:Effect of the Foundation location on the soil culvert interaction factors Fe on the side wall at rest pressure Ko (H/BF = 1.0) ... 281 Figure 6.49:Effect of the Foundation location on the soil culvert interaction factors Fe on the side wall at rest pressure Ko (H/BF = 1.67) ... 282 Figure 6.50:Effect of the Foundation location on the soil culvert interaction factors Fe on the top slab (Left Edge)... 282 Figure 6.51:Effect of the Foundation location on the soil culvert interaction factors Feon the top slab (Right Edge) ... 283 Figure 6.52:Effect of the Foundation location on the soil culvert interaction factors Fe on the top slab (Center) ... 283 Figure 6.53:Effect of the Foundation location on the soil culvert interaction factors Feon the side wall at rest pressure Ko (Top) ... 284
Figure 6.54:Effect of the Foundation location on the soil culvert interaction factors Fe on the side wall at rest pressure Ko (Bottom)... 284
xxii
Figure 6.57:Effect of soil elastic modulus on soil culvert interaction factors Fe ... 287 Figure 6.58:Effect of Poisson’s ratio on the bending moment on the top slab and side wall .... 288 Figure 6.59:Effect of Poisson’s ratio on the soil pressure on the top slab and side wall ... 289 Figure 6.60:Effect of the Poisson’s ratio on the soil culvert interaction factors Fe ... 289 Figure 6.61: Effect of H/Bc ratio on PGA values for Free and Structural Fields ... 291 Figure 6.62:Comparison of computed seismic bending moment from FLAC 2D and CHBDC due to KEQH on the top slab for H/Bc = 0 ... 292 Figure 6.63:Comparison of computed seismic bending moment from FLAC 2D and CHBDC
due to KEQH on the side wall for H/Bc = 0 ... 292 Figure 6.64:Computed static, seismic and total bending moments on the top slab for H/Bc = 0 ... 294 Figure 6.65:Computed static, seismic and total bending moments on the side wall for H/Bc = 0 ... 294 Figure 6.66:Effect of H/Bc ratio on the seismic bending moments on top slab ... 295 Figure 6.67:Effect of H/Bc ratio on the seismic bending moments on side wall ... 295 Figure 6.68:Effect of H/Bc ratio on the total bending moments on the top slab ... 296 Figure 6.69:Effect of H/Bc ratio on the total bending moments on the side wall ... 296 Figure 6.70:Effect of H/Bc ratio on the static bending moment from FLAC 2D on the top slab ... 299 Figure 6.71:Effect of H/Bc ratio on the static bending moment from FLAC 2D on the side wall ... 299 Figure 6.72:Effect of H/Bc ratio on the seismic bending moment on the top slab ... 300 Figure 6.73:Effect of H/Bc ratio on the seismic bending moment on the side wall ... 300 Figure 6.74:Effect of H/Bc ratio on the total bending moment from on the top slab ... 301 Figure 6.75:Effect of H/Bc ratio on the total bending moment on the side wall ... 301 Figure 6.76:Effect of H/Bc ratio on ratio of seismic to static bending moment on the top slab 302
Figure 6.77:Effect of H/Bc and ratio of seismic to static bending moment on the side wall .... 302 Figure 6.78:Computed seismic bending moments on the top slab for t/Bc = 0.02 ... 304
xxiii
Figure 6.81: Computed static, seismic and total bending moments on the side wall for t/Bc = 0.02 ... 306 Figure 6.82:Effect of t/Bc ratio on the seismic bending moments on the top slab ... 307 Figure 6.83:Effect of t/Bc ratio on the seismic bending moments on the side wall ... 307 Figure 6.84:Effect of t/Bc ratio on the total bending moments on the top slab ... 308 Figure 6.85:Effect of t/Bc ratio on the total bending moments on the side wall ... 308 Figure 6.86:Effect of t/Bc ratio on the static bending moment on the top slab ... 310 Figure 6.87:Effect of t/Bc ratio on the static bending moment from FLAC 2D on the side wall
... 310 Figure 6.88:Effect of t/Bc ratio on the seismic bending moment from FLAC 2D due to KEQH on the top slab ... 311 Figure 6.89: Effect of t/Bc ratio on the seismic bending moment from FLAC 2D due to KEQH on the side wall ... 311 Figure 6.90:Effect of t/Bc ratio on the total bending moment on the top slab ... 312 Figure 6.91: Effect of t/Bc ratio on the total bending moment on the side wall ... 312 Figure 6.92:Effect of t/Bc ratio on ratio of seismic to static bending moment on the top slab . 313 Figure 6.93:Effect of t/Bc ratio on ratio of seismic to static bending moment on the side wall 313 Figure 6.94:Three Dimensional representation of the Fe values as a function of H/Bc and t/Bc ratios. ... 317 Figure 6.95:The resulting static soil pressure, shear force and bending moment diagrams. ... 320 Figure A.1: Surface preparation for strain gauge installation ... 348 Figure A.2:Strain gauge transfer plate attached to a glass plate using PCT-2M tape ... 349 Figure A.3:Marking strain gauge locations ... 350 Figure A.4:Positioning the Light Weight Plastic Rubbing Plate over the Strain Gauge Transfer Plate... 351 Figure A.5:Mounting and checking the strain gauges on the tape ... 352
Figure A.6:Positioning the strain gauges inside the culvert model ... 353 Figure A.7:Applying Teflon sheet and rubber over the strain gauges ... 354
xxiv
Figure A.11:Strain gauge wiring and connecting to DAQ ... 358 Figure A.12: Protective coating applied to the strain gauges ... 359 Figure B.1: Settlement recorded from 1g to 60g for Tests 1 and 2 (Model Scale) ... 361 Figure B.2:Settlement recorded from 1g to 60g for Tests 3 and 4 (Model Scale) ... 362 Figure B.3:Settlement recorded at 60g for Test 1 Case A (Prototype Scale) ... 363 Figure B.4:Settlement recorded at 60g for Test 1 Case C (Prototype Scale) ... 364 Figure B.5:Settlement recorded at 60g for Test 2 Case A (Prototype Scale) ... 365 Figure B.6:Settlement recorded at 60g for Test 2 Case C (Prototype Scale) ... 366
Figure B.7:Settlement recorded at 60g for Test 3 Case A (Prototype Scale) ... 367 Figure B.8:Settlement recorded at 60g for Test 3 Case C (Prototype Scale) ... 368 Figure B.9:Settlement recorded at 60g for Test 3 Case D (Prototype Scale) ... 369 Figure B.10:Settlement recorded at 60g for Test 4 Case A (Prototype Scale) ... 370 Figure B.11:Settlement recorded at 60g for Test 4 Case C (Prototype Scale) ... 371 Figure B.12:Settlement recorded at 60g for Test 4 Case D (Prototype Scale) ... 372 Figure C.1: Acceleration, velocity, and displacement time histories with their frequencies and spectral responses for Test 2 Case C and the earthquake WCL ... 374 Figure C.2:Acceleration, velocity, and displacement time histories with their frequencies and spectral responses for Test 2 Case C and the earthquake WCM ... 375 Figure C.3:Acceleration, velocity, and displacement time histories with their frequencies and spectral responses for Test 2 Case C and the earthquake VCL ... 376 Figure C.4:Acceleration, velocity, and displacement time histories with their frequencies and spectral responses for Test 2 Case C and the earthquake VCM ... 377 Figure C.5:Acceleration, velocity, and displacement time histories with their frequencies and spectral responses for Test 2 Case C and the earthquake KEQL ... 378 Figure C.6:Acceleration, velocity, and displacement time histories with their frequencies and spectral responses for Test 2 Case C and the earthquake KEQM ... 379
Figure C.7:Acceleration, velocity, and displacement time histories with their frequencies and spectral responses for Test 2 Case C and the earthquake KEQH) ... 380
xxv
Figure D.2:Profile of PGA, PGV, and PGD for all earthquakes considered in Test 1 Case C, Free Field (FF) and Structural Field (SF) profiles ... 383 Figure D.3:Profile of PGA, PGV, and PGD for all earthquakes considered in Test 2 Case A, Free Field (FF) and Structural Field (SF) profiles ... 384 Figure D.4:Profile of PGA, PGV, and PGD for all earthquakes considered in Test 2 Case C, Free Field (FF) and Structural Field (SF) profiles ... 385 Figure D.5:Profile of PGA, PGV, and PGD for all earthquakes considered in Test 3 Case A, Free Field (FF) and Structural Field (SF) profiles ... 386
Figure D.6:Profile of PGA, PGV, and PGD for all earthquakes considered in Test 3 Case C, Free Field (FF) and Structural Field (SF) profiles ... 387 Figure D.7:Profile of PGA, PGV, and PGD for all earthquakes considered in Test 3 Case D, Free Field (FF) and Structural Field (SF) profiles ... 388 Figure D.8:Profile of PGA, PGV, and PGD for all earthquakes considered in Test 4 Case A, Free Field (FF) and Structural Field (SF) profiles ... 389 Figure D.9:Profile of PGA, PGV, and PGD for all earthquakes considered in Test 4 Case C, Free Field (FF) and Structural Field (SF) profiles ... 390 Figure D.10:Profile of PGA, PGV, and PGD for all earthquakes considered in Test 4 Case D, Free Field (FF) and Structural Field (SF) profiles ... 391 Figure E.1: PGA, PGV, and PGD resulted from the horizontal accelerometers on both sides of the box culvert for all the shakings in Test 1 Case A. ... 393 Figure E.2:PGA, PGV, and PGD resulted from the vertical accelerometers on both sides of the box culvert for all the shakings in Test 1 Case A. ... 394 Figure E.3:PGA, PGV, and PGD resulted from the horizontal accelerometers on both sides of the box culvert for all the shakings in Test 1 Case C... 395 Figure E.4:PGA, PGV, and PGD resulted from the vertical accelerometers on both sides of the box culvert for all the shakings in Test 1 Case C. ... 396
Figure E.5:PGA, PGV, and PGD resulted from the horizontal accelerometers on both sides of the box culvert for all the shakings in Test 2 Case A. ... 397
xxvi
Figure E.7:PGA, PGV, and PGD resulted from the horizontal accelerometers on both sides of the box culvert for all the shakings in Test 2 Case C... 399 Figure E.8:PGA, PGV, and PGD resulted from the vertical accelerometers on both sides of the box culvert for all the shakings in Test 2 Case C. ... 400 Figure E.9:PGA, PGV, and PGD resulted from the horizontal accelerometers on both sides of the box culvert for all the shakings in Test 3 Case A. ... 401 Figure E.10:PGA, PGV, and PGD resulted from the vertical accelerometers on both sides of the box culvert for all the shakings in Test 3 Case A. ... 402
Figure E.11:PGA, PGV, and PGD resulted from the horizontal accelerometers on both sides of the box culvert for all the shakings in Test 3 Case C... 403 Figure E.12:PGA, PGV, and PGD resulted from the vertical accelerometers on both sides of the box culvert for all the shakings in Test 3 Case C. ... 404 Figure E.13:PGA, PGV, and PGD resulted from the horizontal accelerometers on both sides of the box culvert for all the shakings in Test 3 Case D. ... 405 Figure E.14:PGA, PGV, and PGD resulted from the vertical accelerometers on both sides of the box culvert for all the shakings in Test 3 Case D. ... 406 Figure E.15:PGA, PGV, and PGD resulted from the horizontal accelerometers on both sides of the box culvert for all the shakings in Test 4 Case A. ... 407 Figure E.16:PGA, PGV, and PGD resulted from the vertical accelerometers on both sides of the box culvert for all the shakings in Test 4 Case A. ... 408 Figure E.17:PGA, PGV, and PGD resulted from the horizontal accelerometers on both sides of the box culvert for all the shakings in Test 4 Case C... 409 Figure E.18:PGA, PGV, and PGD resulted from the vertical accelerometers on both sides of the box culvert for all the shakings in Test 4 Case C. ... 410 Figure E.19:PGA, PGV, and PGD resulted from the horizontal accelerometers on both sides of the box culvert for all the shakings in Test 4 Case D. ... 411
Figure E.20:PGA, PGV, and PGD resulted from the vertical accelerometers on both sides of the box culvert for all the shakings in Test 4 Case D. ... 412
xxvii
Figure H.1: Comparison of bending moment on the top slab and side wall ... 419 Figure H.2:Comparison of bending moment on the top slab and side wall ... 420 Figure I.1: 3rd order polynomial fitting of moment resulted from strain data and comparison of the resulted pressure with the measured pressure on the top slab for Test 1 Cases A, B and C . 422 Figure I.2:4th order polynomial fitting of moment resulted from strain data and comparison of the resulted pressure with the measured pressure on the top slab for Test 1 Cases A, B and C . 423 Figure I.3:Cubic Spline fitting of moment resulted from strain data and comparison of the resulted pressure with the measured pressure on the top slab for Test 1 Cases A, B and C ... 424
Figure I.4:FLAC 2D results fitting the moment resulted from strain data and comparison of the resulted pressure with the measured pressure on the top slab for Test 1 Cases A, B and C ... 425 Figure J.1: Comparison of the average tactile pressure on the top slab and side wall for all the Test cases ... 427 Figure K.1: Comparison of the average tactile pressure on top slab and side wall ... 429 Figure K.2:Comparison of the average tactile pressure on top slab and side wall ... 430 Figure L.1: Comparison of the average tactile pressure on top slab and side wall... 432 Figure L.2:Comparison of the average tactile pressure on top slab and side wall... 433 Figure M.1: Comparison of pressures on the top slab and side wall for Test 1... 435 Figure M.2: Comparison of pressures on the top slab and side wall for Test 2... 436 Figure M.3: Comparison of pressures on the top slab and side wall for Test 3... 437 Figure M.4:Comparison of pressures on the top slab and side wall for Test 4... 438 Figure N.1: Effect of g-level: Comparison of measured seismic bending moments on the top slab and side wall for Case A of Test 1 ... 440 Figure N.2:Effect of g-level: Comparison of measured seismic bending moments on the top slab and side wall for Case C of Test 1 ... 441 Figure N.3:Effect of g-level: Comparison of measured seismic bending moments on the top slab and side wall for Case A of Test 2 ... 442
Figure N.4:Effect of g-level: Comparison of measured seismic bending moments on the top slab and side wall for Case C of Test 2 ... 443
xxviii
Figure N.6:Effect of g-level: Comparison of measured seismic bending moments on the top slab and side wall for Case C of Test 3 ... 445 Figure N.7:Effect of g-level: Comparison of measured seismic bending moments on the top slab and side wall for Case D of Test 3 ... 446 Figure N.8:Effect of g-level: Comparison of measured seismic bending moments on the top slab and side wall for Case A of Test 4 ... 447 Figure N.9:Effect of g-level: Comparison of measured seismic bending moments on the top slab and side wall for Case C of Test 4 ... 448
Figure N.10:Effect of g-level: Comparison of measured seismic bending moments on the top slab and side wall for Case D of Test 4 ... 449 Figure O.1: Effect of Thickness: Comparison of measured seismic bending moments on the top
slab and side wall for Case A of Tests 1 and 4 451
Figure O.2:Effect of Thickness: Comparison of measured seismic bending moments on the top slab and side wall for Case A of Tests 1 and 4 ... 452 Figure O.3:Effect of Thickness: Comparison of measured seismic bending moments on the top slab and side wall for Case C of Tests 1 and 4 ... 453 Figure O.4:Effect of Thickness: Comparison of measured seismic bending moments on the top slab and side wall for Case C of Tests 1 and 4 ... 454 Figure O.5:Effect of Thickness: Comparison of measured seismic bending moments on the top slab and side wall for Case A of Tests 2 and 3 ... 455 Figure O.6:Effect of Thickness: Comparison of measured seismic bending moments on the top slab and side wall for Case A of Tests 2 and 3 ... 456 Figure O.7:Effect of Thickness: Comparison of measured seismic bending moments on the top slab and side wall for Case C of Tests 2 and 3 ... 457 Figure O.8:Effect of Thickness: Comparison of measured seismic bending moments on the top slab and side wall for Case C of Tests 2 and 3 ... 458
Figure P.1: Comparison of measured versus computed bending moment on the top slab and side wall for Test 1 ... 460
xxix
Figure P.3:Comparison of measured versus computed bending moment on the top slab and side wall for Test 3 ... 462 Figure P.4:Comparison of measured versus computed bending moment on the top slab and side wall for Test 4 ... 463 Figure Q.1: Comparison of measured versus computed pressure on the top slab and side wall for Test 1 ... 465 Figure Q.2:Comparison of measured versus computed pressure on the top slab and side wall for Test 2 ... 466
Figure Q.3:Comparison of measured versus computed pressure on the top slab and side wall for Test 3 ... 467 Figure Q.4:Comparison of measured versus computed pressure on the top slab and side wall for Test 4 ... 468 Figure R.1: Comparison of measured versus computed seismic bending moment on the top slab and side wall for Case A of Test 1 ... 470 Figure R.2: Comparison of measured versus computed seismic bending moment on the top slab and side wall for Case A of Test 1 ... 471 Figure S.1: Comparison of FLAC 2D bending moments on the top slab and side wall ... 473 Figure S.2: Comparison of FLAC 2D bending moments on the top slab and side wall ... 474 Figure T.1: Comparison of the FLAC 2D soil pressures on top slab and side wall ... 476 Figure T.2: Comparison of the FLAC 2D soil pressures on top slab and side wall ... 477 Figure U.1: Comparison of computed seismic bending moment from FLAC 2D and from
CHBDC on the top slab and side wall for Case A of Test 1 ... 479 Figure U.2: Comparison of computed seismic bending moment from FLAC 2D and from
CHBDC on the top slab and side wall for Case A of Test 1 ... 480 Figure V.1: Comparison of computed static, seismic and total bending moments from FLAC 2D on the top slab and side wall for Case A of Test 1 ... 482
Figure V.2: Comparison of computed static, seismic and total bending moments from FLAC 2D on the top slab and side wall for Case A of Test 1 ... 483
Figure W.1: Comparison of computed seismic bending moment from FLAC 2D and from
xxx
Figure W.2: Comparison of computed seismic bending moment from FLAC 2D and from
CHBDC due to KEQH on the top slab and side wall ... 486 Figure X.1: Comparison of computed static, seismic and total bending moments from FLAC 2D due to KEQH on the top slab and side wall ... 488 Figure X.2: Comparison of computed static, seismic and total bending moments from FLAC 2D due to KEQH on the top slab and side wall ... 489 Figure Y.1: Comparison of computed seismic bending moment from FLAC 2D and from
CHBDC due to KEQH on the top slab and side wall ... 491
Figure Y.2: Comparison of computed seismic bending moment from FLAC 2D and from
xxxi
List of Tables
Table 2.1: Summary of pressure measurements from instrumented box culverts ... 30 Table 2.2: Density of Soil according to AASHTO Article 6.2 ... 55 Table 2.3: Arching factors for box sections in standard installations (from CHBDC, 2006)... 57 Table 2.4: Soils and compaction requirements for standard installations for concrete boxes (from CHBDC, 2006) ... 58 Table 2.5: Classification of placed soils (from CHBDC, 2006) ... 58 Table 3.1: Key Scaling relationships for the centrifuge modeling (Taylor, 1995) ... 83 Table 3.2: General properties of 120-Nevada Sand ... 85 Table 3.3: Properties of culvert models at model scale ... 87 Table 3.4: Properties of foundation models at model scale ... 90 Table 3.5: Strain gauge locations on the thick culvert ... 111 Table 3.6: Strain gauge locations on the thin culvert ... 111
1
CHAPTER ONE
INTRODUCTION
1.1 INTRODUCTION
Culverts are an important life lines in society, and are considered a critical part of
transportation infrastructure all over the world. They serve a significant role in modern infrastructure conveying water, sewerage, and sometimes pedestrians beneath roads, railways, span highways and other obstacles. They are also used to control water flow, storm runoff, divert municipal services, allow vehicular access and for other related activities. Culverts are largely unknown and unseen by the public, but are vital in managing waste, providing irrigation, and regular water levels. Often, culverts are buried beneath a substantial depth of overburden soil.
To design culverts for engineering purposes, most manufacturers use design methods based on formulas that assume simplified behaviors and often rely on considerable empiricism. Culverts can be built using different types of material, such as steel, aluminum, and concrete. They can take various geometric shapes like pipes, arches, ellipses, and boxes. Culverts of all shapes, sizes and materials are installed in new developments. Most drainage systems utilize concrete as the construction material, because of its inherent strength and durability.
Box culverts are constructed from short sections of reinforced concrete, which are joined together to form the final desired cross-section. The geometry of these structures is usually square or rectangular in cross-section and they can have single or multi-celled openings. The shape of a box culvert is designed to support loads above and around it, but they may be required to resist loads that are considerably higher, from other structures and construction activities.
Construction of reinforced concrete box culverts can be either cast-in-place or precast
concrete units. Nowadays, 80% of the single culvert installations are precast. They are considered to be efficient, since they reduce project execution time, and they are ideal when the
concrete batch plant is not near the construction site.
are a complex example of soil-structure interaction, where the relative stiffness between the backfill soil and the culvert materials is a critical factor in the load carrying capacity of culverts. The soil-structure interaction of buried box culverts is difficult to solve theoretically. No closed form solutions have been developed that adequately approximate the actual behavior. The loads attracted to buried structures, from both overburden and surcharge loads, are governed by the characteristics of soil and the geometry and stiffness of the structural components. Incompatibility in stiffness between the structure and the surrounding soil can lead to the redistribution of free-field stresses around the box culvert. This will result in a decrease in
loading over deflecting or yielding areas of the structure and an increase over adjoining rigid or stationary parts. This transfer of load due to soil-structure interaction is known as “Soil Arching”. Soil arching around box culverts can lead to either increased or decreased loading on
the structure. Detailed studies show the effect of soil-structure interaction mechanisms around box culverts under the effect of static and seismic loading are generally absent in the existing literature. Present design codes also include the effect of this interaction in a limited capacity, ignoring a number of important aspects.
Whilst there have been experimental and field studies to investigate stress distribution and arching (e.g. Lefebvre et al., 1976), the exact conditions required for this phenomenon to occur are still unclear and arching is often ignored in engineering design due to a lack of experience, and inclusion in codes of practice is rare. A range of problems such as underground conduits, tunnels, trapdoors, retaining walls and braced cuts can all experience significant arching action and theoretical analyses have been published on these subjects. These approaches have considered soil arching from both elastic and plastic soil states. Iglesia et al. (1999) presented a model for estimation of loads on underground structures based on the ground reaction curve (Einstein & Schwartz, 1979). Karinski et al. (2003) tried to develop an analytical model to evaluate the static soil pressure on the buried structures and they chose the box section as an example to find the pressure on the top and bottom slabs. They also tried to evaluate the positive
and negative arching. More recently, arching around buried structures has been studied in centrifuge model tests (e.g. Iglesia et al., 1999; Stone & Newson, 2002).
positive arching around deeply buried rigid box culverts was conducted by Kim and Yoo (2005), with emphasis on the imperfect trench method of construction. The current edition of the AASHTO (2002) standard specifications for highway bridges takes some account of arching by changing vertical stresses over box culverts based on Marston-Spangler theory. However, this approach is quite conservative compared to more sophisticated numerical techniques, such as finite difference and finite element analysis.
For the case of relatively flexible buried structures, the soil-structure interaction is even more complicated and the problem is difficult to solve theoretically or analytically. However, it
is relatively simple to examine the problem experimentally and in particular with a geotechnical centrifuge. Centrifuge facilities can offer the chance of building more realistic scaled physical models to represent the field situation and to investigate them under different conditions.
Failure of box culverts can cause large economic penalties, especially if the emergency replacement and the user daily costs which can be millions of dollars taking into consideration. The soil structure interaction can play an important role in defining the actual static and seismic loads that the culvert will be subjected to and that will help the engineer to design a more safe and economic structure.
1.2 RESEARCH OBJECTIVES
The main aim of this research is to investigate the Soil-Culvert-Interaction (SCI) mechanisms of buried reinforced concrete box culverts and their influence on the loads attracted to the structure. This investigation will lead to a better understanding of the behavior of the interaction between the soil and box culverts and its effect on the soil pressures attracted to them and the bending moments in their structural members. This investigation will be partly achieved by exploring the behavior and performance of model box culverts with different thicknesses supported by dry cohesionless soil under static and seismic loading in a series of centrifuge tests. To achieve this goal, the specific objectives of this study are:
1. To study the arching effect of soil around scaled model box culverts under static and seismic
2. To study the seismic response of scaled model box culverts under the effect of different earthquake loadings with different amplitudes and frequencies.
3. To compare between the effect of static and seismic loading on scaled model box culverts. 4. To develop a numerical model at the prototype scale, to be calibrated and validated by the
experimental results, to describe the effect of soil arching under static and seismic loadings in more detail by performing parametric studies.
5. To develop static and seismic design equations, procedures, guidelines and recommendations for consideration of soil pressures on box culverts and resulting bending
moments.
1.3 ORGANIZATION OF THE THESIS
This research is divided into seven main chapters that include details of the work performed. The contents of each chapter are as follows:
Chapter 1: provides a description of the problem, objectives of the research and the layout of the thesis.
Chapter 2: includes a comprehensive literature review of previous research work related to box culverts and current design approaches. This chapter begins by describing the phenomenon of arching around box culverts, and then it is divided into two parts; one for static loading and the other for the seismic loading. The static part includes the previous field instrumented box culvert tests, the equations derived for the soil structure interaction, and previous numerical and centrifuge tests. Descriptions of methods from codes and standards such as AASHTO and CHBDC for box culverts are also presented. In the seismic portion, a review of the performance of box culverts under the effect of previous earthquakes was reported, and then a description of previous shaking table tests on box culverts is presented. The concept of “racking” of rectangular buried structures is introduced since it is the only available closed-form
solution that can be applied for pseudostatic analysis. Nothing applicable to seismic loading on
box culverts is reported in any standards and codes, but some remarks and recommendations are also presented.
of the sensors and the instruments used in the centrifuge facility are explained in terms of their usage, calibration, and collection of the data. A newly developed technique for installing strain gauges inside box culvert tubes is also described in detail. A description of the one dimensional shaker that was used to excite the model using three different earthquakes (with different amplitudes and frequencies) is also presented.
Chapter 4: reports the results of the centrifuge tests. Results from varies sensors that were connected to the box culvert and foundation, or placed on the sand surface or imbedded inside it are presented. Analysis of bending moment and soil pressure attracted to the culvert under static
and seismic loads are also presented for different cases of relative densities and culvert thicknesses. Ground motion parameters, as well as dynamic soil properties of sand produced using the centrifuge results are analysed and presented, and compared to some well published data. Analysis of soil-structure factors and kinematic soil-structure interaction based on centrifuge test results are also discussed in this chapter. The effects of ground shaking on the culvert in terms of racking and the rocking of culvert and the surface foundation are also investigated.
Chapter 5: presents the numerical analysis of the experimental results of the centrifuge tests, using the finite difference method implemented in the FLAC 2D software. Details of the static and seismic models that include the mesh generation, boundary conditions, sand and structure properties, loads and earthquakes used are presented. Results of the numerical model were verified and calibrated, and compared to the results of the centrifuge tests. The effect of g level and frequency of earthquakes was also discussed in terms of its effect on the bending moments. The predicted and measured seismic bending moments are compared to the recommendations in CHBDC, (2006).
Chapter 6: includes a comprehensive parametric study for static and seismic numerical models. In this parametric study, different parameters related to the soil properties, culvert thicknesses, depth of the soil cover, and foundation location on the surface, are investigated and
described in this chapter.
Finally, Chapter 7: discusses the results that have been obtained from this research and