Western University Western University
Scholarship@Western
Scholarship@Western
Electronic Thesis and Dissertation Repository
11-26-2015 12:00 AM
Pulmonary Imaging to Better Understand Asthma
Pulmonary Imaging to Better Understand Asthma
Sarah Svenningsen
The University of Western Ontario
Supervisor Grace Parraga
The University of Western Ontario
Graduate Program in Medical Biophysics
A thesis submitted in partial fulfillment of the requirements for the degree in Doctor of Philosophy
© Sarah Svenningsen 2015
Follow this and additional works at: https://ir.lib.uwo.ca/etd
Part of the Medical Biophysics Commons, Respiratory System Commons, and the Respiratory Tract
Diseases Commons
Recommended Citation Recommended Citation
Svenningsen, Sarah, "Pulmonary Imaging to Better Understand Asthma" (2015). Electronic Thesis and Dissertation Repository. 3352.
https://ir.lib.uwo.ca/etd/3352
This Dissertation/Thesis is brought to you for free and open access by Scholarship@Western. It has been accepted for inclusion in Electronic Thesis and Dissertation Repository by an authorized administrator of
PULMONARY IMAGING TO BETTER UNDERSTAND ASTHMA
(Thesis format: Integrated Article)
by
Sarah Svenningsen, BMSc
Graduate Program in Medical Biophysics Schulich School of Medicine and Dentistry
A thesis submitted in partial fulfillment of the requirements for the degree of
Doctor of Philosophy
The School of Graduate and Postdoctoral Studies The University of Western Ontario
London, Ontario, Canada
i
Abstract
ii
Keywords
iii
Co-Authorship Statement
The following thesis contains four manuscripts: three manuscripts have been published in scientific journals and one manuscript has been prepared for submission for publication. As the first author of these peer-reviewed manuscripts, Sarah Svenningsen was a significant contributor to all facets of the studies and in turn, manuscript preparation and submission. Specifically, Sarah made intellectual contributions to all study designs and was responsible for subject recruitment, organization and management of all patient visits. Specific tasks included the acquisition of pulmonary function and MRI data. Following data acquisition, Sarah was responsible for database organization, data analysis and interpretation, clinical/physiological interpretation of the data, drafting and final approval of manuscripts. As the Principal Investigator and Supervisor, Dr. Grace Parraga provided ongoing guidance and was responsible for study conception and experimental design, data acquisition and analysis plan and interpretation, drafting and final revisions and approval of the manuscripts as well as guarantor of integrity of the data as well as responsible for Good Clinical Practice. The management of study visits and acquisition of pulmonary function data was performed under the supervision of Sandra Blamires. Polarization of the 3He and 129Xe gas was performed by Andrew Wheatley and Adam Farag. MRI acquisition was performed by Trevor Szekeres, Heather Biernaski and David Reese. For each manuscript contained in this thesis, all other co-authors approved the final draft of the manuscript and their specific contributions are listed below.
iv
Chapter 3 is an original research article entitled “Pulmonary Functional Magnetic Resonance Imaging: Asthma Temporal-Spatial Maps,” and was published in the journal
Academic Radiology in November 2014. This manuscript was co-authored by Sarah Svenningsen, Fumin Guo, Miranda Kirby, Stephen Choy, Andrew Wheatley, David G McCormack and Grace Parraga. Fumin Guo, Stephen Choy and Andrew Wheatley contributed to the development of the algorithm and assisted with data analysis. Miranda Kirby assisted with the algorithm design, statistical analysis of the data and interpretation. David G McCormack was responsible for clinical/physiological interpretation of the data. Chapter 4 is an original research article entitled “What are Ventilation Defects in Asthma?” and was published in the journal Thorax in January 2014. This manuscript was co-authored by Sarah Svenningsen, Miranda Kirby, Danielle Starr, Harvey O Coxson, Nigel AM Paterson, David G McCormack and Grace Parraga. Miranda Kirby assisted with the acquisition of data, statistical analysis and interpretation. Danielle Starr was responsible for CT airway segmentation, analysis and interpretation. Harvey O Coxson assisted with the interpretation of CT data. Nigel AM Paterson and David G McCormack were responsible for clinical/physiological interpretation of the data.
v
vi
Acknowledgments
I would like to thank my supervisor, Dr. Grace Parraga for providing me with this opportunity as well as continuous hands-on support and guidance throughout this endeavor. Again and again, you pushed me well-beyond my boundaries, resulting in countless opportunities and accomplishments that at one point I truly believed were not within my reach. Your wholehearted compassion for your research and your drive for discovery will forever encourage me to be engaged in work that I love, and for this I am grateful.
I am indebted to thank the members of my advisory committee, Drs. Hanif Ladak, Robert Bartha and Nigel Paterson. Thank you for being engaged in my research and career trajectory; your guidance and criticisms have been imperative to my development as a researcher, leader and communicator. I am especially grateful to Dr. David G McCormack for providing invaluable clinical insight into our research, our countless meetings were always a refreshing opportunity to talk big picture and impact. Furthermore, I am thankful for the professional mentorship, guidance and support that you provided.
vii
through abstract seasons, manuscript submissions, committee meetings and conference presentations. Your positive outlook through these hurdles was always inspiring, and is something I strive to emulate. To Khadija Sheikh and Dante Capaldi: I am grateful for our many interesting and insightful conversations over daily coffee runs and lunches. Thank you for always being willing to help; your contributions to my personal and academic endeavors were endless and I am very appreciative of this. To Fumin Guo: Thank you for your amusing poetry and late night coding sessions. Additional thanks go to my past and present teammates who were always a pleasure to work alongside: Amir Owrangi, Steve Costella, Daniel Buchanan, Tamas Lindenmaier, Gregory Paulin, Nanxi Zha, Emma Bluemke, Danielle Starr, Alexei Ouriadov, Megan Fennema, Eric Lessard, Rachel Eddy and David Tessier.
Most importantly, I would like to thank John, my family and my friends. Your patience, understanding and continued support have contributed significantly to my success. John: Thank you for holding my hand along this journey. Without you this would not have been a possibility for me. To my parents: Thank you for giving me the chance to pursue academics and providing me with the opportunity to focus on my goals.
viii
Table of Contents
Abstract ... i
Co-Authorship Statement... iii
Acknowledgments... vi
Table of Contents ... viii
List of Tables ... xii
List of Figures ... xiii
List of Abbreviations ... xv
List of Appendices ... xvii
CHAPTER 1 ... 1
1 INTRODUCTION ... 1
1.1 Motivation and Overview ... 1
1.2 The Respiratory System: Structure and Function ... 4
1.2.1 The Airways: Conducting and Respiratory Zones ... 4
1.2.2 Site of Gas Exchange: The Alveoli ... 6
1.2.3 Ventilation... 6
1.3 Pathophysiology of Asthma ... 7
1.3.1 Definition of Asthma ... 8
1.3.2 Causes and Risk ... 8
1.3.3 The Asthmatic Lung ... 9
1.4 Clinical Measurements of Asthma ... 11
1.4.1 Global Measurements of Pulmonary Function ... 11
1.4.2 Bronchial Responsiveness ... 16
1.4.3 Inflammation ... 18
1.4.4 Validated Questionnaires ... 19
1.5 Diagnosis and Classification of Asthma ... 21
1.5.1 Asthma Diagnosis ... 22
1.5.2 Asthma Control ... 22
ix
1.6 Treating Asthma... 24
1.6.1 Controller & Reliever Treatment ... 25
1.6.2 Add-on Treatments ... 26
1.7 Imaging Asthma ... 29
1.7.1 Plain X-ray ... 29
1.7.2 X-ray Computed Tomography ... 30
1.7.3 Nuclear Medicine ... 34
1.7.4 Magnetic Resonance Imaging ... 36
1.8 Thesis Hypotheses and Objectives ... 43
1.9 References ... 46
CHAPTER 2 ... 72
2 HYPERPOLARIZED 3HE AND 129XE MRI: DIFFERENCES IN ASTHMA BEFORE BRONCHODILATION ... 72
2.1 Introduction ... 72
2.2 Materials and Methods ... 74
2.2.1 Subjects and Study Design... 74
2.2.2 Image Acquisition ... 74
2.2.3 Image Analysis... 76
2.2.4 Statistical Analysis ... 77
2.3 Results ... 78
2.4 Discussion ... 84
2.5 References ... 89
CHAPTER 3 ... 96
3 PULMONARY FUNCTIONAL MAGNETIC RESONANCE IMAGING: ASTHMA TEMPORAL-SPATIAL MAPS ... 96
3.1 Introduction ... 96
3.2 Materials and Methods ... 97
3.2.1 Study Design ... 97
3.2.2 Magnetic Resonance Imaging ... 98
x
3.2.4 Registration Performance Evaluation ... 101
3.2.5 Statistical Analysis ... 101
3.3 Results ... 101
3.3.1 Temporal-Spatial Pulmonary Function Maps ... 105
3.4 Discussion ... 108
3.5 References ... 112
CHAPTER 4 ... 116
4 WHAT ARE VENTILATION DEFECTS IN ASTHMA? ... 116
4.1 Introduction ... 116
4.2 Methods... 117
4.2.1 Study Subjects ... 117
4.2.2 Pulmonary Function Tests ... 118
4.2.3 Magnetic Resonance Imaging ... 118
4.2.4 Computed Tomography ... 119
4.2.5 Statistical Analysis ... 122
4.3 Results ... 122
4.4 Discussion ... 128
4.5 References ... 132
4.6 Supplementary Material ... 137
CHAPTER 5 ... 138
5 WHAT DO VENTILATION DEFECTS REVEAL ABOUT ASTHMA CONTROL? ... 138
5.1 Introduction ... 138
5.2 Methods... 139
5.2.1 Study Participants and Design ... 139
5.2.2 Pulmonary Function Tests and Bronchial Challenge... 140
5.2.3 Lung Clearance Index ... 140
5.2.4 Magnetic Resonance Imaging ... 141
5.2.5 Statistical Analysis ... 141
xi
5.3.1 Study Participants ... 142
5.3.2 Ventilation Heterogeneity ... 143
5.3.3 Ventilation Heterogeneity and Asthma Control ... 145
5.3.4 Relationships ... 147
5.4 Discussion ... 149
5.5 References ... 153
5.6 Supplementary Material ... 157
CHAPTER 6 ... 159
6 Conclusions and Future Directions ... 159
6.1 Overview of Rationale and Research Questions ... 159
6.2 Summary and Conclusions ... 161
6.3 Limitations ... 162
6.3.1 Study Specific Limitations ... 163
6.3.2 General Limitations ... 167
6.4 Future Directions ... 169
6.4.1 Functional MRI of Ventilation in Asthma: Sensitivity, Specificity and Comparison with FEV1 ... 169
6.4.2 Efficacy of Functional MRI Guided Bronchial Thermoplasty ... 171
6.4.3 Imaging Exercise-induced and Methacholine-induced Bronchoconstriction using Hyperpolarized Gas MRI: Same Ventilation Defects or Not? ... 173
6.4.4 Functional MRI of Asthma: Alternative Approaches ... 175
6.5 Significance and Impact ... 176
6.6 References ... 178
xii
List of Tables
Table 1-1 Classification of asthma severity. ... 23
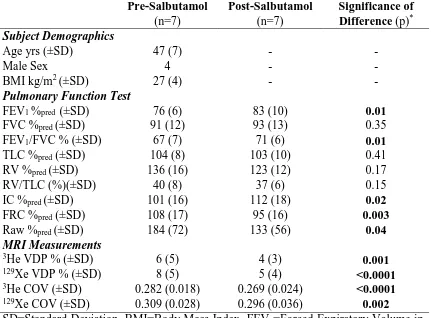
Table 2-1 Subject demographic characteristics, pulmonary function and MRI measurements. ... 78
Table 2-2 Pre- and post-salbutamol hyperpolarized 3He and 129Xe MRI measurements.82 Table 3-1 Subject demographic characteristics. ... 102
Table 3-2 Repeated spirometry and hyperpolarized 3He measurements. ... 102
Table 3-3 Subject listing of demographic, spirometry and hyperpolarized 3He MRI measurements. ... 103
Table 4-1 Subject demographic characteristics for asthmatics and healthy volunteers. 122 Table 4-2 Subject demographic characteristics, pulmonary function, hyperpolarized 3He MRI and x-ray CT airways measurements for asthmatics and healthy volunteers... 125
Table 4-3S Subject listing of demographic characteristics, pulmonary function and dyspnea. ... 137
Table 5-1 Participant demographics and asthma measurements. ... 142
Table 5-2 Asthma medication and control. ... 143
Table 5-3S Participant listing of demographic and other measurements. ... 157
xiii
List of Figures
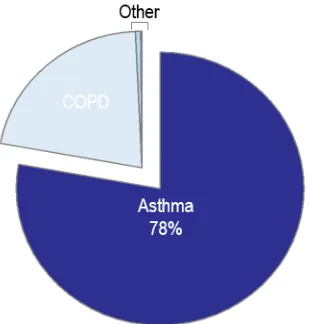
Figure 1-1 Proportion of all respiratory diseases due to specific conditions in Canada. .. 1
Figure 1-2 Repeat hospitalizations and hospitalization cases by age and condition in Canada... 2
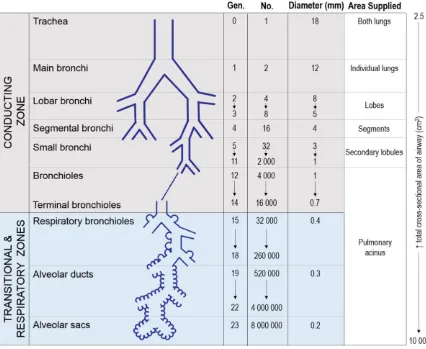
Figure 1-3 Characteristics of the air passages. ... 5
Figure 1-4 Airway pathology in a healthy and an asthmatic airway. ... 10
Figure 1-5 Handheld spirometer and typical volume-time spirogram tracing. ... 12
Figure 1-6 Body plethysmograph and typical volume-time spirogram tracing identifying lung volumes. ... 14
Figure 1-7 Example of a typical inert gas washout machine and inert gas multiple breath washout tracing. ... 15
Figure 1-8 Asthma is a heterogeneous disease consisting of several overlapping pathologies necessitating multiple biomarkers to accurately diagnose and phenotype patients. ... 21
Figure 1-9 2015 GINA stepwise approach to asthma treatment. ... 25
Figure 1-10 Representative posterior-anterior chest radiograph of a healthy volunteer and an asthmatic subject. ... 30
Figure 1-11 Axial CT of the right lower lobe in two representative asthmatics. ... 31
Figure 1-12 Three-dimensional quantitative CT of the lungs and airways in asthma. ... 32
Figure 1-13 Representative coronal conventional 1H MRI of a healthy volunteer and an asthmatic subject. ... 37
Figure 1-14 Representative coronal centre slice hyperpolarized 3He MRI of a healthy volunteer and an asthmatic subject. ... 40
Figure 1-15 Representative coronal centre slice hyperpolarized 3He MRI of an asthmatic subject at baseline, post-methacholine and post-salbutamol. ... 42
Figure 2-1 3He and 129Xe MRI pre- and post-salbutamol. ... 80
Figure 2-2 Bronchodilator response using hyperpolarized 3He and 129Xe MRI. ... 81
Figure 2-3 MRI and CT for two asthmatic subjects... 83
xiv
Figure 3-2 3He MRI co-registered to the corresponding 1H MRI acquired at visit 1-3, and the corresponding temporal-spatial pulmonary function maps for seven asthmatic subjects. ... 104
Figure 3-3 Three-dimensional 3He MRI temporal-spatial pulmonary function maps for three representative asthmatic subjects. ... 106
Figure 3-4 3He MRI intermittent ventilation defect percent (VDPI) and persistent
ventilation defect percent (VDPP) anatomical differences. ... 107
Figure 3-5 Relationship of 3He MRI temporal-spatial pulmonary function with airflow obstruction at baseline and following exercise challenge. ... 108
Figure 4-1 Schematic for 3He MRI – Regional CT image acquisition, co-registration and analysis. ... 121
Figure 4-2 Hyperpolarized 3He MRI of a representative healthy volunteer and asthmatic subjects. ... 124
Figure 4-3 Relationships of MRI and CT measurements with FEV1 and airways
resistance. ... 126
Figure 4-4 Relationship between 3He MRI VDP and CT-derived wall area percent (WA%) ... 127
Figure 4-5 Spatial relationship between ventilation defects and airways for four
representative asthmatics with ventilation defects. ... 128
Figure 5-1 Hyperpolarized 3He MRI of representative patients with severe asthma. ... 144
Figure 5-2 Ventilation heterogeneity stratified by ACQ and AQLQ scores and self-reported exacerbations. ... 146
Figure 5-3 Pre- and post-bronchodilator 3He ventilation MRI. ... 148
Figure 5-4 Relationship for ventilation heterogeneity and asthma control. ... 149
Figure 6-1 Performance of FEV1 and 3He MRI VDP as predictors of asthma (left plot) and bronchial hyperresponsiveness (right plot). ... 170
Figure 6-2 Spatial relationship between 3He MRI ventilation (blue), ventilation defects (green) and airways (yellow) for a representative subject with severe asthma three days prior to BT while on 50 mg of prednisone. ... 172
Figure 6-3 Representative coronal centre slice hyperpolarized 3He MRI of an asthmatic subject at baseline and following both methacholine and exercise-induced
xv
List of Abbreviations
AD Asthma Defect
ATS American Thoracic Society ACQ Asthma Control Questionnaire
AQLQ Asthma Quality-of-Life Questionnaire BT Bronchial Thermoplasty
BMI Body Mass Index
CEV Cumulative Expired Volume
COPD Chronic Obstructive Pulmonary Disease COV Coefficient of Variation
CT Computed Tomography
ED Emergency Department
EPR-3 Expert Panel Report 3
FeNO Fractional Exhaled Nitric Oxide
FEV1 Forced Expiratory Volume in One Second FRC Functional Residual Capacity
FVC Forced Vital Capacity GINA Global Initiative for Asthma IC Inspiratory Capacity
LA Lumen Area
LABA Long Acting Beta-agonist LCI Lung Clearance Index
LTRA Leukotriene Receptor Antagonist MBNW Multiple Breath Nitrogen Washout
MCT Methacholine Test
MRI Magnetic Resonance Imaging
ND No Defect
NHLBI National Heart, Lung, and Blood Institute
NO Nitric Oxide
PC20 Provocative Concentration required to decrease FEV1 by 20% PET Positron Emission Tomography
Raw Airway Resistance
RG Regional
ROI Region-Of-Interest
RV Residual Volume
SD Standard Deviation
SABA Short Acting Beta-agonist SNR Signal-to-Noise Ratio
SPECT Single Photon Emission Tomography sRaw Specific Airway Resistance
TRE Target Registration Error TLC Total Lung Capacity VDP Ventilation Defect Percent
xvi
VDV Ventilation Defect Volume
VD Dead Space Volume
VT Total Volume
WA% Wall Area Percent
WL Whole Lung
WT Wall Thickness
N2 Nitrogen
1H Proton
3He Helium-3
4He Helium-4
xvii
List of Appendices
APPENDIX A – Permission for Reproduction of Scientific Articles ... 184
APPENDIX B – Health Science Research Ethics Board Approval Notices ... 187
1
CHAPTER 1
Asthma is a chronic and phenotypically heterogeneous disease of intermittent respiratory symptoms and airflow limitation triggered by various stimuli, and is characterized by bronchial hyperresponsiveness and airways inflammation.1,2
1
INTRODUCTION
1.1
Motivation and Overview
Asthma is the most common chronic respiratory disease in Canada, accounting for
approximately 80% of chronic respiratory disease,3 affecting 8.1% or 2.4 million Canadians in 2014 (Figure 1-1).4
Adapted from Life and Breath: Respiratory Disease in Canada 2008.5
2
(COPD) and angina.7 However, in contrast to COPD and angina, asthma-related hospitalizations are much more common under the age of 19, accounting for approximately 65% of all asthma admissions.7 Asthma was a contributing factor in approximately 10%
of hospital admissions for children under the age of 5 and 8% for those aged 5 to 14 years.5
In 1990, the estimated cost for asthma in Canada was $504 to $648 million, of which $306 million were direct costs.8 A study by Ismalia and colleagues indicated that the annual direct cost per asthma patient in Canada ranges from $366 to $647.9
Figure 1-2 Repeat hospitalizations and hospitalization cases by age and condition in Canada.
The left plot shows the number of patients with a single hospitalization, one repeat hospitalization and two or more repeat hospitalization by condition at first admission. The right plot shows the distribution of hospitalization cases by condition and age. Adapted from the Canadian Institute for Health Information’s (CIHI) publication entitled Health Indicators 2008.7
3
and lung function decline. In other words, using current clinical tools, there is no way to measure regional lung abnormalities in asthma, making it difficult if not impossible to develop, test and guide regional asthma therapies. Satisfying the uncertain notion that all airways in asthma are equally abnormal and exhibit the same temporal behavior, current therapies are geared to all airways.
Pulmonary functional magnetic resonance imaging (MRI), using inhaled helium-3 (3He) and xenon-129 (129Xe) gas, provides a way to quantify gas distribution in vivo and it has the advantage that it shows exactly where functional abnormalities, termed “ventilation defects,” are located in the asthmatic lung. In spite of this potential, medical imaging has played a very limited role in asthma research, treatment development and patient care, and for a variety of reasons, the numerous advantages of imaging have not been translated to clinical use. Regardless of the gas used for imaging, the exact etiology of ventilation defects in asthma is poorly understood. A clear understanding of ventilation defects is absolutely necessary prior to the clinical translation of hyperpolarized gas imaging methods. Armed with such an understanding, there is the potential to use functional MRI to guide asthma treatment, predict treatment outcomes, identify new treatment targets and better understand the asthmatic lung regionally and its response to asthma treatment. With the challenges impeding clinical translation in mind, the overarching objective of this thesis was to better understand the underlying structural determinants and clinical consequences of MRI ventilation defects observed in asthma and to provide a foundation for imaging to guide clinical decisions and asthma therapy.
In this Chapter, the relevant background knowledge necessary to understand and motivate the original research presented in Chapters 2 to 5 will be summarized. It will begin with a general overview of the respiratory system’s structural and functional responsibilities (1.2)
before focusing on the pathophysiology and underlying disease mechanisms of asthma
4
1.2
The Respiratory System: Structure and Function
Similar to all organ systems, the functions of the respiratory system are multifaceted and range from protection against inhaled pathogens to gas exchange. While the respiratory system includes the oral and nasal cavities, the lungs, the airways and the muscles responsible for facilitating breathing, here I will elaborate on the structure and function of the airways and the alveoli. The airways are a pipeline which connect the external environment with the alveoli where gas exchange can occur across the blood-gas interface. By the process of ventilation, the main function of the airways and the alveoli is to deliver oxygen and remove carbon dioxide from the blood to maintain normal partial pressure of oxygen and carbon dioxide levels in the arterial blood.
1.2.1
The Airways: Conducting and Respiratory Zones
Inhaled air enters the respiratory system via the nasal or oral passages which converge on the pharynx followed by the larynx. Beyond the upper airways, as shown in Figure 1-3,
the lower airways are divided into the conducting zone and the respiratory zone based on their structural and functional characteristics. The conducting zone is responsible for carrying inhaled air to the respiratory zone where gas exchange can occur.
Conducting Zone
5
they become narrower, shorter and more numerous as they branch dichotomously to reach all areas of the lung. Secondary lobules or lung sub-segments are supplied by the small bronchi. It is at this point where important structural changes occur. Beyond the small bronchi, the air passages no longer contain cartilage but become embedded in the lung parenchyma for structural support. Terminal bronchioles are the smallest category of air passages without alveoli and are the final conduit of the conducting zone.
Figure 1-3 Characteristics of the air passages.
6
Respiratory Zone
The respiratory zone is the last seven generations (generations 17-23) of the airway tree.10 In contrast to the conducting zone, the air passages of the respiratory zone contain alveoli which facilitate gas exchange. As shown in Figure 1-3, the respiratory bronchioles begin the respiratory zone and have an increasing number of alveoli budding from their muscular walls before giving rise to the alveolar ducts which precede the alveolar sacs that are completely lined with alveoli. A pulmonary acinus is considered a single anatomical unit consisting of a terminal bronchiole and its subsequent respiratory bronchioles, alveolar ducts and sacs. The average human lung contains 30,000 acini,12 each containing approximately 10,000 alveoli which together make up most of the lung volume, ranging from approximately 2.5 to 3 L at rest.10
1.2.2
Site of Gas Exchange: The Alveoli
The alveoli are the site of gas exchange and are the terminal ends of the airway tree found on the respiratory bronchioles, alveolar ducts and alveolar sacs. It has been estimated that 480 million (range: 274-790 million) alveoli exist in the average human lung and that the average size of a single alveolus is 4.2x106 µm3 (range: 3.3-4.8 µm3) or 200 µm in diameter.13 The blood-gas interface of the alveoli is comprised of two layers: the alveolar epithelium and the capillary endothelium, which facilitates the movement of oxygen and carbon dioxide between the alveolar airspace and capillary plasma. This interface is extremely thin (0.2-0.3 µm) with a large surface area (50-100 m2), making it well-suited for efficient exchange of oxygen and carbon dioxide by passive diffusion, according to the principles of Fick’s law.
1.2.3
Ventilation
7
conducting and respiratory zones upon inspiration is termed tidal volume (VT) and is approximately 0.5 L. As shown in Equation 1-1, total ventilation is the total volume of air leaving the lungs each minute and is calculated as the ventilation rate multiplied by VT.
Equation 1-1
Total ventilation [L/minute]= Ventilation rate × VT
As discussed above, with each exhalation, approximately 0.15 L of “stale” air from the respiratory zone remains in the conducting airways and is first to commute back to the alveoli upon subsequent inspiration. As shown in Equation 1-2, alveolar ventilation represents the amount of “fresh” air that reaches the alveoli to participate in gas exchange and it is therefore used to more accurately quantify ventilation efficiency by taking into account the dead space volume (VD).
Equation 1-2
Alveolar ventilation [L/minute]= Ventilation rate × (VT− VD)
For a healthy adult, the ventilation rate, VT and VD are 12-20 breaths/minute, 0.5 L and 0.15 L respectively.14 At 15 breaths/minute, the total ventilation is 7.50 L/minute and the alveolar ventilation is 5.25 L/minute. This means that although 7.5 L of fresh air enters the respiratory system, only 5.25 L actually reach the alveoli.
1.3
Pathophysiology of Asthma
The word “asthma” originated from the Greek word aazein, meaning “to breathe with open mouth or to pant” generalizing that any patient experiencing dyspnea was asthmatic.15 Given that asthma is as old as antiquity, it is not surprising that the definition and our understanding of the disease has evolved significantly from initial accounts as evidenced by the quotes below. Today, with nearly 300 million asthmatics globally, confusion and controversy continue to surround the definition of asthma.16
“Asthma is the inability to breathe without making noise.”
Aulus Cornelius, 1st Century BC
“If from running, gymnastic exercises, or any other work, the breathing becomes difficult, it is called Asthma.”
8
“Asthma is paroxysmal dyspnea of a peculiar character, generally periodic, with intervals of healthy respiration between attacks.”
Henry Hyde Salter, 1860
“Asthma is a special form of inflammation of the small bronchioles.”
Sir William Osler, 1892
“Asthma is a disease characterized by an increased responsiveness of the trachea and bronchi to various stimuli and manifested by widespread narrowing of the airways that changes in severity either spontaneously or as a result of therapy.
American Thoracic Society, 1962
1.3.1
Definition of Asthma
In the 2015 Global Initiative for Asthma (GINA) report, the Global Strategy for Asthma Management and Prevention,1 asthma is defined as: “A heterogeneous disease usually
characterized by chronic airway inflammation. It is defined by a history of respiratory
symptoms such as wheeze, shortness of breath, chest tightness and cough that vary over
time and in intensity, together with variable expiratory airflow limitation.” This definition consists of four components: symptoms, variable airflow obstruction, airway hyperresponsiveness and airway inflammation.17 As described in the literature, this relatively broad and non-specific definition encompasses many different asthma phenotypes identified according to environmental triggers, inflammatory processes and clinical features. In a recent review highlighting the heterogeneity of asthma, common clinical phenotypes were classified as trigger-induced phenotypes (occupational asthma, cigarette smoke induced asthma, air pollution induced asthma and exercise induced asthma), symptom-based phenotypes (exacerbation-prone, persistent airflow limitation, cough-variant, adult-onset and the obese asthma) and biomarker-based phenotypes (eosinophilic and neutrophilic asthma).18 Phenotyping of asthma is becoming more important than ever due to the development of targeted and phenotype specific approaches to asthma therapy.
1.3.2
Causes and Risk
9
and poorly understood. Numerous host factors have been identified that influence the risk of asthma; these include genetic polymorphisms,20,21 family history of asthma,22 sex,23 race24 and obesity.25 Similarly, numerous environmental factors have been identified that influence the risk of asthma; these include aeroallergen sensitization,26 respiratory viruses,27,28 early life microbial exposures,29,30 cigarette smoke,31 air pollution,32 vitamin D deficiency,33 antioxidants34 and stress.35
1.3.3
The Asthmatic Lung
10
Figure 1-4 Airway pathology in a healthy and an asthmatic airway.
Histological (sectioned and stained using Movat’s pentachrome stain) and corresponding schematic representation of airway structures in healthy and asthmatic airways. The asthmatic airway has structural remodeling, including goblet cell hyperplasia, subepithelial fibrosis and increased smooth muscle.
Adapted from JV Fahy Nature Reviews 2015.42
11
E (IgE) is the antibody responsible for activation of allergic reactions and is important in the development of persistent inflammation.
1.4
Clinical Measurements of Asthma
Clinical measurements of asthma play an important role in diagnosis, categorizing disease severity and evaluating the effectiveness of medications to manage disease. Currently, no single clinical tool can be used to adequately diagnose and manage asthma. Instead, an integrated approach is employed which combines objective measurements of pulmonary function, bronchial responsiveness, airway inflammation and subjective symptom and quality-of-life questionnaires.
1.4.1
Global Measurements of Pulmonary Function
In a physician’s office and hospital pulmonary function laboratory, various aspects of lung function can be evaluated by performing cost-effective pulmonary function testing. Global spirometry measurements and lung volumes play an important role in the diagnosis and management of asthma. It is important to acknowledge that pulmonary function tests are dependent on patient effort, limiting their use in children and cognitively impaired populations. With appropriate coaching by a trained pulmonary function technologist, the majority of patients can perform adequate pulmonary function manoeuvres for which acceptability and reproducibility criteria have been published.
1.4.1.1
Spirometry
12
widely reported indices derived from the forced exhalation manoeuvre are the forced vital capacity (FVC), the FEV1 and the ratio of FEV1 to FVC (FEV1/FVC). As shown in Figure 1-5B, FVC is a measure of the total volume of air that can be forcefully exhaled from full inspiration, whereas FEV1 is a measure of the maximum volume of air that can be forcefully exhaled in the first second of the manoeuvre. Both FVC and FEV1 are measured in litres and are also commonly expressed as a percentage of the reference value based on the patient’s age, height, sex and ethnicity. Extensive spirometry standardization criteria have been compiled by the ATS/ERS Task Force and are now widely applied.43
Figure 1-5 Handheld spirometer and typical volume-time spirogram tracing. FEV1=forced expiratory volume in one second; FVC=forced vital capacity.
1.4.1.2
Lung Volumes and Capacities
13
breathing; ERV is the volume of gas that can be exhaled from the end of a normal exhalation during tidal breathing; VC is the volume of gas exchanged at the mouth between a full inspiration and full exhalation; IC is the volume of gas that can be inhaled from the end of a normal exhalation while tidal breathing; FRC is the volume of gas remaining in the lungs at the end of a normal exhalation while tidal breathing; RV is the volume of gas remaining in the lungs at the end of a full exhalation; and TLC is the volume of gas in the lungs at the end of a full inhalation.
As previously alluded to, alternative nitrogen washout, gas dilution or body plethysmography techniques are required to measure FRC, from which RV and TLC can subsequently be derived by performing “linked” spirometry manoeuvres.44 As shown in
14
Figure 1-6 Body plethysmograph and typical volume-time spirogram tracing identifying lung volumes.
TV=tidal volume; IRV=inspiratory reserve volume; ERV=expiratory reserve volume; VC=vital capacity; IC=inspiratory capacity; FRC=functional residual capacity; RV=residual volume; TLC=total lung capacity.
1.4.1.3
Airway Resistance
Airway resistance (Raw) is a measure of the resistance to flow within the airways and is defined in Equation 1-3 as the ratio of the driving force of airflow (difference in alveolar and mouth pressure) to the flow rate (measured at the mouth) and can be quantified using several techniques. Raw is influenced by resistance in the mouth, pharynx, larynx, large airways and small airways11 and is most commonly indirectly quantified using whole body plethysmography.45 Raw can be derived from the specific airway resistance (sRaw) and FRC as shown in Equation 1-4, both of which can be directly measured using plethysmography. sRaw is a corrected index that describes airway resistance regardless of lung volume.46 Following open shutter panting, the inverse slope of the plot of flow rate versus box pressure is sRaw. In healthy adults, Raw typically falls within 0.6-2.4 cmH2O·s·L-1.47 Both Raw and sRaw are increased in the presence of inflammation, mucus secretion, and bronchoconstriction.47
Equation 1-3
Airway resistance (Raw) [cmH2O·s·L-1]=
15
Equation 1-4
Airway resistance (Raw) [cmH2O·s·L-1]= Specific airway resistance(sRaw) [cmH2O·s]
Functional residual capacity (FRC)[L]
1.4.1.4
Inert Gas Washout
Single-breath48 and multiple-breath49 inert gas washout techniques (SBW and MBW, respectively) were first employed more than 65 years ago to measure lung volumes and ventilation heterogeneity. Although both tests are relatively simple, the MBW test is more informative and has been more commonly used. MBW involves measuring the washout concentration of an inert tracer gas from the lungs during normal tidal breathing. The tracer gas can be endogenous, such as nitrogen (N2), and washed-out of lungs by breathing 100% oxygen. Alternatively, if the tracer gas is exogenous, such as sulfur hexafluoride (SF6) or helium (He), it must be washed-in prior to being washed out of the lung by breathing room air. As shown in Figure 1-7, with each tidal breath of the washout phase, there is a decrease in the concentration of the exhaled tracer gas (N2 in this example) and when the gas concentration has decreased to 1/40th of the starting concentration, the test is complete. The manoeuvre is generally completed with the participant sitting upright and breathing through a mouthpiece while wearing nose clips.
Figure 1-7 Example of a typical inert gas washout machine and inert gas multiple breath washout tracing.
16
The most commonly reported MBW derived measurement is the lung clearance index (LCI), which is thought to be representative of whole lung ventilation heterogeneity.50 LCI is the number of FRC lung turnovers needed to clear the lungs of the inert marker gas and it is calculated as the cumulative expired gas volume (CEV) divided by FRC.51 Additional metrics that reflect ventilation heterogeneity in the conductive and acinar lung zones (Scond and Sacin, respectively) can be derived using sophisticated phase III slope analysis of the MBW tracing.52 Additional outcomes include FRC, trapped gas volume and closing capacity.
Inert gas washout measurements are becoming particularly attractive due to their feasibility in the pediatric population53,54 and increased sensitivity to early disease changes55,56 while offering complementary information to standard pulmonary function tests. Taken together, MBW indices of ventilation heterogeneity in asthmatics are elevated in comparison to healthy controls;57-59 are independent determinants of airway hyperresponsiveness;60 improve with bronchodilation57,61 and inhaled corticosteroids;62,63 and worsen during exacerbations.64 Unfortunately, these measurements cannot regionally localize the site of functional abnormalities.
1.4.2
Bronchial Responsiveness
Reversibility of airflow obstruction and bronchial hyperresponsiveness are features of asthma airway pathophysiology that can be objectively evaluated. The assessment of these disease characteristics are important for diagnosing asthma, categorizing disease severity and evaluating the effectiveness of asthma medications to manage disease.
1.4.2.1
Assessing Bronchodilator Reversibility
17
expressed as the absolute change in FEV1 and FVC or as a percent of the pre-bronchodilator value, as shown in Equation 1-5. It is generally accepted that a clinically-relevant positive bronchodilator response is warranted when the post-bronchodilator increase in FVC and/or FEV1 is ≥ 12% and 200mL from baseline.65
Equation 1-5
% reversibility=[(Post-bronchodilator value) − (Pre-bronchodilator value)
(Pre-bronchodilator value) ] ×100
1.4.2.2
Assessing Airway Hyperresponsiveness
In addition to bronchodilator reversibility, airway hyperresponsiveness is another defining characteristic of asthma.66 Methacholine and exercise challenge testing are two of the most widely used methods to assess airway hyperresponsiveness for which standardized guidelines have been published.67
Methacholine Challenge
Methacholine induces bronchoconstriction by acting on airway smooth muscle receptors. Similar to reversibility testing, a methacholine test (MCT) should be performed after the participant has withheld their medications for an appropriate duration as advised by ATS guidelines.67 Aerosolized methacholine is inhaled through a nebulizer and the MCT is completed according to the established two-minute tidal breathing or five-breath dosimeter protocol described in detail by ATS.67 Briefly, baseline spirometry is first performed to assess pre-MCT FEV1 and subsequently the diluent or first dose of methacholine (0.03mg/mL) is administered. After the nebulization has been completed, spirometry is repeated. If FEV1 has not declined by 20%, the next highest concentration of methacholine should be delivered. This procedure is repeated with increasing concentrations of methacholine until FEV1 has declined by more than 20% of baseline or until the highest concentration of methacholine (16mg/mL) has been reached.
18
≤4mg/mL is indicative of abnormal airway hyperresponsiveness.67 Intermediate values (< 16 and >4 mg/mL) indicate borderline airway hyperresponsiveness and should be interpreted with caution.67
Equation 1-6
PC20[mg/mL]=antilog[logC1+
(logC2-logC1)(20-R1)
R2-R1 ]
C1 = second-to-last methacholine concentration; C2 = last methacholine concentration; R1 = percent fall in FEV1 after C1; R2 = percent fall in FEV1 after C2.
Exercise Challenge
Exercise induces bronchoconstriction in approximately 80% of asthmatics.68 In contrast to methacholine, exercise is an indirect activator of smooth muscle constriction induced by airway dehydration and subsequent mediator release.69 Exercise challenge testing is preferentially performed using a treadmill or cycle ergometer as described in detail by ATS, although the protocols are not well standardized or uniformly implemented.67 Briefly, 6-8 minutes of exercise (4-6 minutes at a pre-determined target intensity) should be completed while breathing cool (<25ºC) dry air. The primary outcome measure for an exercise challenge is FEV1. A post-exercise decreased in FEV1 >10% is considered abnormal and a decrease >15% is indicative of exercise-induced bronchoconstriction.
1.4.3
Inflammation
1.4.3.1
FeNO
19
applications of FeNO are its ability to aid in the diagnosis of eosinophilic asthma and to predict corticosteroids-responsiveness. Asthmatics have higher levels of NO in their exhaled breath as compared to healthy controls.78,79 Although not all asthmatics have eosinophilic inflammation, those who do tend to have elevated FeNO levels and are much more likely to benefit from inhaled corticosteroid (ICS) therapy than those with normal FeNO levels.80 According to the 2011 ATS recommendations, FeNO < 25 ppb indicates that eosinophilic inflammation and responsiveness to corticosteroids are unlikely, whereas FeNO > 50 ppb indicates that eosinophilic inflammation and responsiveness to corticosteroids is likely.81 Intermediate values (≥ 25 and ≤ 50 ppb) should be interpreted with caution. Currently, a clinically important difference in FeNO levels has not been determined. Standardized for clinical use, ATS/ERS guidelines for the measurement of FeNO have been published.82,83
1.4.4
Validated Questionnaires
1.4.4.1
Asthma Control Questionnaire
20
In addition to the ACQ, there are numerous additional questionnaires used to evaluate asthma control. Some of the more common questionnaires are the Asthma Control Test (ACT), the Asthma Control Scoring System (ACSS), the Asthma Therapy Assessment Questionnaire (ATAQ), the 30-Second Asthma Test and Lara Asthma Symptom Scale (LASS).
1.4.4.2
Standardized Asthma Quality of Life Questionnaire
The Standardized Asthma Quality-of-Life Questionnaire (AQLQ(S))90 was designed to measure asthma-related quality-of-life. The questionnaire evaluates quality-of-life during the previous two weeks and consists of 32 questions encompassing four subscore domains (12 questions on symptoms; 11 questions on activity limitation; 5 questions on emotional function and 4 questions on exposure to environmental stimuli). A range of matters are assessed including activity limitation, amount of discomfort due to chest tightness, concern about having asthma, fear of not having access to asthma medication and symptoms from exposure to cigarette smoke. Four different seven-point Likert-type response scales are used, ranging from one (totally limited/a very great deal/all of the time/severely limited, most not done) to seven (not at all limited/none/none of the time/not limited, have done all). The AQLQ total score is calculated as the mean of all 32 questions and the domain subscores are the mean of the questions in the domain. The minimum clinically-important difference is 0.5,91 although the validity of this threshold is still being discussed. Importantly, the AQLQ(S) has been widely adopted as a clinical trial endpoint.92
21
1.4.4.3
Dyspnea
Dyspnea is a common symptom of asthma and the Modified Medical Research Council (mMRC)93 and Borg dyspnea scales94 are commonly used to assess it severity. The Modified Medical Research Council dyspnea scale is one of the most commonly used questionnaires to assess dyspnea. It uses a simple five-point scale which assesses the impact or burden of dyspnea on the patient. Scores range from zero (breathless with strenuous exercise) to four (too breathless to leave the house, or breathless when dressing). Similarly, the modified 0-10 Borg dyspnea scale assesses how patients perceive their severity of dyspnea using a simple 10-point scale, with scores ranging from zero (nothing at all) to ten (maximal).
1.5
Diagnosis and Classification of Asthma
Asthma is particularly challenging to diagnose and classify due to its multiple overlapping pathologies that are heterogeneous between individuals (Figure 1-8).95 Although spirometry is most often employed to diagnose asthma, it is difficult to use spirometry to further classify asthma into respective phenotypic categories. With the advent of novel biomarkers, such as FeNO, accurate classification of asthma sub-phenotypes is possible.95 As depicted schematically in Figure 1-8, a multifaceted approach and a gamut of biomarkers is required to accurately diagnose and subsequently classify asthma.96
Figure 1-8 Asthma is a heterogeneous disease consisting of several overlapping pathologies necessitating multiple biomarkers to accurately diagnose and phenotype patients.
22
1.5.1
Asthma Diagnosis
A history of variable respiratory symptoms, the presence of airflow obstruction or hyperresponsiveness, reversibility of obstruction and exclusion of alternative diagnoses constitutes a positive diagnosis of asthma.1,2 Respiratory symptoms indicative of asthma include a combination of wheeze, dyspnea, chest tightness and cough that are temporally intermittent and tend to worsen at night.1,2 In reality, asthma is still commonly diagnosed on the basis of symptoms alone. In Ontario, Canada, only 43% of asthmatics diagnosed by a physician performed spirometry.97 Failure to include objective assessments in the diagnostic process is likely contributing to overdiagnosis; evidence of this was observed in a longitudinal study across eight Canadian cities that concluded approximately 33% of individuals with a physician diagnosis of asthma did not have asthma when objectively assessed.98 Ideally, a diagnosis should be rendered through evaluation of the patient’s respiratory symptoms, medical history, physical examination and spirometry.1,2 Independently, symptoms, medical history and physical exams cannot accurately exclude and/or confirm a diagnosis of asthma. Spirometry is absolutely required to objectively assess airflow obstruction, its severity and reversibility.96 Accordingly, spirometry should be performed prior to and following inhalation of a short-acting bronchodilator to indicate the degree of obstruction and reversibility according to ATS/ERS standards.65
Common differential diagnoses include chronic obstructive pulmonary disease, alternative upper airway diseases (e.g. rhinitis) and obstructions involving the large (e.g. vocal cord dysfunction) and small airways (e.g. bronchiolitis).2
1.5.2
Asthma Control
23
questionnaires have been designed to assess the degree of asthma control. Some of the most commonly used questionnaires are the ACQ and ACT. There is no general consensus between national and international guidelines regarding degrees of asthma control. For example, the GINA report of 2015 used categories of “well-controlled,” “partly-controlled” and “uncontrolled;”1 whereas the National Heart, Lung, and Blood Institute (NHLBI) ERP3 used “well-controlled,” “not well-controlled” and “very poorly-controlled.”2 Regardless, the primary goal of asthma treatment is the achievement and maintenance of disease control.
1.5.3
Asthma Severity
Asthma severity can be defined by the intensity of treatment required to control asthma.17,99 Severity can be classified as intermittent, mild, moderate and severe according to the lowest level of treatment required to achieve asthma control. Shown below in Table 1-1, intermittent, mild, moderate and severe asthma is asthma that is well-controlled while receiving the indicated treatment regimen. The indicated treatment regimens can be extrapolated to reflect the six-step and five-step treatment strategies proposed by the NHLBI100 and GINA,1 respectively. Severe asthma is defined as asthma which requires treatment with high dose ICS and LABA (and/or OCS) to achieve asthma control, or asthma that remains uncontrolled despite maximum therapy.101 As defined, asthma severity can only be assessed after a patient has been on regular controller treatment for several months.
Table 1-1 Classification of asthma severity.
Intermittent Mild Moderate Severe
Lowest level of treatment required to achieve control
SABA as
needed other low intensity Low-dose ICS or treatment
Low- to moderate-dose ICS and
LABA
High dose ICS and LABA ±
OCS
Treatment strategy Step Allocation
NHLBI EPR3100 1 2 3 or 4 5 or 6
GINA1 - 1 or 2 3 4 or 5
24
1.6
Treating Asthma
Similar to the majority of chronic lung diseases, no existing asthma treatments are preventative or curative. Accordingly, the primary goal of asthma treatment is the achievement and maintenance of disease control while minimizing the risk of future exacerbations or lung function decline. The majority of asthma can be well-controlled using a SABA for rescue during acute onset bronchoconstriction and ICS for chronic
control. However, as asthma severity is increased, treatment becomes more complex and requires personalized, phenotype-specific additive therapies.
25
Figure 1-9 2015 GINA stepwise approach to asthma treatment.
ICS, inhaled corticosteroids; SABA, short-acting beta2-agonists; LABA, long-acting beta-agonists; OCS, oral corticosteroids; anti-IgE, anti-immunoglobin E therapy; theoph, theophylline; LTRA, leukotriene receptor antagonists.
Adapted from GINA Global Strategy for Asthma Management and Prevention, 2015.1
1.6.1
Controller & Reliever Treatment
1.6.1.1
Corticosteroids
26
medications in placebo-controlled trials.109,110 Commonly used ICS include beclomethasone, budesonide, ciclesonide, fluticasone, mometasone and triamcinalone. As many as 30% of severe asthmatics require daily oral systemic corticosteroids (OCS) as additive maintenance therapy, with 50% requiring more than three bursts of OCS annually.111 Due to the well-documented negative side-effects of chronic OCS use, they are only recommended as an add-on treatment for severe asthmatics who remain poorly controlled despite high-dose ICS and long-acting beta-agonists (LABA).1,2 OCS are more commonly used in short bursts (3-7 days) during an exacerbation to gain control of symptoms as they speed the resolution and prevent relapse of exacerbations.112,113
1.6.1.2
Beta-agonist Bronchodilators
Short-acting and long-acting beta-agonists (SABA and LABA, respectively) are the most commonly used bronchodilators for treating asthma. SABAs, such as salbutamol, are a highly-effective reliever of acute bronchoconstriction in mild, moderate and severe asthma. LABAs, salmeterol and formoterol, cause bronchodilation for greater than 12 hours114 and are used in combination with ICS for long-term control in moderate and severe asthma. The clinical benefit of monotherapy therapy with SABA and LABAs is inferior to that of ICS and has been linked to adverse outcomes,115 accordingly LABAs are rarely used independently. When used in combination with ICS, LABAs have an additive effect, improving lung function and symptom control.116,117 The effects of beta-agonists are the result of their binding to beta-adrenoceptors, present on airway smooth muscle, epithelial and inflammatory cells. Its major mechanism of action is initiated when beta-adrenoceptors on the airway smooth muscle are stimulated, increasing cyclic AMP, which causes the smooth muscle to relax. The variable rate of onset and the duration of effect between SABAs and LABAs is due to their hydrophilic and lipophilic characteristics that govern their interaction with beta-adrenoceptors.114
1.6.2
Add-on Treatments
1.6.2.1
Theophylline
27
effective treatments, such as ICS and beta-agonists, theophylline is considered an alternative controller option or add-on treatment.1,2,118 The clinical benefit of adding theophylline to ICS treatment was found to only minimally improve lung function.119 The clinical utility of theophylline is complicated due to its toxicity and associated side-effects at effective doses, which is particularly problematic as its bronchodilator effect is dose-dependent. Despite guideline recommendations, theophylline is one of the most prescribed medications for asthma internationally because of its low cost. This relates to its use in developing nations where access to superior and more expensive alternatives is limited.
1.6.2.2
Leukotriene Receptor Antagonists (LTRAs)
LTRAs reduce bronchoconstriction and inflammation in response to various stimuli; they are considered an alternative first-line therapy, but are most commonly used as add-on treatment.1,2 Leukotrienes are biochemical mediators that are released from inflammatory cells such as mast cells, eosinophils and macrophages in response to various stimuli.41,120 Binding of cysteinyl-leukotrienes to cysteinyl-leukotrienes receptors results in smooth muscle constriction, mucus secretion, edema and inflammation.41,120 For the treatment of asthma, montelukast (Singulair) is the most commonly used LTRA, blocking the effect of cysteinyl-leukotrienes receptors. LTRAs are considered an alternative first-line therapy as they are less effective than ICS when used independently.121 In a multicentre, randomized, double-blind, placebo-controlled trial, montelukast improved airway obstruction, exacerbations, control and blood eosinophils in stable asthma.122 In a subsequent trial, the clinical benefit of adding montelukast to ICS treatment was found to be as effective as doubling the ICS dose.123 Multiple studies have concluded that adding LTRA to ICS results in comparable124 or worse outcomes125,126 than achieved by adding LABA to ICS.127
1.6.2.3
Anticholinergic bronchodilators
28
improved lung function and symptoms, reduced frequency of SABA use and reduced risk of future exacerbations in asthmatics taking ICSs and LABAs.129-131
1.6.2.4
Immunomodulators
Immunomodulator is an umbrella term used to encompass many different pharmaceutical agents aimed at modulating cell signalling and the immunologic responses in asthma. Omalizumab, a monoclonal antibody that interrupts the allergic cascade by binding free immunoglobulin E (IgE), is considered a phenotype-guided add-on treatment for allergic asthma that cannot be well-controlled with ICS.1,2 In patients with moderate-to-severe allergic asthma, large-scale clinical trials have proven omalizumab reduces exacerbations and symptoms, improves quality-of-life and has a steroid-sparing effect.132-135 In subsequent trials, adding omalizumab to ICS treatment was proven clinically beneficial due to further improved lung function and a reduction in exacerbations. While omalizumab is the only immunomodulator currently integrated into treatment guidelines, numerous clinical trials have emerged to evaluate novel pharmaceutical agents engineered to target various pathways important to the pathogenesis of asthma. Potential new treatments include: anti-interleukin 5 (IL-5) antibodies, mepolizumab136 and reslizumab;87 anti-IL-13 antibodies, lebrikizumab137 and tralokinumab;138 anti-TNF-α antibody, golimumab;139 tyrosine kinase inhibitor, masitinib;140 IL-2Rα antibody, daclizumab;141 and CXCR2 antagonist, SCH527123.142
1.6.2.5
Bronchial Thermoplasty
29
shown to persist five years after treatment.148,149 Despite its excellent safety and efficacy profile, the worldwide literature consists of only about 200 patients who have received this treatment.
1.7
Imaging Asthma
Currently, the clinical use of imaging in asthma is minimal and largely confined to chest radiography and x-ray computed tomography (CT). Through research initiatives, novel imaging biomarkers of lung structure and function have been developed, many of which have the potential to impact asthma diagnosis, management and evaluation of treatment effect. X-ray CT, single photon emission computed tomography (SPECT), positron emission tomography (PET) and MRI based techniques can be used to non-invasively evaluate regional ventilation. Imaging has provided valuable insight into the underlying disease mechanisms of asthma, and will be discussed below.
1.7.1
Plain X-ray
30
asthma.152 Radiographic findings associated with asthma are generally subtle and they include increased lung volume, increased lung lucency and bronchial wall thickening.153
Increased lung volume or hyperinflation is the most common radiographic observation and is seen as increased lung length and flattening of the diaphragm (Figure 1-10).41 The prevalence of bronchial wall thickening identified on chest radiographs has been related to asthma severity.152
Figure 1-10 Representative posterior-anterior chest radiograph of a healthy volunteer and an asthmatic subject.
In asthma, diaphragm flattening is indicative of hyperinflation. Healthy case courtesy of Dr. Usman Bashir, Radiopaedia.org, rID: 18394; Asthma case courtesy of Dr. Garth Kruger, Radiopaedia.org, rID: 21812.
1.7.2
X-ray Computed Tomography
Since its advent in the 1970s, x-ray CT has become the imaging modality of choice for the evaluation of pulmonary disease. Through technological advancements, the entire lung volume can now be captured with sub-millimetre isotropic spatial resolution in a single breath-hold using multiple-row detector CT scanners.154 This increased spatial resolution
31
Hounsfield units (HU) and range from -1000 HU for air, 0 HU for water and to approximately 700 HU for bone.155
CT of asthmatic subjects have shown abnormal findings such as bronchial wall thickening, bronchial wall dilation, luminal narrowing, bronchiectasis, mosaic lung attenuation, mucus plugging and atelectasis (Figure 1-11).152,156 In asthma research studies, CT has been used
extensively to directly evaluate the large airways and to indirectly evaluate the small airways (<2mm). As detailed below, CT-derived metrics are correlated with clinical symptoms and are highly sensitive to treatment response. Gupta and colleagues used CT to evaluate 185 severe asthmatics and reported that abnormalities were present in 80% of study participants.157
Figure 1-11 Axial CT of the right lower lobe in two representative asthmatics.
At baseline (panel A), after inhalation of methacholine (panel B) and then salbutamol (panel C) there are visually obvious variations in bronchial lumen diameters (highlighted by white arrow) consistent with bronchoconstriction and subsequent bronchodilation.158 In a separate asthmatic (panel D) mosaic attenuation due to air-trapping is observed.159
Reproduced with permission from Beigelman-aubry et al (2002)158 and Sung et al
(2007).159
The architecture of the large airways is assessed by quantifying metrics similar to those employed in histological studies such as the airway wall area percent (Equation 1-7),
airway wall thickness percent (Equation 1-8) and airway lumen area. Initial airway
32
tree to be segmented, and reliable quantification can be achieved for first to sixth generation airways.154,160 Furthermore, automated three-dimensional approaches allow for the
identification of airways using standardized clinical nomenclature, as demonstrated in
Figure 1-12.160 Awadh and colleagues were the first to quantify airway wall thickness in
the segmental and sub-segmental airways of asthmatics and healthy controls using a manual approach. They reported that asthmatics had a greater airway wall thickness as compared to controls and that wall thickness was increased with increasing asthma
severity.161 Subsequent investigations have compared airway measurements in normal and
asthmatic subjects using various quantification techniques and their results support the
initial findings by Awadh et al.162-167 Furthermore, CT airway measurements have been
correlated with asthma severity,167-169 airflow obstruction,162,164,167,168,170 airway
hyperresponsiveness163,168,171 and pathology.168 Following interventions such as deep
inspiration,172 methacholine challenge166 and ICS therapy,165,173,174 the airways have been
shown to behave in the expected direction.
Equation 1-7
Wall Area Percent[%] = Airway wall area Total airway area×100
Equation 1-8
Wall Thickness Percent[%] = Airway wall thickness Airway outer diameter×100
33
main bronchus and left upper lobe bronchus pathway is highlighted (in blue) and the segmental LB3 airway is quantified (right panel). In cross-section, the pathway and LB3 airway boundaries are outlined in red.
The small airways (<2mm) cannot be directly evaluated using CT as they are beyond the current spatial resolution limit of the technique. However, air trapping in asthma is thought to be an indirect measure of small airway obstruction and can be visualized as
heterogeneous regions of low attenuation on CT (Figure 1-11). As expected, regions of
low attenuation are more apparent on expiratory as compared to inspiratory scans. Various metrics have been used to quantify the extent of air trapping on CT and these include scoring systems, threshold and percentile techniques and lung density expiratory to inspiratory ratios. Threshold techniques use a specific threshold of HU (e.g. 950 HU, -910 HU, -856 HU) and the percentage of the lung less than this threshold is calculated.175
Percentile techniques require a specific percentile point (e.g. lowest 15th percentile) to be
selected and the HU value for the corresponding percentile is determined.175 Using various
CT-derived gas trapping metrics, investigators have observed significantly elevated gas trapping in asthmatics over healthy controls.158,176 Other investigators correlated CT
measurements of gas trapping in asthma with asthma severity,177 airflow
obstruction,170,176,178 airway hyperresponsiveness and disease duration.178 Zeidler and
colleagues performed a double-blinded, cross-over study to compare the effect of montelukast versus placebo on small airway function in mild-to-moderate asthma. Compared to placebo, montelukast resulted in significantly less air trapping on CT.179
Moreover, other interventional studies have shown that air trapping on CT worsens following methacholine158 and improves following treatment with ICS.180,181 These studies
similarly concluded that CT is a more sensitive method to assess treatment response in the small airways than conventional lung function tests.
34
in comparison to those that do not.183 However, this technique is limited as xenon enhancement is poor and this has motivated xenon ventilation imaging using a dual-energy CT based approach. Using dual-energy CT, Chea and colleagues observed ventilation defects in 80% of stable asthmatics who had significantly worse airflow obstruction and thicker airway walls than asthmatics without defects.183 Using the same approach, another group of investigators observed an increase in xenon ventilation defects following methacholine that resolved following salbutamol inhalation.184
Despite the rich qualitative and quantitative structural and functional information that CT can provide, it is disadvantaged due to its use of ionizing radiation. The radiation dose associated a clinical chest CT is approximately 8 mSv,151 equivalent to roughly five years of background radiation in Toronto, Canada (1.6 mSv) or 400 plain chest radiographs. This becomes a major concern in asthma research and patient care as serial imaging capabilities are necessary for disease management and the evaluation of response to treatment or intervention.
1.7.3
Nuclear Medicine
Gamma Scintigraphy & Single Photon Emission Computed Tomography (SPECT)
Scintigraphy and SPECT can be used to regionally evaluate perfusion and ventilation in the lungs. Following the injection or inhalation of a radionuclide tracer, gamma radiation is used to form an image of radioactivity within the body. Radionuclide tracers emit gamma rays at a specific energy that can be detected by a gamma camera that converts absorbed energy into an electrical signal that can be displayed as an image. Accordingly, regions of high radionuclide concentration appear as hot spots on the image. Similar to how x-ray CT compares to plain x-ray, SPECT compares to scintigraphy.185 Scintigraphy uses gamma radiation to form two-dimensional images of radioactivity within the body, whereas SPECT offers a three-dimensional image.