Scholarship at UWindsor
Scholarship at UWindsor
Electronic Theses and Dissertations Theses, Dissertations, and Major Papers
2010
Sensitivity in Service Design for the Development of SOA Based
Sensitivity in Service Design for the Development of SOA Based
Systems
Systems
Mohit Sud
University of Windsor
Follow this and additional works at: https://scholar.uwindsor.ca/etd
Recommended Citation Recommended Citation
Sud, Mohit, "Sensitivity in Service Design for the Development of SOA Based Systems" (2010). Electronic Theses and Dissertations. 339.
https://scholar.uwindsor.ca/etd/339
This online database contains the full-text of PhD dissertations and Masters’ theses of University of Windsor students from 1954 forward. These documents are made available for personal study and research purposes only, in accordance with the Canadian Copyright Act and the Creative Commons license—CC BY-NC-ND (Attribution, Non-Commercial, No Derivative Works). Under this license, works must always be attributed to the copyright holder (original author), cannot be used for any commercial purposes, and may not be altered. Any other use would require the permission of the copyright holder. Students may inquire about withdrawing their dissertation and/or thesis from this database. For additional inquiries, please contact the repository administrator via email
by Mohit Sud
A Thesis
Submitted to the Faculty of Graduate Studies through the School of Computer Science in Partial Fulfillment of the Requirements for
the Degree of Master of Science at the University of Windsor
Windsor, Ontario, Canada 2010
c
by Mohit Sud
APPROVED BY:
Dr. Ahmed Azab, External reader
Department of Industrial and Manufacturing Systems Engineering
Dr. Scott Goodwin, Internal reader School of Computer Science
Dr. Xiaobu Yuan, Advisor School of Computer Science
Dr. Xiao Jun Chen, Chair of Defense School of Computer Science
Author’s Declaration of Originality
I hereby certify that I am the sole author of this thesis and that no part of this thesis has been published or submitted for publication.
I certify that, to the best of my knowledge, my thesis does not infringe upon anyone’s copyright nor violate any proprietary rights and that any ideas, techniques, quotations, or any other material from the work of other people included in my thesis, published or oth-erwise, are fully acknowledged in accordance with the standard referencing practices. Fur-thermore, to the extent that I have included copyrighted material that surpasses the bounds of fair dealing within the meaning of the Canada Copyright Act, I certify that I have ob-tained a written permission from the copyright owner(s) to include such material(s) in my thesis and have included copies of such copyright clearances to my appendix.
Abstract
.
Acknowledgements
It is near impossible to overstate my gratitude and appreciation I have to my M.Sc supervisor Dr. Xiaobu Yuan. Through his great efforts to explain things clearly and simply, he helped pave the road for me to walk. Throughout my thesis-writing period, Dr. Yuan has provided me with encouragement, advice, excellent tutelage, and many great ideas. Thank you Dr. Yuan.
I wish to thank my Internal and External Reader, Dr. Goodwin and Dr. Azab, for their excellent suggestions that helped to improve the experiment and overall quality of the thesis.
Author’s Declaration of Originality iii
Abstract iv
Dedication v
Acknowledgements vi
List of Figures x
List of Tables xi
1 Introduction 1
1.1 Scope of Service Oriented Architecture (SOA) . . . 1
1.2 Sensitivity Analysis . . . 2
1.3 Structure of Document . . . 3
2 Review of Literature 4 2.1 Overview . . . 4
2.2 Application Scope . . . 6
2.3 Web Services . . . 7
2.3.1 Overview . . . 7
2.3.2 Implementation Methods . . . 9
2.4 Advantages of SOA . . . 10
3 Performance Evaluation of SOA 12 3.1 Overview . . . 12
3.2 Quality of Service . . . 12
3.3 Memory . . . 13
3.4 Service Sensitivity . . . 14
4 Sensitivity Analysis 16
4.1 Introduction . . . 16
4.2 Advantages of Sensitivity Analysis . . . 17
4.3 SOA and Sensitivity Analysis . . . 17
4.4 Approaches to Sensitivity Analysis . . . 18
4.5 Previous Research . . . 19
5 Problem Statement 21 5.1 Statement of the Problem . . . 21
5.2 Purpose of the study . . . 22
5.2.1 Overview . . . 22
5.2.2 Service Selection . . . 23
5.2.3 Quality Assurance and Service Optimization . . . 23
5.3 My Contribution . . . 23
5.4 Impact on the Industry . . . 24
6 Proposed Method 26 6.1 Methodology . . . 26
6.1.1 Foundation for Proposed Method . . . 26
6.1.2 Overview of Proposed Method . . . 27
6.1.3 Multi-Factor Based Sensitivity Analysis . . . 27
6.2 Sensitivity Analysis Web Service . . . 34
6.2.1 Overview . . . 34
6.2.2 Implementation Details . . . 34
6.2.3 Design . . . 36
6.2.4 Time Complexity . . . 39
7 Experiment And Analysis 41 7.1 Experiment Analysis . . . 41
7.1.1 Overview . . . 41
7.1.2 Experiment Requirements . . . 42
7.1.3 Sample Services . . . 43
7.2 Case Study . . . 45
7.3 Analysis and Discussion . . . 46
7.3.1 Initial Results . . . 46
7.3.2 Approach 1: Modify Service B to Improve Performance . . . 51
7.3.3 Approach 2: Replace Web Services in Service B . . . 52
7.3.4 Approach 3: Optimize and Swap Web Services in Service B . . . . 54
7.4 Final Result . . . 56
Bibliography 60
2.1 The Basic Components of SOA . . . 5
2.2 Four Layer Model of the Web Service Stack . . . 8
6.1 Combination Generator Algorithm . . . 38
6.2 Sensitivity Analysis Algorithm . . . 39
6.3 Algorithm Time Complexity Analysis . . . 40
6.1 Example of a Four-Factor Variance Table . . . 33
6.2 Sample Web Service Input . . . 35
7.1 Experiment Hardware Requirements . . . 43
7.2 Experiment Software Requirements . . . 43
7.3 Service A Composition . . . 45
7.4 Service B Composition . . . 45
7.5 Service A Variance Table . . . 46
7.6 Service B Variance Table . . . 46
7.7 Service A Data Sample . . . 48
7.8 Service B Data Sample . . . 49
7.9 Approach 1: Service B Optimized Data Sample . . . 51
7.10 Approach 1: Service B Optimized Variance Table . . . 52
7.11 Approach 2: Service B Replace Web Services Data Sample . . . 53
7.12 Approach 2: Service B Replace Web Services Table . . . 54
7.13 Approach 3: Optimize and Replace Web Services in Service . . . 55
7.14 Approach 3: Optimize and Replace Web Services in Service . . . 56
Introduction
1.1
Scope of Service Oriented Architecture (SOA)
The introduction of the Service Oriented Architecture (SOA) software model has proven
itself to be a beneficial approach to software development. Its growth and popularity are
constantly spreading throughout the industry, prompting businesses to change their current
methods to incorporate this new development technique. SOA involves separating logic
into small components that can be reused across multiple applications and multiple projects.
Although the modern approach of SOA includes many benefits that could revolutionize the
software industry, like any new technique, SOA includes limitations and drawbacks that
may affect its acceptance. One of the most identifiable challenges of the SOA model is
software performance.
Software performance is critical to the success of any software model and is an area
that the SOA community is actively working on investigating. Key areas related to
perfor-mance are perforperfor-mance evaluation and service selection[10]. One of the benefits of SOA
is that multiple services may exist that aim to achieve the same objective. This creates
competition among services, thus reducing cost and providing service requestors with
op-tions when selecting a service. With the growing number of available services on the Web,
service selection has become a key problem in the SOA research area. In order to ensure
the continuing success of SOA, service requestors require a technique to evaluate existing
services to identify and select the best service available for their needs. Furthermore,
ser-vice providers require a similar method to evaluate the serser-vices they create to ensure the
consistency, and optimality of their software services as a way to increase the desirability
of their services.
1.2
Sensitivity Analysis
Typically, the SOA based applications include a set of components. Each component may
have several parameters commonly referred to as input variables, or factors. Factors are
input variables to a software system whose changes in value affect the performance of the
system. Sensitivity analysis is the process of evaluating the performance of a software
system with respect to their sensitivity to factor variations, and to identify the effects of
factor variations on a systems performance. Through applying sensitivity analysis to SOA,
this will help resolve many of the issues related to performance from the view point of
both the service requestors and service providers. Service requestors will have a guideline
to identify and select the most optimal service available for their application needs. Also,
1.3
Structure of Document
This document explores the rapidly growing and popular subject of SOA. A literature
re-view is performed in regards to SOA. Some of the issues and drawbacks associated with
SOA are identified. The drawbacks pertain to the development of services and service
se-lection in regards to performance based upon sensitivity to factor variation. A solution is
proposed and an algorithm is created to perform sensitivity analysis upon a service to
de-termine the effects of factor variation on performance. An experiment has been designed
that will evaluate the application of applying sensitivity analysis to SOA to identify and
select services that yield better performance. The experiment also demonstrates how
ser-vice developers can use this information to improve their serser-vices and make them more
Review of Literature
2.1
Overview
Service Oriented Architecture (SOA) is a software model in which automation logic is
separated into smaller, distinct units of logic. Together, these units compose a larger piece
of business automation logic. Individually, these units may be distributed. Each unit of
logic is loosely coupled and may be reused across multiple applications, as well as aide in
creating several different project objectives [4].
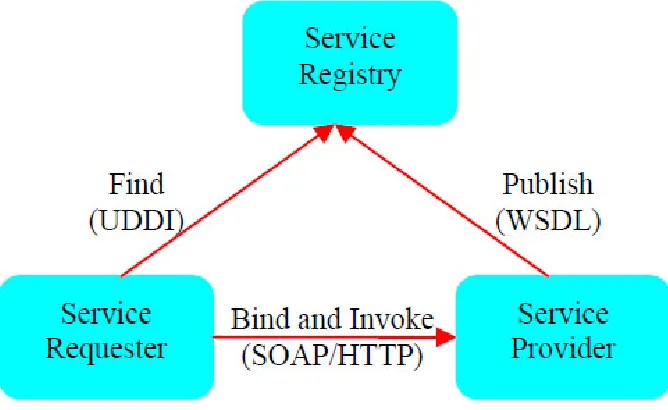
The SOA software model contains three basic components; Service Provider, Service
Registry, and Service Requestor, as seen in Fig 2.1 [17].
• Service provider - responsible for creating and publishing a service to a registry and
makes it available through the Internet.
• Service requestor - performs service discovery operations on the service registry to
find the needed service, then accesses that service.
• Service registry - aides service providers and requestors to find each other by acting
Figure 2.1: The Basic Components of SOA
as the registry of services.
Before a unit of logic can be considered part of the SOA model, it must first conform
to a basic set of principles and standards that will allow them to grow independently while
maintaining its ability to work conjointly with other units of logic. Each unit of logic is
composed of three core components; services, descriptions, and messages [5].
• Services - Services encapsulate a single, or multiple units of logic. It allows
devel-opers to utilize the unit of logic from within their own applications. Services are
essentially the communication structure between applications and the unit of logic.
• Descriptions -Service description must at the very least specify the name and location
of a service, as well as data-exchange requirements. Typically, this information is
• Messages -Messages are passed to or received from a service as an ’independent unit
of communication’. The messages are autonomous and contain enough intelligence
to self govern their parts of the processing logic. This is because once a message is
sent, the service loses control of what may happen to it.
2.2
Application Scope
The uses and application of SOA extends far beyond its typical uses today, however as it
is an emerging technology, we are limited in its current implementation. The most current
and effective implementation of the SOA software model may be seen through the use of
web services. SOA is essentially a software design principle, whereas web services is a
SOA based interface definition standard.
The popularity of SOA is driven by the momentum created by web services. Through
the use of SOA, web services have fundamentally shifted the way applications are built,
and involve businesses rethinking the role applications play in their enterprise [15].
As SOA is still in its early stages, the future use of the SOA software model has yet to
be conceived and is constantly changing. There are multiple ideas (or dreams) about the
practical and future use of SOA. One of the most noteworthy however is how SOA may
aide in implementing the semantic web.
The semantic web is a concept that represents the idealization of having a vast amount
of information linked in such a way that it is easily understand and interpreted by machines
on a global scale. It can be perceived as an efficient way of representing data on the web,
or as a globally linked database. Although the notion of the semantic web is revolutionary
and can potentially change the way we use the World Wide Web, the development of the
The logic behind the semantic web is that valuable information is generally hidden away
in HTML pages and may be difficult to find and use on a large scale. This is because there
is no global system for publishing data that may be easily processed by everyone. The
semantic web hopes to change that and make publishing data easier and in a more reusable
form. This will create a ripple effect that more people will want to publish their data,
because more people can access it easier, thus, reaching a broader audience.
2.3
Web Services
2.3.1
Overview
Web services are the most current implementation of the SOA software model. It utilizes
SOA’s design principles to create reusable software components that use a standardized
messaging system, which is built within the scope of the internet. Through web services,
different kinds of platforms and systems are able to communicate with each other in a
com-mon language, without the need for custom interfaces or wrappers. Web services include a
standardized method for supporting machine-to-machine interaction over a network.
Typ-ically, a web service is a loose coupled unit of logic (or application) that includes an API
that may be accessed over a network (typically the internet). SOA and web services
pro-vide complete transparency of the application, allowing developers to utilize the features of
another application without needing to know the underlying implementation details behind
it.
Web services are designed to support machine to machine communication over a given
network. This is achieved through the adherence of XML based standards including SOAP,
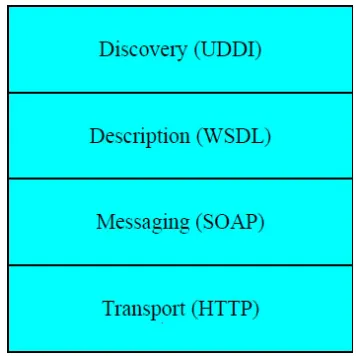
and using web services. The web service stack is a combination of these standards and
protocols that support communication over a network. Fig 2.1 illustrates the web service
stack.
Figure 2.2: Four Layer Model of the Web Service Stack
• Transport Protocol - has the responsibility of passing messages between network
protocols. Typically, HTTP is used; however web services are not restricted to any
specific transport protocol.
• Messaging Protocol -has the responsibility of encoding messages in XML to ensure
they are understood by the recipient. SOAP (Simple Object Access Protocol) is a
common format for exchanging web service data over HTTP.
• Description Protocol -used to describe the interface for a specific web service.
Typ-ically, a WSDL (Web Service Definition Language) file is used to describe this
infor-mation.
Description, Discovery, and Interaction) is a specification used by service providers
to advertise the existence of their services to requestors in a service registry.
2.3.2
Implementation Methods
There are many ways to implement the messaging portion of a web service. Not all
imple-mentation methods are suitable for all projects, but the most noteworthy and widely used
are: SOAP, XML-RPC, and REST [7].
Simple Object Access Protocol (SOAP)
SOAP is the most widely used web service technologies available. It is primarily an XML
based protocol, and is supported by the W3C (World Wide Web Consortium). SOAP is
platform and language independent and is considered to be the most widely supported web
service implementation because of it. Unlike other web service technologies, SOAP is not
restricted to a specific transportation protocol such as HTTP. Although SOAP may be
con-sidered to be the most dominant web service technology due to its many features and fewer
limitations, it is also considered to be more complex, and slower than other web service
technologies.
Extensible Markup Language - Remote Procedure Call (XML-RPC)
XML-RPC is a protocol that allows software running on different operating systems, and
different environments to make remote procedural calls over the internet. Its remote
pro-cedural calls utilize HTTP as the transport layer and XML as the encoding. XML-RPC is
a simple, lightweight implementation method for SOA. It allows complex data structures
to be transmitted, processed, and returned. XML-RPC supports rapid development while
maintain clean design and simplicity.
Rest is not a standard, a language, or a protocol but a term used to refer to an architectural
technique that works with the existing technologies of the web and its protocols (e.g. HTTP
and XML) and exploits them to achieve new and different functionality. REST is said to be
simpler to use than SOAP (although not as powerful) since it does not require the need for
both a client program and a server program. REST has a different design approach when
compared to other web service technologies. Unlike SOAP and XML-RPC that use RPC
(remote procedure calls), REST utilizes the aspects of a resource that defines its content
types. The largest advantage of REST over other Web Service technologies is that it may
utilizes many of the Web protocols and is not limited to HTTP. Through its use of many
Web protocols, REST can fully incorporate caching into its architecture, thus improving the
overall performance of the service [16].
2.4
Advantages of SOA
There are many advantages to implementing an SOA based application [13] [1]. These
advantages include:
• An SOA based application may be accessed from anywhere through the use of the
World Wide Web. There is complete location independence.
• SOA based applications are completely reusable. Loosely coupled services allows
for units of logic to be reused in many different applications.
• An SOA based application is completely platform and language independent.
• SOA allows for the service and connectivity to other applications to be done
• SOA provides a real time decision making environment.
• SOA allows developers to implement new tools and services without needing to know
the underlying services implementation details.
• SOA provides a data bridge between otherwise incompatible technologies.
Performance Evaluation of SOA
3.1
Overview
SOA is an emerging technology and like any rising star, there are noteworthy drawbacks
and concerns pertaining to its implementation. The most widely discussed issues pertain to
the performance of SOA based applications. This section will highlight some of the most
discussed aspects with the performance of SOA based applications, including quality of
service, memory implications, and service sensitivity.
3.2
Quality of Service
It is important to realize that client processing power has grown considerably over the years,
however network speeds have remained steady. This leads to the question of how to ensure
Quality of Service (QoS) on applications that are heavily dependent on services scattered
across a network. Since it is unlikely that we will be able to improve the overall transfer
speed of a given network, it is important for developers to optimize their applications in
order to meet their QoS requirements.
It is extremely difficult for an organization to determine their QoS requirement at the
start of application development. Furthermore, one of the most severe issues is the
scalabil-ity of the application during peak usage times. The poor performance is largely attributed
to overheads of delivery, parsing, validation, serialization of the XML data, as well as 3rd
party service integration.
There are a series of methods and techniques that exist that may aide in improving the
quality and responsiveness of an application, as well as ensure only a minimal amount of
messages and data are transferred [9]. These techniques include:
• Utilizing caching to reduce bi-directional data transfer over a given network.
• Implement client side validation to reduce data transfer
• Lazy load required data to improve the user’s perceived responsiveness. Lazy loading
is a technique that involves pre-fetching information from the server, even though the
client has not requested it yet.
• Shift certain requirements and responsibilities over from the server to the client.
• Incorporates Virtualization to handle resource sharing dynamically across systems
and platforms.
3.3
Memory
For majority of all SOA based application there are two major components, a server
com-ponent and a client comcom-ponent. The server comcom-ponent is responsible for interacting with
server component may be responsible for potentially millions of transactions at any point
in time, it is important to consider the memory footprint on the server as the number of
clients grows. The number of clients may grow as the application gains popularity, as well
as during peak usage times.
It is important to consider the memory implications on such an application. As the
memory demand increases to a point where the server is unable to keep up and manage all
of the requests and resources sufficiently, it may result in the server overloading, crashing,
and software outages.
Various techniques have been developed to help cope with the memory footprint
prob-lem [9]. These solutions include:
• Running performance tests to identify and optimize transactions that may be resource
intensive and responsible for application sluggishness
• Optimize, eliminate, or reduce the state information that may be recorded on the
server. This may drastically reduce the memory footprint.
• Incorporate server farms that you may expand as the demand increases (a costly
so-lution).
• Cache application data on the client and not on the server.
3.4
Service Sensitivity
One of the greatest benefits of SOA based systems is service reuse. A service provider can
create a service and allow it to be used by any number of service requestors in any number
available that aim to achieve the same objective. This results in services competing against
each other to be selected for various application uses. Furthermore, service requestors may
have unorthodox or various input value requirements for the services they wish to use. It is
strongly important for service requestors to be able to identify and select the most optimal
service available that suits their changes in input value needs. Through this assurance of
service selection, service requestors can ensure the successful operation of their application.
The process of service selection is an active performance related issue in the SOA model
that has no common solution to aide in its resolution.
The process of evaluating the performance of the output of a software system based
on changes to its input values is known as sensitivity analysis. The importance behind
sensitivity analysis as it applies to an SOA based service is that it assesses the output a
software services performance based upon changes to its input values, thus allowing service
requestors to identify and select the most suitable service for their needs as well as allowing
service providers to evaluate, and improve upon their existing services. The objective of
this thesis is to address a performance issue in the SOA model that pertains to performance
evaluation and service selection. This endeavour will benefit both service requestors and
Sensitivity Analysis
4.1
Introduction
The investigation of how changes to the values of the parameters of a given model affect
the result is known as sensitivity analysis. Through this procedure we can determine how
’sensitive’ a model is to changes in the value of its parameters and to changes in the structure
of the model.
Through demonstrating how the behaviour of a model responds to changes in its
param-eters values, sensitivity analysis is a useful tool in model construction and model evaluation.
Through studying the uncertainties that may be associated with parameters in a model,
sen-sitivity analysis aims to develop assurances that the model will perform accordingly for
various input sizes [2].
To outline the need and importance behind sensitivity analysis, John Graham, a Risk
Assessment professional from the University of Washington stated ”Sensitivity analysis is
particularly useful in narrowing the degree of uncertainty in the results” [18].
4.2
Advantages of Sensitivity Analysis
There are many benefits and advantages to sensitivity analysis. These benefits can be
ap-plied to various applications including SOA, risk analysis, software performance
evalua-tion, etc. Some of the most noteworthy benefits to sensitivity analysis include [14]:
• Exploring the impact of varying input assumptions and scenarios
• Simplifying software models
• Investigating the robustness of the model predictions
• Provides quality assurance
• Identifies factors that mostly contribute to the output variability
• Identifies the optimal regions within the space of factors
• Identifies the effects of the interaction between factors
4.3
SOA and Sensitivity Analysis
SOA is a growing software model that is changing the way businesses develop their
soft-ware systems. Its demand and popularity is increasing at a rapid pace. In order to ensure
the continued growth and success of SOA, developers that are creating new services must
ensure the quality of their services. As well, developers selecting a single service from
multiple services available to use in their application must identify and select the most
op-timal service for their needs. Assurances are required to ensure that the services selected
not optional but are a necessary requirement for SOA to prevail and succeed in the future
as a dominant software model.
These aims at addressing performance related issues in SOA are resolved through the
application of sensitivity analysis as it applies to SOA. A methodology will be introduced to
demonstrate how sensitivity analysis may be applied for the purpose of evaluating a services
performance based on their sensitivity to factor variation. It is through these techniques that
quality assurance can be provided, and service selection can be made after analyzing the
results produced through sensitivity analysis.
4.4
Approaches to Sensitivity Analysis
There have been multiple approaches that are similar in nature to sensitivity analysis as it
applies to various models, and are not restricted to the software domain. These approaches
have not been applied to the SOA model as a means of effectively evaluating the
perfor-mance of a service for the fulfillment of quality assurances and service selection in an
effective manner.
Brute Force -Works only on small models that take a short amount of time to solve, change
the initial data and solve the model again to see what results you’d get.
Classical Sensitivity Analysis -Applies to very large models that take a large amount of
time to solve. The classical sensitivity method relies on the relationship between the initial
table and any later table to quickly update the optimum solution when changes are made to
the coefficients of the original table.
Computer Based Ranging - Simple information about how certain coefficients can change
before the current optimum solution is fundamentally changed. John W. Chinneck, a
analysis to identify which data has the most significant impact on results in a software
sys-tem. He used a combination of linear programming and computer based ranging to establish
this information.
Analysis of Variance (ANOVA) - The ANOVA approach is very common in statistics.
It involves performing computations to determine if the mean of two given treatments are
equivalent or not. Although this approach has proven successfully in evaluating various
statistical models, its methods are best suited for two factor based sensitivity analysis [11].
Design of Experiment (DOE) - DOE experiments are not restricted to software systems
and may be performed on a variety of things including; software systems, people, plants,
animals, etc. DOE allows for observation and judgment on the significance to the output of
input variables that may be acting alone, or in combination with one another. DOE may be
considered to be Sensitivity Analysis earliest ancestry. Its approach has not been adapted
to software service [8].
4.5
Previous Research
Sensitivity analysis is a practical optimization mechanic that has been used to establish
confidence and performance optimization in many things including statistical research and
software applications. There currently has not been a sufficient amount of research aimed in
regards to applying sensitivity analysis to the success and improvement of SOA. The most
identifiable research has been conducted at the University of Windsor with Dr. Xiaobu Yuan
and a few former students [3].
Shangwei Duan, Tony Huang, and Dr. Xiaobu Yuan, University of Windsor, have
demonstrated a technique that allows for two-factor based sensitivity analysis of SOA based
predicate software quality, as well as to identify optimal configurations in software services
with only two factors [19].
Chunjiao Ji and Dr. Xiaobu Yuan, University of Windsor, have outlined a methodology
for multi factor based sensitivity analysis of SOA based systems. Their approach is used
to identify which if any individual factors or joint factors have significant effects on the
Problem Statement
5.1
Statement of the Problem
Service Oriented Architecture (SOA) has gained an ever increasing popularity in both the
academic and industrial communities in recent years. To ensure its continuing growth and
success, concerns relating to its performance must be addressed. Two primary concerns
surrounding SOA are performance evaluation to provide quality assurance, and service
se-lection. This Master’s thesis introduces a technique that offers quantized evaluation of
service software based upon individual and interactive performance of services. In
partic-ular, an algorithm is developed to evaluate the performance of an SOA model with respect
to changes in its service components for a specified range of parameters. This technique of
sensitivity analysis provides a guideline for SOA developers to identify and select the most
optimal software service, and for service providers to ensure the consistency, and optimality
of the software services they aspire to create.
5.2
Purpose of the study
5.2.1
Overview
The approach to service oriented development involves having a set of loosely coupled
components assembled together to create a new service with new functionality. With this
technique, each component can be reused in a multitude of different projects with different
objectives.
Several software services may be available that strive to achieve the same end objective
as each other. Service requestors have a choice as to which services they choose to
incor-porate within their application. Although several software services may aim to achieve the
same objective, they may produce different results for the same input parameters.
Inaccu-racies and errors in a software service may make it perform differently when compared to
another software service with the same intent. With that in mind, each software service
must provide quality assurances to remain as a competitive and desirable service.
With the introduction of sensitivity analysis as it applies to service oriented
develop-ment, it provides a technique for developers to evaluate the performance of a software
service with respect to its change in the input parameter values for its service components.
Through demonstrating how the behaviour of a model responds to changes in its
parame-ters values, sensitivity analysis is a useful tool in model construction and model evaluation.
This plays a critical role at assisting service requestors with the selection of services and
5.2.2
Service Selection
For developers that are creating a SOA based application that is dependent on and is
com-posed of several other services, developers require a technique to ensure that the services
they select to be used in their application will perform accurately under the scope of changes
that may occur to the input values of their SOA model.
With the introduction of sensitivity analysis to software service selection, developers
can identify and select appropriate services as required for their application. With
sensitiv-ity analysis, developers can run performance tests to learn how any change in the input of
a model will affect the output and whether that variation when compared to another service
is greater, identifying the most optimal service to select.
5.2.3
Quality Assurance and Service Optimization
When a service provider is creating a software service that may be used in a wide scope
of different applications, sensitivity analysis aims to develop assurances that the service
model will perform accordingly for various input sizes. This enhances marketability for the
service, as well as desirability for those who wish to use the service because they now have
reassurance that the service will effectively meet their needs. In turn, this will improve the
desirability of the service, thus increasing sales and usability.
5.3
My Contribution
It is evident that there are various performance related issues associated with the SOA
model. A key concern is quality assurance and service selection. Service requestors require
of services. This technique can aide in the process of developing new services or selecting
from existing services.
This Master’s thesis aims at addressing this need for developers through the introduction
of sensitivity analysis as it applies to software services. The objective is to evaluate software
services in regard to their sensitivity to factor variations, and to determine the effects of
factor variations on performance analysis in a quantitative manner.
Using a sensitivity analysis methodology, this technique will be applied to the analysis
of software services, specifically an algorithm will be produced to automate the evaluation
of a software service in a quantitative setting.
An experiment will be conducted to prove the effectiveness of sensitivity analysis. In the
experiment, two software services will be available, each attempting to produce the same
result. Through sensitivity analysis, it will be demonstrated that by utilizing the created
algorithm, a developer may easily identify and select the most optimal solution among these
services for use in their application. Also, service providers can evaluate the performance
of their services to improve on its performance to provide quality assurance and increase its
desirability.
5.4
Impact on the Industry
Through the introduction of sensitivity analysis into service-oriented software development,
this will allow developers to produce better software services as they can now effectively
measure the performance effects that factor variation may have upon their services.
Us-ing the information gathered through sensitivity analysis, a developer can then refine and
enhance their services to provide further quality assurance to its users.
method to evaluate a software service to identify whether the service is able to meet the
demands of their application and can withstand the factor variations in their SOA model.
In the end, sensitivity analysis performance evaluations on software services will help
to improve the software services industry and further promote SOA as a well-built, sturdy
platform to build applications upon. Not only will service providers be able to select the
Proposed Method
6.1
Methodology
6.1.1
Foundation for Proposed Method
The proposed method of addressing some of the performance related issues surrounding
the SOA software model stem from a technique introduced in the early 1700’s known as
Design of Experiment (DOE). Design of Experiment was initially introduced as a method
to identify what factors may trigger the onset of scurvy. It maintained the technique of
observing and judging the significant of the output of input variables that act alone, in
conjunction with one another, and at different values. Our proposed methodology applies
this technique to modern day software services to effectively evaluate the performance of
a software service. Its technique has been expanded to allow for the evaluation of factor
variations on performance analysis in a quantitative manner.
6.1.2
Overview of Proposed Method
This section outlines the underlying mechanics involved in sensitivity analysis for
multi-factor based applications. A service based application is typically composed of several
loosely coupled components. Each component may require several parameters as input
variables, and these variables may be discrete or continuous in nature [2]. The input
vari-ables to a software system can be considered as sensitivity factors. Sensitivity factors are
when changes in the input variable values affect the performance of the software system.
Sensitivity analysis aims to determine the impact that a particular or combination of
vari-ables will have if it differs from what is previously assumed.
6.1.3
Multi-Factor Based Sensitivity Analysis
Suppose we have a multi-factor based component with m factors A(w) where 1 ≤ w ≤
m. Each factor may accept values at different levels identified byiv for 1≤iw ≤aw. The
analysis must consider the effects of each factor individually, as well as the interactive
effects from two up to all m factors. Illustrated in Equation 1 is a model for a multi-factor
based sensitivity analysis with m factors.
Yi1i2...iml=µ+A
(1)
i1 +A (2)
i2 +...+A (m)
im
+A(1)A(i2)
1i2+A
1A(3)
i1i3+...+A
1A(m)
i1im
+A2A(i3)
2i3+A
2A(4)
i2i4+...+A
2A(m)
i2im
+...+
+A(m−1)A(im) m−1im
+A(1)A(2)A(i3)
1i2i3+...+A
(1)A(2)A(m)
i1i2im
+A(2)A(3)A(i4)
2i3i4+...+A
(2)A(3)A(m)
i2i3im
+A(m−2)A(m−1)A(im) m−2im−1im
+...+
+A(1)A(2)...A(im)
1i(2)...i(m)+εi1i2...iml
Equation 1 Model for Multi-Factor Based Sensitivity Analysis
The subsequent discussion illustrates a case where m = 4 factors, but the generalization
may apply to multiple factors. For the case of four factors, the general model takes the
form of Equation 2. A variance table is then constructed in Table I based upon this model.
yhi jkl =Ai+Bj+Ck+Dh+ABi j+ACik+ADih+BCjk+BDjh+CDkh+ABCi jk
+ABDi jh+ACDikh+BCDjkh+ABCDi jkh+µ+εi jkl
Equation 2 Model for Four-Factor Based Sensitivity Analysis
In the model,µ(the population mean) represents the average of all possible observations
for 1≤i≤n. Aiis the effect of the ith level of factor A,Bj is the effect of the jth level of
factor B,Ck is the effect of the kth level of factor C, and Dh is the effect of the hth level
of factor D. The joint effects of factors A, B, C, and D areABi j, ACik, ADih, BCjk, BDjh,
CDkh,ABCi jk, ABDi jh, ACDikh,BCDjkh, ABCDi jkh through the interaction betweenAi,Bj,
Ck, andDh. εi jkhl is a random error component.
There are a total of seven steps involved in determining the effects of each factor
indi-vidually and jointly on system performance.
1. A total of a * b * c * d * n experiments are to be performed with A, B, C, and D
observed response yi jkhl from each experiment is an output of a performance metric
during performance analysis when A, B, C, and D take values at different levels
in-dexed at i for 1≤i≤a, j for 1≤ j≤b, k for 1≤k≤c, and h for 1≤h≤d.
2. The mean of performance responses are calculated by keeping one factor constant
while varying the levels of all other factors within their value ranges. This process
will produce four group means yi..., y.j.., y..k., y...h where yi represents the total of
all experiment observations under the ith level of factor A,y.j.. under the jth level of
factor B,y..k.under the kth level of factor C, andy...hunder the hth level of factor D.
Equation 3 represent the marginal means yi..., y.j.., y..k., y...h for factor A, factor B,
factor C, and factor D.
yi... =
b
∑
j=1
c
∑
k=1
d
∑
h=1
n
∑
l=1
yi jkhl y¯i...= yi...
bcdn
y.j.. =
a
∑
i=1
c
∑
k=1
d
∑
h=1
n
∑
l=1
yi jkhl y¯.j.. = acdny.j..
y..k.=
a
∑
i=1
b
∑
j=1
d
∑
h=1
n
∑
l=1
yi jkhl y¯..k.= abdny..k.
y...h=
a
∑
i=1
b
∑
j=1
c
∑
k=1
n
∑
l=1
yi jkhl y¯...h= y...h
abcn
Equation 3 Individual Mean of Performance Responses
3. The mean of the joint performance responses are calculated. This process will
pro-duce 11 group means between yi j.., yi.k., yi..h, y.jk., y.j.h, y..kh, yi jk., yi j.h, yi.kh, y.jkh,
yi jkhfor factors A, B, C, and D.
yi j.. =
c
∑
k=1
d
∑
h=1
n
∑
l=1
yi jkhl y¯i j.. = yi j..
yi.k.=
b
∑
j=1
d
∑
h=1
n
∑
l=1
yi jkhl y¯i.k.= bdnyi.k.
yi..h=
b
∑
j=1
c
∑
k=1
n
∑
l=1
yi jkhl y¯i..h= yi..h
bcn
y.jk.=
a
∑
i=1
d
∑
h=1
n
∑
l=1
yi jkhl y¯.jk.=
y.jk.
adn
y.j.h=
a
∑
i=1
c
∑
k=1
n
∑
l=1
yi jkhl y¯.j.h= yacn.j.h
y..kh=
a
∑
i=1
b
∑
j=1
n
∑
l=1
yi jkhl y¯..kh= y..kh
abn
yi jk.=
d
∑
h=1
n
∑
l=1
yi jkhl y¯i jk.=
yi jk.
dn
yi j.h=
c
∑
k=1
n
∑
l=1
yi jkhl y¯i j.h= ycni j.h
yi.kh=
b
∑
j=1
n
∑
l=1
yi jkhl y¯i.kh= yi.kh
bn
y.jkh=
a
∑
i=1
n
∑
l=1
yi jkhl y¯.jkh = yan.jkh
yi jkh=
n
∑
l=1
yi jkhl y¯i jkh= yi jkh
n
Equation 4 Join Mean of Performance Responses
4. The overall meany....of performance responses is calculated.
y....= a
∑
i=1
b
∑
j=1
c
∑
k=1
d
∑
h=1
n
∑
l=1
yi jkhl y¯....= yi...
abcdn
Equation 5 Overall Mean of Performance Responses
5. The sum of squares is calculated for each individual factor as well as for all the
SSA= bcdn1
a
∑
i=1
y2i...−abcdny2....
SSB= acdn1
b
∑
j=1
y2.j.. −abcdny2....
SSC= abdn1
c
∑
k=1
y2..k.−abcdny2....
SSD= abcn1
d
∑
h=1
y2...h−abcdny2....
SSAB= cdn1
a
∑
i=1
b
∑
j=1
y2i j.. −abcdny2.... −SSA−SSB
SSAC= bdn1
a
∑
i=1
c
∑
k=1
yi2.k.−abcdny2.... −SSA−SSC
SSAD= bcn1
a
∑
i=1
d
∑
h=1
y2i..h−abcdny2.... −SSA−SSD
SSBC= adn1
b
∑
j=1
c
∑
k=1
y2.jk.−abcdny2.... −SSB−SSC
SSBD= acn1
b
∑
j=1
d
∑
h=1
y.2j.h−abcdny2.... −SSB−SSD
SSCD= abn1 c
∑
k=1
d
∑
h=1
y2..kh−abcdny2.... −SSC−SSD
SSABC= dn1
a
∑
i=1
b
∑
j=1
c
∑
k=1
y2i jk.−abcdny2.... −SSA−SSB−SSC−SSAB−SSAC−SSBC
SSABD= cn1
a
∑
i=1
b
∑
j=1
d
∑
h=1
y2i j.h−abcdny2.... −SSA−SSB−SSD−SSAB−SSAD−SSBD
SSACD= bn1
a
∑
i=1
c
∑
k=1
d
∑
h=1
y2i.kh−abcdny2.... −SSA−SSC−SSD−SSAC−SSAD−SSCD
SSBCD= an1 b
∑
j=1
c
∑
k=1
d
∑
h=1
SSABCD= 1n
a
∑
i=1
b
∑
j=1
c
∑
k=1
d
∑
h=1
y2i jkh−abcdny2.... −SSA−SSB−SSC−SSD−SSAB−SSAC−SSAD−
SSBC−SSBD−SSCD−SSABC−SSABD−SSACD−SSBCD
SST =
a
∑
i=1
b
∑
j=1
c
∑
k=1
d
∑
h=1
n
∑
l=1
y2i jkhl −abcdny2....
SSE =SST−SSA−SSB−SSC−SSD−SSAB−SSAC−SSAD−SSBC−SSBD−SSCD−
SSABD−SSACD−SSBCD−SSABCD
Equation 6 Sum of Squares
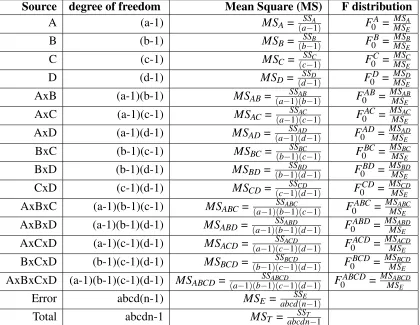
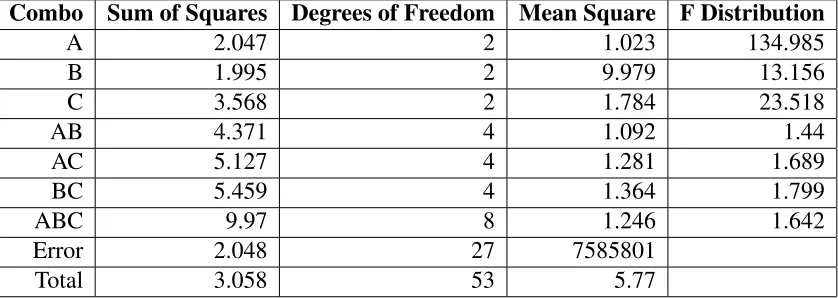
6. Complete the variance table illustrated in Table 6 for each factor and their
interac-tions with the calculated sum of squares and F distribution values. The degree of
freedom (df) represents the number of independent variables for each associated sum
of squares. Furthermore, a mean square (MS) is produced by dividing each sum of
square by its degree of freedom. The final F distribution is obtained by dividing the
Source degree of freedom Mean Square (MS) F distribution
A (a-1) MSA = SSA
(a−1) F
A
0 =
MSA
MSE
B (b-1) MSB = (bSS−B1) F0B = MSMSBE
C (c-1) MSC = SSC
(c−1) F
C
0 =
MSC
MSE
D (d-1) MSD= (dSS−D1) F0D= MSMSDE
AxB (a-1)(b-1) MSAB = SSAB
(a−1)(b−1) F
AB
0 =
MSAB
MSE
AxC (a-1)(c-1) MSAC= SSAC
(a−1)(c−1) F0AC =
MSAC
MSE
AxD (a-1)(d-1) MSAD= (a−SS1)(ADd−1) F0AD= MSMSADE
BxC (b-1)(c-1) MSBC= SSBC
(b−1)(c−1) F
BC
0 =
MSBC
MSE
BxD (b-1)(d-1) MSBD= (b−SS1)(BDd−1) F0BD= MSMSBDE
CxD (c-1)(d-1) MSCD = SSCD
(c−1)(d−1) F
CD
0 =
MSCD
MSE
AxBxC (a-1)(b-1)(c-1) MSABC= SSABC
(a−1)(b−1)(c−1) F0ABC=
MSABC
MSE
AxBxD (a-1)(b-1)(d-1) MSABD = (a−1)(SSb−ABD1)(d−1) F0ABD = MSMSABDE
AxCxD (a-1)(c-1)(d-1) MSACD= SSACD
(a−1)(c−1)(d−1) F
ACD
0 =
MSACD
MSE
BxCxD (b-1)(c-1)(d-1) MSBCD= SSBCD
(b−1)(c−1)(d−1) F0BCD=
MSBCD
MSE
AxBxCxD (a-1)(b-1)(c-1)(d-1) MSABCD= SSABCD
(a−1)(b−1)(c−1)(d−1) F
ABCD
0 =
MSABCD
MSE
Error abcd(n-1) MSE = SSE
abcd(n−1)
Total abcdn-1 MST = SST
abcdn−1
Table 6.1: Example of a Four-Factor Variance Table
7. The final step is to compare each F distribution value with the cumulative F
distri-bution table value Fα,d f1,d f2. A significant effect on the performance of a software
system can be determined if the individual factor effect or a joint group of several
factors corresponding F distribution value exceedsFα,d f1,d f2. The confidence interval
is represented by ? and df1 and df2 are the degrees of freedom. The F-Distribution
6.2
Sensitivity Analysis Web Service
6.2.1
Overview
The procedure to evaluate a software systems performance through the utilization of
sen-sitivity analysis has been implemented into an algorithm. The algorithm is based upon the
methodology for multi-factor based sensitivity analysis. The sensitivity analysis
compo-nent accepts a sample from one or more web services with its performance responses at
various factor values. The component uses this sample to generate a variance table that
de-termines which factors (both individual and collaboratively) have the most significant effect
on performance. This component has been extended into a service that is distributed over
the Internet to allow any service provider to perform sensitivity analysis on their services to
identify which factors have the greatest impact on their services output. Additionally, this
component allows a service requestor to evaluate the performance of two services to
iden-tify which service is the most optimal to use based upon their sensitivity to factor variation.
6.2.2
Implementation Details
The sensitivity analysis service follows steps two to seven as outlined in our multi-factor
based sensitivity analysis methodology. Step one is reserved as input for the service. The
service uses the inputted dataset to create a variance table and calculate the F distribution.
The service exposes two modules, each with their own objective:
1. getVarianceTable - Generate a variance table that identifies the individual and joint
effects of each factor based upon their sensitivity to factor variation.
sensitivity service as the most ideal service to use based upon their sensitivity to
factor variation.
Input
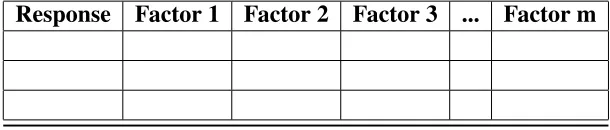
The input for the getVarianceTable module is a collection of data from our software system
or service. This data includes each factor and its value, as well as the response from the
system. The data inputted into the algorithm can be observed and represented by Table
6.2.2.
Response Factor 1 Factor 2 Factor 3 ... Factor m
Table 6.2: Sample Web Service Input
The input for the getVarianceTable module accepts a multi-dimensional array, A, where
A[x][0] is the response from the system for 0 ¡= x ¡= length(A) and where A[x][i] is the
value of each factor at 1 ? i ? n.
The input for the compareServices module that is responsible for performing a sensitivity
analysis based comparison to identify the most optimal less sensitivity service has similar
input requirements as the getVarianceTable. It accepts two multi-dimensional arrays, each
with a sample of data gathered from each service. The structure of the array is identical to
the one used in the getVarianceTable module.
Output
The sensitivity analysis operation getVarianceTable generates a variance table with the
the user in the form a multi-dimensional array. The end user may use this information to
identify the role and effect that each factor (and their combinations) have on the systems
performance.
The second operation, compareServices, calculates each services sensitivity to factor
variation and identifying the less sensitive service as the most ideal service to use by a
service requestor. The operation simply returns the statement ”Service A is less sensitivity”,
or ”Service B is less sensitivity”, where Service A is the first input and Service B is the
second input to the compareServices operation.
6.2.3
Design
The sensitivity analysis service was developed using the Java programming language. The
java programming language was selected as the development language because it is
plat-form independent and it supports most major web service implementation techniques. The
algorithm was initially developed to runs as a standalone java class, however it has been
ex-tended into a web service so that it may be distributed over the internet and used in a wide
array of software applications. The service was developed using the SOAP implementation
technique because of SOAP’s wide acceptance for supporting higher end services.
There are two components to the sensitivity analysis service that aide in generating
the variance table and performing the comparison. The first component is a combination
generator. The combination generator is responsible for generating all 2n possible
combi-nations for any number of factors [6]. The second component is responsible for performing
sensitivity analysis through the use of the steps outlined in the methodology.
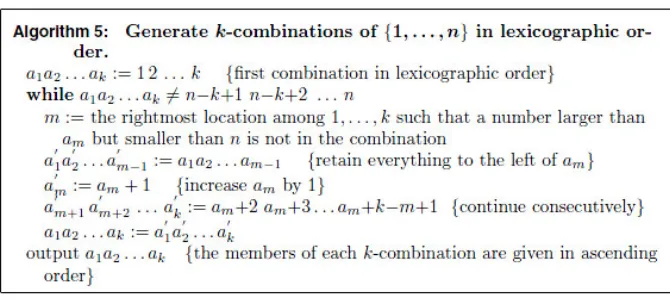
Combination Generator
It was provided by Rosen in his textbook Discrete Mathematics and its Applications, 2007
Figure 6.1: Combination Generator Algorithm
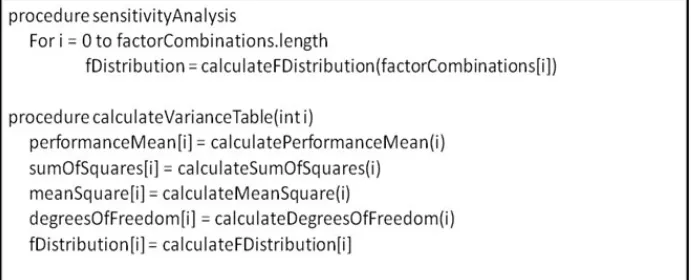
Sensitivity Analysis
After all combinations are identified, the steps outlined in the methodology are executed
with the input array. These steps involve:
• Calculating the mean of performance responses for each individual factor.
• Calculating the mean of performance responses for each combination of factors.
• Calculating the overall mean of performance responses.
• Calculating the sum of squares for each factor.
• Calculating the degrees of freedom.
Figure 6.2: Sensitivity Analysis Algorithm
Performing these steps will generate a variance table for the software service in
ques-tion. The compareServices operation has an additional step that involves comparing the
F distribution for the combination of all factors withFα,d f1,d f2 whereα is our confidence
level, and df is our degrees of freedom to determine whether all factors in combination have
a significant impact on performance, and which of the two input services are less sensitive
to factor variation. Performance is affected if the F distribution value exceedsFα,d f1,d f2.
6.2.4
Time Complexity
The algorithm contains two main components; the combination generator and sensitivity
analysis. The combination generator is responsible for identifying all individual and joint
factor combinations. The sensitivity analysis algorithm calculates the mean square, sum of
squares, degrees of freedom, and F-distribution.
Suppose there are n factors, then there are 2n individual and joint factors we must
consider, as generated by the combination generator. The algorithm iterates through all
Figure 6.3: Algorithm Time Complexity Analysis
The calculateFDistribution action is executed a total of 2n times since the length of
factorCombinations is 2n. Thus, the sensitivity analysis algorithm has a running time of
Experiment And Analysis
7.1
Experiment Analysis
7.1.1
Overview
To evaluate the performance of the sensitivity analysis service, an experiment is designed
to demonstrate the advantages of using sensitivity analysis for service evaluation and
ser-vice selection. Through this experiment, it is demonstrated how sensitivity analysis can
address performance issues and improve the SOA software model from the standpoint of
both the service providers, and the service requestors. Two web services have been created,
Service A and Service B. Both web services have the same objective of helping the user
select the most ideal vacation spot based on proximity to their current location, and desired
destination temperature. Both Service A and Service B are composed of several smaller
services to achieve their objective. Each service is unique which plays a critical role for
the adjustment of relationships between services. The sensitivity analysis service that is
created will be applied to both software services. Based upon the results, the service that
is less sensitivity to factor variation would be chosen as the most optimal service to use
by a service requestor. The service that is most sensitivity to factor variation will then be
modified and improved in hopes of reducing its individual and joint factor sensitivity. The
sensitivity analysis comparison service is then performed again to show that the initial
ser-vice that was more sensitive to factor variation is now improved and is less sensitive then
the alternative service, thus is ultimately selected as the most optimal service. As
demon-strated by the first part of the experiment, applying sensitivity analysis to SOA resolves
performance issues related to service selection by helping service requestors to select the
best service available for them to use. The second part of the experiment demonstrates that
through the application of sensitivity analysis, a service provider can identify which factor
and which combination of factors are most sensitivity to change, and improve their service
accordingly to make them more desirable. This will ensure the production of high quality
services.
7.1.2
Experiment Requirements
In order to successfully deploy the experiment involving two services and sensitivity
anal-ysis, various hardware and software requirements must be met. Table 7.1.2 illustrates the
hardware requirements for the experiment. Table 7.1.2 outlines the software requirements
Product Description Specifications Personal Computer A computer is required to act
as a host for all software ser-vices. As well, the PC is re-quired to execute the experi-ment with the sensitivity anal-ysis service.
Sufficient specifications are required to meet the demand of the selected operating sys-tem, Windows 7.
Table 7.1: Experiment Hardware Requirements
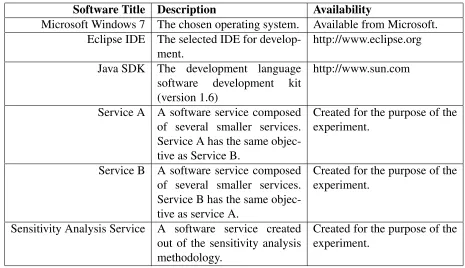
Software Title Description Availability
Microsoft Windows 7 The chosen operating system. Available from Microsoft. Eclipse IDE The selected IDE for
develop-ment.
http://www.eclipse.org
Java SDK The development language software development kit (version 1.6)
http://www.sun.com
Service A A software service composed of several smaller services. Service A has the same objec-tive as Service B.
Created for the purpose of the experiment.
Service B A software service composed of several smaller services. Service B has the same objec-tive as service A.
Created for the purpose of the experiment.
Sensitivity Analysis Service A software service created out of the sensitivity analysis methodology.
Created for the purpose of the experiment.
Table 7.2: Experiment Software Requirements
7.1.3
Sample Services
The experiment requires that two web services with similar end objectives be used to
per-form the sensitivity analysis experiment. To fulfill this requirement, two services, Service
vacation destinations based upon the desired destination temperature and the destinations
proximity to their current location. There are a total of thirty destinations available, each
being a popular city located in the U.S.A.
Both services are composes of several smaller services to achieve their end objective.
A total of three services are used in both Service A and Service B. This will allow us to
identify the individual and joint effect each service has on the services performance.
The implementation method for both Service A and Service B is based on the SOAP
model. The SOAP model was chosen because it provides the most flexibility and greatest
compatibility across platforms. The Java development language was used during
develop-ment.
The services consist of several loosely coupled components operating independently as
web services. These components are connected through the control interface. The interface
executes each individual service sequentially, collecting the results from one service and
passing that information on to the following service. During the creation of Service A and
Service Name Description Availability GlobalWeather Retrieves the weather for a
de-sired city.
http://www.webservicex.net
CityZipService Determines the zip code in the desired cities.
http://www.ecocoma.com/
DistanceService Calculates the distance be-tween two zip codes.
http://www.ecocoma.com/
Table 7.3: Service A Composition
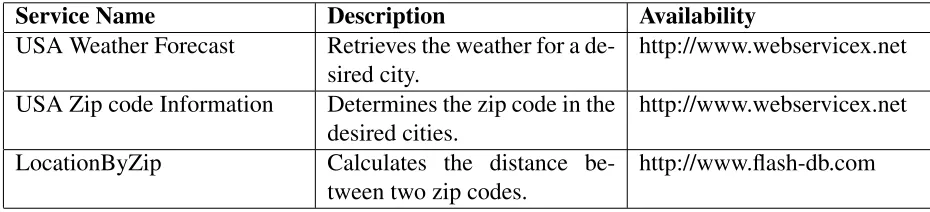
Service Name Description Availability
USA Weather Forecast Retrieves the weather for a de-sired city.
http://www.webservicex.net
USA Zip code Information Determines the zip code in the desired cities.
http://www.webservicex.net
LocationByZip Calculates the distance
be-tween two zip codes.
http://www.flash-db.com
Table 7.4: Service B Composition
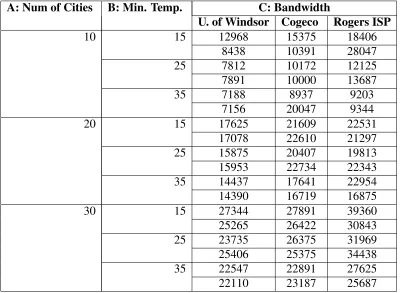
7.2
Case Study
A total of three factors are chosen for this study. Factor A is the number of cities to use as
potential vacation spots in the U.S.A. Factor B is the minimum desired destination
temper-ature (degrees Celsius), and factor C is the ISP (Internet Service Provider) of the current
internet connection. Each factor has variations at three fixed levels, and a total of two
ex-periments are performed with factors A, B, and C. Factors A, B, and C are set to different
values indexed respectively at i for 1≤i≤3, j for 1≤ j≤3, and k for 1≤k≤3. Through
the use of the multi-factor based sensitivity analysis service, the data sample for Service A
and Service B is collected and displayed in Table 7.3.1 and Table 7.3.1. The variance table