ABSTRACT
ROGERS, MARTHA KINNEY. Explaining Performance Measurement Utilization and Benefits: An Examination of Performance Measurement Practices in Local
Governments. (Under the direction of Charles K. Coe).
Performance measurement (PM) has been used in management, budgeting, and
reporting to stakeholders. Although local governments’ use of PM has grown considerably
over the past two decades, little empirical evidence explains variation in usage and benefits.
Most research has been normative or descriptive, with the exception of a few multivariate
models.
Using structural equation modeling and a survey administered by the Governmental
Accounting Standards Board, this dissertation tests three models used to explain PM
utilization and benefits in local governments: (1) Kong’s 1998 model examined differences
in factors that influence PM utilization in management and budgeting. The influential factors
are organizational culture, rewards and sanctions, leadership, involvement of the central
budget office, citizen/elected official participation, measurement capacity, and data quality.
(2) Wang’s 2002 model proposed differences in impacts from PM utilization in management,
budgeting, and reporting. The impacts are improved communication, decision-making,
coordination, efficiency, and effectiveness. (3) Ammons and Rivenbark 2005 research
showed that a comprehensive PM approach (using PM in budget decisions, managing
contracts, strategic planning, comparative benchmarking, and evaluating results) had a
stronger effect on service improvement than PM utilization in reporting alone.
Testing these models revealed important differences between PM utilization in
management, budgeting, and reporting. Rewards and sanctions were significantly associated
the central budget office most strongly influenced PM utilization in budgeting. The existence
of high quality data most influenced PM utilization in reporting.
PM utilization in management was more related to long-term benefits of efficiency and
effectiveness than budgeting or reporting. PM utilization in budgeting was strongly
associated to the short-term benefit of improved decision-making but only moderately
associated with improved efficiency. PM utilization in reporting was strongly related with
improved decision-making and improved effectiveness. Finally, a comprehensive PM
approach including management, benchmarking, budget decision-making, and strategic
planning shows a higher relationship with improved service improvement than using PM in
Explaining Performance Measurement Utilization and Benefits:
An Examination of Performance Measurement Practices in Local Governments
By
Martha Kinney Rogers
A dissertation submitted to the Graduate Faculty of North Carolina State University in partial fulfillment of the
Requirements for the degree of Doctor of Philosophy
PUBLIC ADMINISTRATION
2006
APPROVED BY:
_______________________ ______________________
Kenneth A. Klase, D.P.A Dennis M. Daley, Ph.D.
_______________________ ______________________
James E. Swiss, Ph.D. G. David Garson, Ph.D.
___________________
DEDICATION
I dedicate this dissertation to my mother and father, June and Margie Kinney, my
husband, Darrell Rogers, and my children, Duane and Danny Rogers for all the sacrifices
they have made in time, money, and other resources for me to pursue my education.
This dissertation is also written as a challenge to my grandchildren: Zackary, Skyler,
Drew, Caleb, and Abbey Rogers for them to enjoy learning and to use increased knowledge
BIOGRAPHY
Martha Kinney Rogers was born in Randolph County, North Carolina to Robert
(June) and Margie Kinney in 1951. She attended elementary school and high school in
Randolph and Guilford County, graduating from Eastern Randolph High School in 1969.
During the early part of her career, she balanced caring for her two sons, Duane and Danny
and working for Walker Shoe Company as an inventory control clerk. She advanced to a
Cost Accountant for the company and continued to work full-time there after she returned to
school in 1980. She took college transfer classes from Randolph Community College,
transferring those to the University of North Carolina at Greensboro (UNC-G). She
graduated summa cum laude from UNC-G in 1986 with a bachelor’s degree in accounting.
In 1987, Martha became a Certified Public Accountant. In 1994, she became a Certified
Internal Auditor.
Martha began her government career with Guilford County as an Internal Auditor in
1987. Being dissatisfied with government work, she returned to UNC-G to begin work on a
Masters in Business Administration. By the time she graduated in 1993, she had finally
begun to understand that government work is about equity, not just efficiency and
effectiveness. After a stint in the budget office, Martha was promoted to the Internal Audit
Director in 1996. Desiring to gain more experience in research and knowledge about public
administration, Martha was admitted into the Ph.D. program at North Carolina State
University in 2001. She pursued interests of budgeting, performance measurement, finance,
auditing, and non-profit accountability for government funding during her time there.
techniques to beginning auditors for the Institute of Internal Auditors. In addition, she has
taught several accounting and business classes at community colleges and local universities.
Martha has also assisted in individual income tax preparation at a local CPA firm.
Professionally, Martha has served as the President of the Triad Chapter of The
Institute of Internal Auditors and the President of the Piedmont Triad American Society for
Public Administration Chapter. She has also been the Sunday School Secretary for her
ACKNOWLEDGEMENTS
I would like to acknowledge all who have helped me in this endeavor. All of the
faculty and support staff at the Public Administration program at North Carolina State have
been most helpful. Particularly, I would like to thank my committee. My Committee Chair,
Dr. Coe has helped in innumerable ways, from helping me decide on a topic, securing a data
set, and in editing the dissertation. The data analysis could not been accomplished without
Statnotes and input from Dr. Garson. Dr. Swiss assisted by always asking questions that
stimulate the thought process. Dr. Daley and Dr. Klase have been most helpful in the
organization of the dissertation.
I would also like to thank my fellow “bureaucrats” at Guilford County. Internal
Audit Staff and Budget Staff have been most supportive. My personal thanks to Celeste
Williams, Julia Courts, and Della Clapp in Internal Audit and J. D. Rowland, Betty Matherly,
Melodie Shimer, Myra Thompson, Randy Friddle, and Laura Pass in the Budget Office.
Finally, without the Government Accounting Standards Board sponsoring the survey
that was conducted and the Sloan Foundation’s funding of the project, the data set would not
have been available. I would also like to thank Katherine Willoughby who provided the data
TABLE OF CONTENTS
LIST OF TABLES... xii
LIST OF FIGURES ... xv
CHAPTER 1: INTRODUCTION TO THE STUDY... 1
HISTORY OF PERFORMANCE MEASUREMENT ... 2
Scientific Management ... 2
Program Budgeting ... 2
Total Quality Management (TQM)... 4
New Public Management (NPM)... 5
Results Based Management (RBM)... 8
Reporting... 9
HOW THE CURRENT RESEARCH ADDS TO THE BODY OF KNOWLEDGE... 11
PREVIEW OF UPCOMING CHAPTERS... 12
CHAPTER 2 LITERATURE REVIEW... 14
ORGANIZATIONAL FACTORS... 14
Organizational Culture... 15
Evidence Pertaining to Organizational Culture ... 16
Goal Clarity ... 16
Evidence Pertaining to Organizational Goal Clarity ... 18
HUMAN FACTORS ... 19
Training... 21
Evidence Pertaining to Training ... 21
Stakeholder Involvement... 22
Evidence Pertaining to Stakeholder Involvement... 23
Leadership... 25
Evidence Pertaining to Leadership ... 28
MEASUREMENT FACTORS ... 29
Measurement Capacity ... 29
Evidence Pertaining to Measurement Capacity ... 30
Data Quality... 34
Evidence Pertaining to Data Quality... 36
BENEFITS RESULTING FROM PM UTILIZATION ... 37
IMMEDIATE PM BENEFITS ... 37
Communication Benefits ... 37
Evidence Pertaining to Communication Benefits ... 38
Decision-Making Benefits... 39
Evidence Pertaining to Decision-Making Benefits... 41
Coordination Benefits ... 43
Evidence Pertaining to Coordination Benefits... 43
LONG TERM PM BENEFITS... 44
Efficiency Benefits... 45
Effectiveness Benefits... 49
Evidence Pertaining to Effectiveness Benefits ... 49
OTHER FACTORS THAT INFLUENCE PM UTILIZATION AND BENEFITS ... 52
Type Of Program Or Agency ... 52
Influence Of Unions ... 53
Size Of The Jurisdiction ... 53
Form Of Government... 53
City Versus County ... 54
Evidence Pertaining to City Versus County PM Utilization ... 54
Respondent Position In The Organization... 55
Evidence Pertaining to Respondent Position in the Organization ... 55
PERFORMANCE MEASUREMENT MODELS ... 56
Evidence Pertaining to Models that Explain PM Utilization... 56
Evidence Pertaining to Models that Explain PM Benefits... 61
Comprehensive Approach... 64
Evidence Pertaining to Comprehensive Utilization of PM... 64
HYPOTHESES DERIVED FROM LITERATURE REVIEW ... 67
CHAPTER TWO SUMMARY... 73
CHAPTER 3 METHODOLOGY... 75
INTRODUCTION ... 75
RESEARCH DESIGN ... 75
THREATS TO VALIDITY ... 77
Internal Validity ... 77
External Validity ... 78
Use of Perceptual Data... 79
SAMPLING ... 81
VARIABLE OPERATIONALIZATION ... 81
PM Utilization: Dependent and Independent Variables... 81
Independent Variables ... 82
Dependent Variables... 84
Control Variables... 86
CONTROL... 90
DATA ANALYSIS PROCEDURES... 90
SUMMARY OF HYPOTHESES ... 91
CHAPTER 4 UNIVARIATE STATISTICAL ANALYSIS ... 95
UTILIZATION OF PM: DEPENDENT AND INDEPENDENT VARIABLES... 95
Reported PM Utilization for Management ... 95
Reported PM Utilization for Budgeting... 96
Reported PM Utilization for Reporting ... 97
INDEPENDENT VARIABLES ... 101
Reported Rewards and Sanctions ... 101
Observed Measurement Capacity ... 102
Observed Leadership ... 103
Observed Data Quality ... 105
Observed Stakeholder Involvement... 105
Observed Organizational Culture... 107
DEPENDENT VARIABLES: PERCEIVED BENEFITS OF PM... 107
Perceived Communication Improvement ... 107
Perceived Decision-Making Improvement... 108
Perceived Coordination Improvement... 109
Perceived Effectiveness Improvement... 109
Perceived Efficiency Improvement ... 110
CONTROL VARIABLES ... 114
Form of Government... 114
Respondent Position... 114
Tenure and Performance Measurement Experience... 115
DATA ANALYSIS... 116
Cronbach’s Alpha ... 116
Assessment of Normality ... 117
Missing Data... 119
Outliers ... 121
CONCLUSION... 121
CHAPTER 5 BIVARIATE STATISTICAL ANALYSIS ... 122
INDEPENDENT VARIABLES – FACTORS THAT PROMOTE PM UTILIZATION 123 Observed Organizational Culture and PM Utilization... 124
Reported Rewards and Sanctions and PM Utilization ... 124
Observed Training and PM Utilization ... 125
Observed Involvement of Stakeholders and PM Utilization ... 125
Observed Leadership Commitment and PM Utilization... 125
Observed Measurement Capacity and PM Utilization ... 126
Observed Data Quality and PM Utilization ... 126
Findings and Discussion... 126
DEPENDENT VARIABLES – PERCEIVED BENEFITS FROM PM UTILIZATION 128 Perceived Communication Improvement and PM Utilization ... 129
Perceived Decision-making Improvement and PM Utilization ... 129
Perceived Coordination Improvement and PM Utilization ... 129
Perceived Efficiency Improvements and PM Utilization ... 130
Perceived Effectiveness Improvement and PM Utilization... 130
Findings and Discussion... 130
CONTROL VARIABLES ... 131
County and City Perspectives ... 134
Findings on City County Differences ... 136
Position of the Respondents ... 136
Position and PM Utilization... 137
Position and PM Utilization Promoting Factors ... 138
Tenure with the Government ... 139
Experience working with PM and PM Utilization... 139
Experience working with PM and Promoting Factors... 139
Experience working with PM and Perceived Benefits ... 139
Findings on Respondent Perspectives... 140
DATA LIMITATIONS... 141
Testing the Assumptions of Correlation... 141
Effects of Missing Data... 143
THEORETICAL RELEVANCE OF BIVARIATE RELATIONSHIPS... 151
Similarities Between Reported PM Utilization in Management, Budgeting, and Reporting... 151
Differences Between Reported PM Utilization in Reporting, Management, and Budgeting ... 151
CONCLUSION... 152
CHAPTER 6 MULTIVARIATE ANALYSIS - TESTING KONG’S INTERNAL DETERMINANT MODEL OF FACTORS PROMOTING PERFORMANCE UTILIZATION IN MANAGEMENT, BUDGETING, AND REPORTING ... 155
INTRODUCTION ... 155
KONG’S MODEL... 155
MEASURES ... 158
Dependent Variables... 158
Reported PM Utilization in Management ... 158
Reported PM Utilization in Budgeting ... 159
Reported PM Utilization in Reporting... 159
Independent Variables ... 160
Observed Organizational Culture ... 160
Observed Goal Clarity or Reported Rewards and Sanctions ... 161
Observed Training ... 162
Observed Involvement of Stakeholders ... 162
Observed Commitment of Leadership ... 163
Observed Measurement Capacity ... 164
Observed Data Quality... 165
DATA ANALYSIS... 165
Data Screening... 165
Measurement Model... 166
Post Hoc Modifications... 173
Model Fit... 175
Testing the Assumptions of SEM... 176
FINDINGS AND DISCUSSIONS ... 177
CHAPTER 7 MULTIVARIATE ANALYSIS - TESTING THE BENEFITS PROVIDED BY PM UTILIZATION IN MANAGEMENT, BUDGETING, AND REPORTING: WANG’S “IMMEDIATE” AND “LONG-TERM” IMPACT MODEL
& AMMONS-RIVENBARK COMPREHENSIVE UTILIZATION MODEL... 184
INTRODUCTION ... 184
WANG’S MODEL ... 184
MEASURES ... 187
Independent Variables ... 187
Reported PM Utilization in Management ... 187
Reported PM Utilization in Budgeting ... 188
Reported PM Utilization in Reporting... 188
DEPENDENT VARIABLES... 188
Perceived Communication Improvement ... 188
Perceived Coordination Improvement ... 188
Perceived Decision-making Improvement... 189
Perceived Effectiveness Improvement... 189
Perceived Efficiency Improvement... 189
DATA ANALYSIS... 189
Data Screening... 189
Measurement Model... 190
Post Hoc Modifications... 196
Model Fit... 198
FINDINGS AND DISCUSSIONS ... 199
AMMONS-RIVENBARK MODEL... 202
MEASURES ... 203
Independent Variables ... 203
Reported PM Utilization in a Comprehensive Management System ... 204
Reported PM Utilization in Budget Reporting ... 205
Reported PM Utilization in Reporting... 205
Dependent Variable ... 205
Improved Service Improvement ... 205
DATA ANALYSIS... 205
Data Screening... 205
Measurement Model... 206
Post Hoc Modifications... 213
Model Fit... 214
Testing the Assumptions of SEM... 216
FINDINGS AND DISCUSSIONS ... 217
CONCLUSION... 218
CHAPTER 8 COMPARING THE MODELS... 222
INTRODUCTION ... 222
SIMILARITIES AND DIFFERENCES IN ASSUMPTIONS BETWEEN KONG AND REVISED KONG-ROGERS MODEL... 222
Measurement Factors ... 225
SIMILARITIES AND DIFFERENCES IN KONG AND REVISED KONG-ROGERS MODEL FINDINGS... 225
Organizational Factors... 225
Human Factors ... 226
Measurement Factors ... 227
Comparing the Goodness of Fit and Explained Variance of the Kong and Kong-Rogers Model ... 228
SIMILARITIES AND DIFFERENCES IN ASSUMPTIONS BETWEEN WANG AND AMMONS-RIVENBARK MODELS ... 230
Differences and Similarities Between the Two Models in PM Utilization... 231
Differences and Similarities Between the Two Models in Testing Perceived Benefits. 232 Communication or Data Quality – which is important in bringing improvements in the long-term effects of PM?... 233
SIMILARITIES AND DIFFERENCES IN WANG AND AMMONS-RIVENBARK MODEL FINDINGS... 234
Comparing the Goodness of Fit and Explained Variance of the Wang and Ammons-Rivenbark Models ... 235
CONCLUSION... 236
CHAPTER 9 CONCLUSION... 238
INTRODUCTION ... 238
SUMMARY OF FINDINGS ... 238
Factors that Promote Performance Measurement Utilization ... 238
Perceived Benefits of Performance Measurement Utilization... 244
Comprehensive Approach to PM Utilization... 247
PRACTICAL APPLICATIONS AND IMPLICATIONS OF THE FINDINGS ... 249
PM Utilization in Management... 249
PM Utilization in Budgeting ... 249
PM Utilization in Reporting... 250
FUTURE DIRECTIONS IN RESEARCH ... 251
CONCLUSION... 251
REFERENCES... 255
APPENDIX ... 264
LIST OF TABLES
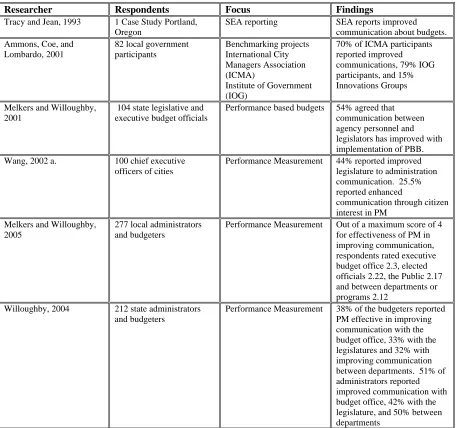
TABLE 2-1 SURVEY EVIDENCE PERTAINING TO PERCEIVED COMMUNICATION AS A BENEFIT OF
REPORTED PM UTILIZATION... 39
TABLE 2-2 SURVEY EVIDENCE PERTAINING TO PERCEIVED DECISION-MAKING AS A BENEFIT OF REPORTED PM UTILIZATION... 42
TABLE 2-3 SURVEY EVIDENCE PERTAINING TO PERCEIVED COORDINATION AS A BENEFIT OF REPORTED PM UTILIZATION... 44
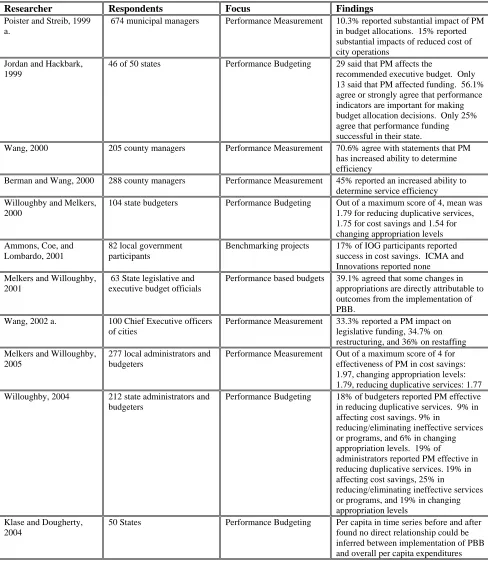
TABLE 2-4 SURVEY AND EMPIRICAL EVIDENCE PERTAINING TO PERCEIVED EFFICIENCY AS A BENEFIT OF REPORTED PM UTILIZATION... 48
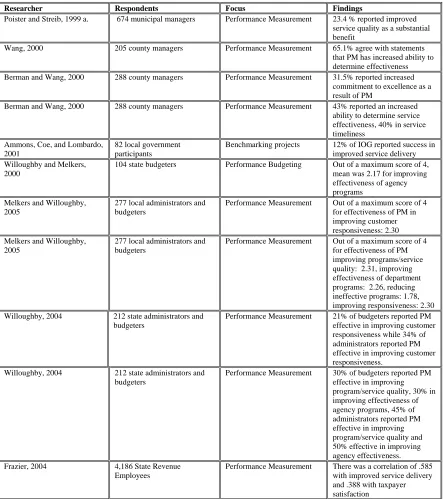
TABLE 2-5 SURVEY AND EMPIRICAL EVIDENCE PERTAINING TO PERCEIVED EFFECTIVENESS AS A BENEFIT OF REPORTED PM UTILIZATION... 51
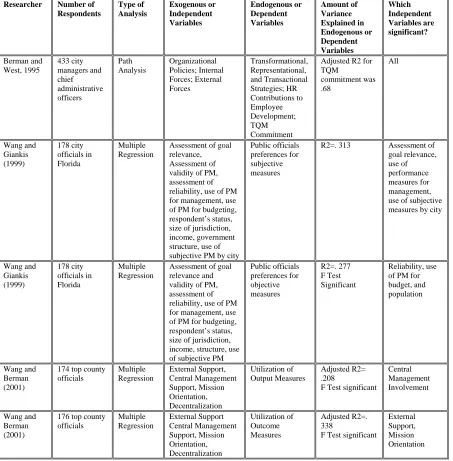
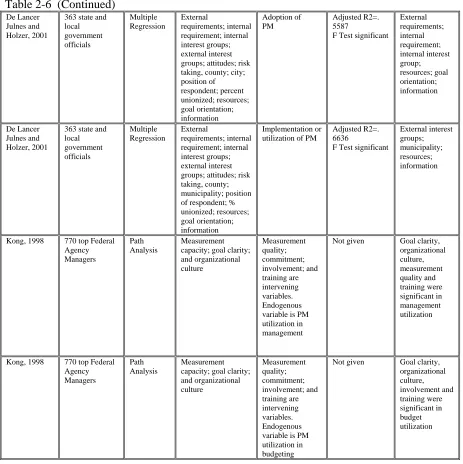
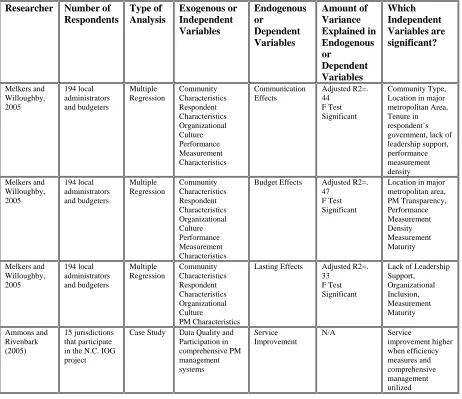
TABLE 2-6 EMPIRICAL EVIDENCE USING MULTIVARIATE ANALYSIS TO EXAMINE PROMOTING FACTORS OF PM UTILIZATION... 57
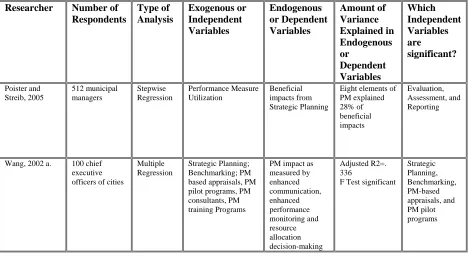
TABLE 2-7 EMPIRICAL EVIDENCE USING MULTIVARIATE ANALYSIS TO EXAMINE BENEFITS OF PM UTILIZATION... 61
TABLE 2-8 EVIDENCE USING COMPREHENSIVE UTILIZATION TO EXAMINE BENEFITS OF PM UTILIZATION... 65
TABLE 2-9 EXPECTED RELATIONSHIPS BETWEEN INDEPENDENT VARIABLES AND REPORTED PM UTILIZATION... 68
TABLE 2-10 EXPECTED RELATIONSHIPS BETWEEN REPORTED PM UTILIZATION AND DEPENDENT VARIABLES... 70
TABLE 2-11 SUMMARY OF EXPECTED DIFFERENCES IN CONTROL VARIABLES... 71
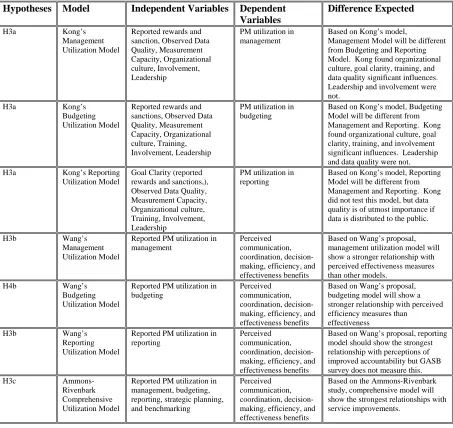
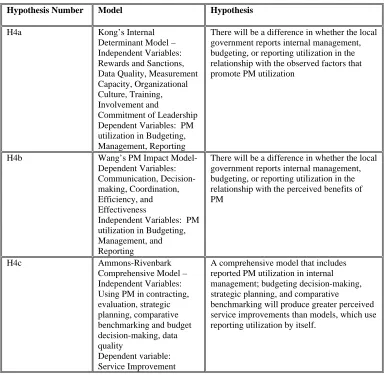
TABLE 2-12 HYPOTHESIZED EFFECTS OF SEVEN MODELS TO BE EXAMINED... 72
TABLE 3-1 OPERATIONALIZATION OF VARIABLES... 87
TABLE 3-2 SUMMARY OF INDEPENDENT VARIABLES... 92
TABLE 3-3 SUMMARY OF DEPENDENT VARIABLES... 93
TABLE 3-4 SUMMARY OF MULTIVARIATE MODELS TO BE TESTED... 94
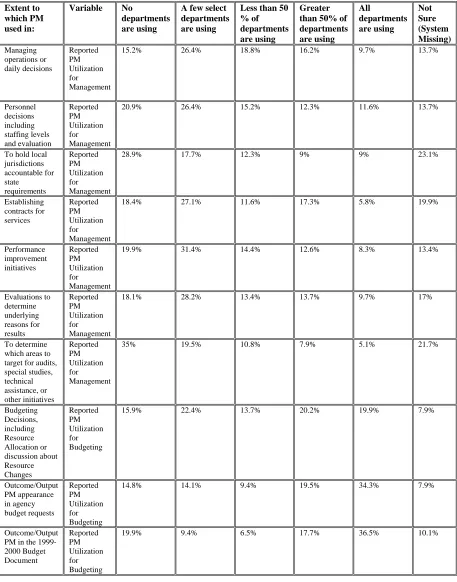
TABLE 4-1 REPORTING UTILIZATION OF PM OUTPUT OR OUTCOME PERFORMANCE MEASURES NUMBER OF RESPONDENTS=277... 98
TABLE 4-2 REPORTED UTILIZATION OF REWARDS AND SANCTIONS (NUMBER OF RESPONDENTS =277) ... 101
TABLE 4-3 REPORTED UTILIZATION OF INCENTIVES OR REWARDS USED BY AGENCIES (NUMBER OF RESPONDENTS =277) ... 102
TABLE 4-4 OBSERVED MEASUREMENT CAPACITY, TRAINING, AND LEADERSHIP... 104
TABLE 4-5 OBSERVED DATA QUALITY AND STAKEHOLDER INVOLVEMENT NUMBER OF RESPONDENTS = 277... 106
TABLE 4-6 PERCEIVED BENEFITS OF PM UTILIZATION... 111
TABLE 4-7 CRONBACH’S ALPHA: INTERNAL RELIABILITY... 117
TABLE 4-8 STATISTICAL MEASUREMENTS FOR CONTINUOUS VARIABLES... 118
TABLE 4-9 STATISTICAL MEASUREMENTS FOR DICHOTOMOUS VARIABLES... 119
TABLE 4-10 MISSING DATA... 120
INDEPENDENT VARIABLES... 124
TABLE 5-3 CORRELATION BETWEEN REPORTED PM UTILIZATION FOR REPORTING, BUDGETING, AND MANAGEMENT WITH DEPENDENT VARIABLES... 128
TABLE 5-4 CORRELATION BETWEEN REPORTED PM UTILIZATION FOR REPORTING, BUDGETING, AND MANAGEMENT WITH DEPENDENT VARIABLES... 128
TABLE 5-5 CONTROL VARIABLE CORRELATIONS WITH REPORTED PM UTILIZATION VARIABLES... 132
TABLE 5-6 CONTROL VARIABLE CORRELATIONS WITH INDEPENDENT VARIABLES (FACTORS THAT PROMOTE PM UTILIZATION) ... 133
TABLE 5-7 CONTROL VARIABLE CORRELATIONS WITH DEPENDENT VARIABLES (PERCEIVED BENEFITS OF PM) ... 133
TABLE 5-8 CITY/COUNTY MEAN COMPARISONS... 135
TABLE 5-9 STAFF MEAN COMPARISONS... 137
TABLE 5-10 EFFECTS OF MISSING DATA FOR CITY/COUNTY DIFFERENCES... 144
TABLE 5-11 EFFECTS OF MISSING DATA FOR POSITION... 145
TABLE 5-12 EFFECTS OF MISSING DATA FOR YEARS WORKING WITH THE GOVERNMENT.... 146
TABLE 5-13 EFFECTS OF MISSING DATA FOR YEARS WORKING WITH PERFORMANCE MEASUREMENT... 147
TABLE 5-14 EFFECTS OF MISSING DATA FOR REPORTED PM UTILIZATION IN MANAGEMENT ... 148
TABLE 5-15 EFFECTS OF MISSING DATA FOR REPORTED PM UTILIZATION IN BUDGETING... 149
TABLE 5-16 EFFECTS OF MISSING DATA FOR REPORTED PM UTILIZATION IN REPORTING... 150
TABLE 6-1 MEASUREMENT MODEL FOR REVISED KONG-ROGERS MODEL... 171
TABLE 6-2 MANAGEMENT MODEL MODIFICATIONS FOR KONG MODEL... 174
TABLE 6-3 BUDGETING MODEL MODIFICATIONS FOR KONG MODEL... 174
TABLE 6-4 REPORTING MODEL MODIFICATIONS FOR KONG MODEL... 175
TABLE 6-5 GOODNESS OF FIT MEASURES FOR KONG MODEL... 176
TABLE 6-6 SQUARED MULTIPLE CORRELATIONS FOR KONG MODEL... 178
TABLE 6-7 PATH COEFFICIENTS FOR KONG MODEL... 179
TABLE 6-8 COMPARING THE DIRECT RELATIONSHIPS WITH PM UTILIZATION IN MANAGEMENT, BUDGETING AND REPORTING... 181
TABLE 7-1 WANG MEASUREMENT MODEL... 195
TABLE 7-2 MANAGEMENT MODIFICATIONS FOR WANG MODEL... 197
TABLE 7-3 BUDGETING MODIFICATIONS FOR WANG MODEL... 197
TABLE 7-4 REPORTING MODIFICATIONS FOR WANG MODEL... 198
TABLE 7-5 GOODNESS OF FIT MEASURES FOR WANG MODEL... 199
TABLE 7-6 SQUARED MULTIPLE CORRELATIONS FOR WANG MODEL... 200
TABLE 7-7 PATH COEFFICIENTS FOR WANG MODEL... 201
TABLE 7-8 AMMONS-RIVENBARK MEASUREMENT MODEL... 211
TABLE 7-9 COMPREHENSIVE MANAGEMENT MODIFICATIONS FOR AMMONS-RIVENBARK MODEL... 213
TABLE 7-10 BUDGET REPORTING MODIFICATIONS FOR AMMONS-RIVENBARK MODEL... 214
TABLE 7-11 REPORTING MODIFICATIONS... 214
TABLE 7-12 GOODNESS OF FIT MEASURES FOR AMMONS-RIVENBARK MODEL... 216
TABLE 7-14 PATH COEFFICIENTS FOR AMMONS-RIVENBARK MODEL... 218
TABLE 8-1 KONG FINDINGS PERTAINING TO ORGANIZATIONAL FACTORS... 226
TABLE 8-2 KONG-ROGERS FINDINGS PERTAINING TO ORGANIZATIONAL FACTORS... 226
TABLE 8-3 KONG’S FINDINGS PERTAINING TO HUMAN FACTORS... 227
TABLE 8-4 KONG-ROGERS FINDINGS PERTAINING TO HUMAN FACTORS... 227
TABLE 8-5 BOTH MODEL’S FINDINGS PERTAINING TO MEASUREMENT FACTORS... 227
TABLE 8-6 COMPARING GOODNESS OF FIT BETWEEN KONG AND KONG-ROGERS MODEL.... 229
TABLE 8-7 COMPARING SQUARED MULTIPLE CORRELATIONS FOR KONG AND KONG-ROGERS ... 230
TABLE 8-8 COMPARING BENEFITS CONSTRUCTS FOR PM UTILIZATION... 232
TABLE 8-9 COMPARING CONSTRUCTS FOR PERCEIVED BENEFITS FROM PM ... 233
TABLE 8-10 COMPARING BENEFIT FINDINGS FROM WANG AND AMMONS-RIVENBARK MODEL ... 234
TABLE 8-11 COMPARING GOODNESS OF FIT FOR WANG AND AMMONS-RIVENBARK MODELS ... 235
LIST OF FIGURES
FIGURE 4-1 MEAN RESPONSES FOR REPORTED PM UTILIZATION IN MANAGEMENT... 99
FIGURE 4-2 MEAN RESPONSES FOR REPORTED PM UTILIZATION IN BUDGETING... 100
FIGURE 4-3 MEAN RESPONSES FOR REPORTED PM UTILIZATION IN REPORTING... 100
FIGURE 4-4 OBSERVED ORGANIZATIONAL CULTURE – “MANAGING FOR RESULTS”PROCESSES USED (NUMBER OF RESPONDENTS = 277) ... 107
FIGURE 4-5 EFFECTIVENESS OF PM IN PRODUCING PERCEIVED BENEFITS... 113
FIGURE 4-6FORM OF GOVERNMENT (NUMBER OF RESPONDENTS = 277)... 114
FIGURE 4-7 RESPONDENT’S POSITION (NUMBER = 267) ... 115
FIGURE 4-8 RESPONDENT TENURE AND EXPERIENCE (TENURE = 267; REPORTING EXPERIENCE = 255 REPORTING TENURE)... 116
FIGURE 6-1 KONG’S 1998 PERFORMANCE UTILIZATION MODEL... 156
FIGURE 6-2 LOCAL GOVERNMENT PERFORMANCE UTILIZATION MODEL (REVISED KONG -ROGERS) ... 167
FIGURE 6-3 REVISED KONG-ROGERS MODEL: LOCAL GOVERNMENT MANAGEMENT MODEL ... 168
FIGURE 6-4 REVISED KONG-ROGERS MODEL: LOCAL GOVERNMENT BUDGETING MODEL. 169 FIGURE 6-5 MEASUREMENT MODEL FOR REVISED KONG-ROGERS MODEL REPORTING MODEL ... 170
FIGURE 7-1 WANG’S 2002 PM IMPACT MODEL... 185
FIGURE 7-2 REVISED WANG LOCAL GOVERNMENT PM UTILIZATION BENEFITS MODEL... 191
FIGURE 7-3 REVISED WANG MODEL: LOCAL GOVERNMENT MODEL OF PERCEIVED BENEFITS PROVIDED BY REPORTED PM UTILIZATION IN MANAGEMENT... 192
FIGURE 7-4 REVISED WANG MODEL: LOCAL GOVERNMENT MODEL OF PERCEIVED BENEFITS PROVIDED BY REPORTED PM UTILIZATION IN BUDGETING... 193
FIGURE 7-5 REVISED WANG MODEL: LOCAL GOVERNMENT MODEL OF PERCEIVED BENEFITS PROVIDED BY REPORTED PM UTILIZATION IN REPORTING... 194
FIGURE 7-6 AMMONS-RIVENBARK COMPREHENSIVE PM UTILIZATION MODEL... 203
FIGURE 7-7 GASB LOCAL GOVERNMENT REPORTING MODEL... 207
FIGURE 7-8 PM UTILIZATION IN AMMONS-RIVENBARK COMPREHENSIVE MANAGEMENT SYSTEM... 208
FIGURE 7-9 PM UTILIZATION IN AMMONS-RIVENBARK BUDGET REPORTING MODEL... 209
FIGURE 7-10 PM UTILIZATION IN AMMONS-RIVENBARK SEA REPORTING MODEL... 210
FIGURE 8-1 KONG MODEL ASSUMPTIONS... 224
FIGURE 8-2 KONG-ROGERS MODEL ASSUMPTIONS... 224
FIGURE 9-1CORRELATION BETWEEN REPORTED PM UTILIZATION IN MANAGEMENT AND PROMOTING FACTORS OF PM UTILIZATION... 240
FIGURE 9-2 CORRELATION BETWEEN REPORTED PM UTILIZATION IN BUDGETING AND PROMOTING FACTORS OF PM UTILIZATION... 240
FIGURE 9-3 CORRELATION BETWEEN PM UTILIZATION IN REPORTING AND PROMOTING FACTORS OF PM UTILIZATION... 241
FIGURE 9-5 PATH COEFFICIENTS FOR KONG’S INTERNAL DETERMINANT MODEL: PM
UTILIZATION IN BUDGETING... 243 FIGURE 9-6 PATH COEFFICIENTS FOR KONG’S INTERNAL DETERMINANT MODEL: PM
UTILIZATION IN REPORTING... 243 FIGURE 9-7 CORRELATION BETWEEN REPORTED PM UTILIZATION IN MANAGEMENT AND
PERCEIVED BENEFITS... 246 FIGURE 9-8 CORRELATION BETWEEN REPORTED PM UTILIZATION IN BUDGETING AND
PERCEIVED BENEFITS... 246 FIGURE 9-9 CORRELATION BETWEEN REPORTED PM UTILIZATION IN REPORTING AND
PERCEIVED BENEFITS... 246 FIGURE 9-10 PATH COEFFICIENTS FOR WANG’S BENEFIT MODEL... 247 FIGURE 9-11 PATH COEFFICIENTS FOR AMMONS-RIVENBARK COMPREHENSIVE UTILIZATION
CHAPTER 1: INTRODUCTION TO THE STUDY
The performance measurement (PM) revolution has been growing robustly for about
twelve years (Frank and D’Souza, 2003). Performance measurement in and of itself does not
have value; rather, it must be part of some overall management strategy to foster
improvement (Behn, 2003). Swiss and Strauss (2005: 36) conclude:
“Performance measurement must lead to performance management, with changes in organizational behavior and decisions that in turn lead to demonstrably better
outcomes for program clients.”
Wang (2002 a) suggests that there are three ways that PM utilization promotes
performance in government agencies:
• Internal Management - Public managers and front line employees use
performance measurement data to strategically plan and evaluate information pertaining to goals and expectations in their roles as managers and service providers for the public organization.
• Budgeting - Policy makers use performance budgeting data to improve the quality of policy, resource allocation, and service prioritization decisions.
• Reporting - Citizens and others use service efforts and accomplishment reports prepared by public managers to actively participate in meaningful decision-making in their roles as “owners” of the public organization.
The chapter begins with a short history of PM, followed by a discussion of how this
research adds to the body of knowledge about performance measurement utilization. Finally,
HISTORY OF PERFORMANCE MEASUREMENT
This section discusses the importance of performance measurement utilization in
various management, budgeting, and reporting reforms that have occurred in the United
States.
Scientific Management
Arguably, the history of performance measurement began with the work of Frederick
Taylor. Traditional bureaucracy focused on rules and regulations that specified the process
whereby service was delivered to the citizens. Taylor stressed the “one best way” and
encouraged both the private and public sector to measure job processes in order to improve
productivity. Traditional bureaucracy uses input and process indicators in PM, which critics
say can lead to a bureaucratic pathology overly obsessed with process, rather than focusing
on substantive results.
Performance measurement literature officially began in 1910 according to Ridley
(1927). In 1912 the Taft Commission on Economy and Efficiency proposed management
reforms in the federal government including stronger emphasis on measurement of efficiency
(Moon and deLeon, 2001). The International City/County Management Association
(ICMA) issued Measuring Municipal Activities in 1938. This document recommended
various types of information that local governments collect to find out how well services
were being delivered (Fischer 1994; Ammons, 1995).
Program Budgeting
The Brownlow Report suggested program budgeting in 1937 as a system of linking
Act (1950) specified a performance budget format requiring budgets prepared in a functional
or project/activity design (Melkers and Willoughby, 2001). This led to the
Planning-Programming-Budgeting Systems (PPBS) in the 1960s to Management By Objectives
(MBO) to Zero Based Budgeting (ZBB) and finally to Performance Based Budgeting (PBB).
President Johnson put PPBS into operation in 1965 to integrate planning and budgeting.
Nixon recommended MBO in the 1970’s to improve performance (Kelly and Rivenbark,
2003 a.). Local governments soon followed the federal government lead in becoming
interested in MBO. A cross-sectional study of 15 cities found four out of 15 had adopted
MBO presentation in budgets in the decade from 1977 to 1987 (Rubin, 1990). President
Carter implemented ZBB in the late 1970’s (Kelly and Rivenbark, 2003 a). ZBB forced
agencies to start with zero each year and justify all expenditures.
Finally, PBB began in the 1990’s as an alternative to traditional budgets that emphasized
the base and an allocation based on fair share. PBB proponents argue that emphasizing
performance measures that gauge efficiency and service levels rather than just emphasizing
inputs improve the budgetary process. Detractors point to the fact that rational reform of the
budgeting process has not worked out in the past. They say PBB is grounded in the neutrally
political, mechanical perspective much like PPBS and ZBB that failed and were phased out
(Harris, 1995). Willoughby and Melkers (2000) found that performance budgeting provides
more informed decision-making and better communication but did not find conclusive
evidence that it changes resource allocation decisions.
Kingdon’s garbage can theory or Rubin’s real-time budgeting theory, which posit that
useful in explaining the resource allocation processes than performance measurement
(Kingdon, 2003; Rubin, 1990). Kelly (2002) likewise asserts that budget decisions are not
usually made using rational cost analysis that links expenditures with outcomes.
Nonetheless, Kelly optimistically maintains that just as other rational reforms have brought
lasting change to the budget process, so will PBB. For example, ZBB brought the practice
of multiple budgets that are used somewhat today. Further, most PBB critics agree that
performance measurement information in the budget document offers broadened
accountability through its emphasis on results and outcomes.
Total Quality Management (TQM)
Like Taylorism, the more recent management reform, Total Quality Management focused
mostly on process measurement. W. Edwards Deming started the quality revolution in
Japan in the 1950s (Fischer, 1994). His disciples, Joseph Juran and Philip Crosby were more
influential in the United States private sector. TQM was thus not widely adopted by the U.S.
public sector until the 1980’s after the federal government founded the Federal Quality
Institute in 1988 to promote quality initiatives. In 1987, Congress enacted the enabling
legislation for the Baldridge Quality Award and charged the National Institute of Standards
and Technology with implementing the award (Bowman, 1994).
TQM emphasizes process measures more than outcome measures. There are five basic
TQM principles (Berman and West, 1995:58):
1. “A commitment to customer-driven quality 2. Employee participation in quality improvement
3. A bias toward taking actions based on facts, data, and analysis 4. Commitment to continuous improvement
In the TQM model, the primary decision-makers are the manager and employee who seek
service quality and customer satisfaction. In this pursuit, TQM often uses customer service
surveys. To ensure service quality, employees must be able to distinguish between routine
variation and real and systemic change. TQM assumes that employees want to contribute,
are basically good, and want to experience meaning in their work (Connor, 1997:503).
People feel helpful when they make contribution to the organization and respond positively
to a culture of trust. Human contributions are maximized through team efforts, which are
essential in TQM.
Swiss (1992) argued that orthodox TQM as promulgated by Deming is unsuited for most
government agencies because it pays too much attention to process and not enough to
outcomes. Further, even Crosby’s system of TQM is not suitable for government, because it
concentrates on zero defects and does not recognize that output uniformity is hard to achieve
in providing governmental services. A strong continuous improvement culture is hard to
realize in governments because political cultures emphasize the short-term and are subject to
constant shifts in policy direction. Nonetheless, Swiss thought some aspects of TQM are
applicable to government, such as employee empowerment, continuous improvement, and
quantitative tracking of product quality, and client reactions. Moreover, the Baldridge
criteria of leadership, strategic planning, customer value and market forces, information and
analysis, human resource focus, process management, and business results are applicable to
many government agencies.
New Public Management (NPM)
government less “wasteful” and advocated that private sector solutions were superior to
public sector solutions (Kelly and Rivenbark, 2003 a). The private sector emphasis (NPM)
replaced bureaucratic rules with customer choice. NPM uses markets and competition as
incentives. An emphasis on market efficiency includes pay-for-performance, performance
measurement, participatory decision-making processes, and flexible organizational culture.
NPM uses private or non-profit organizations to deliver services, separates policy and
administration, and promotes multi-source suppliers of service, contracting, output measures,
and control. A fundamental belief of NPM is that market incentives result in efficiency
(lower cost) and effectiveness (meeting customer needs). Because of its emphasis on
competition and providing customer choices, NPM uses comparative performance measures
such as benchmarks and report cards.
Critics of the NPM aver that NPM does not work well in government. Many use
Hirshman’s (1970) political and economic model of the self-correcting organization to
explain why. Hirschman stated that customers can withdraw or exit the organization or they
can stay and help to improve performance, but they must receive accurate information about
the organization to aid the process. For example, if school vouchers are used, the parents
who are most equipped with information and the skills to make the process better are the
ones who will leave the organization if given the opportunity. This leaves lower class
children with more problems and makes the performance of the school deteriorate even more
(Hirschman, 1970).
Roberts (1997) pointed out problems with the implementation of NPM in Britain,
departmental headquarters to loosen control over agencies. Central business units were not
willing to give operating divisions flexibility over pay and working conditions. Parliament
also feared giving agencies discretion. Funding for productivity enhancements was erratic
and unstable. Constitutional issues arose over the use of contractual employees. Bonuses for
management attracted negative legislative attention. Legislators thought agencies
misrepresented actual performance to get bonuses. Also, attempts to broaden managerial
discretion weakened commitments to constituents such as organized labor, women, racial
minorities, and small businesses.
These situations describe the power inequalities problem discussed by Moe (2005). He
argued that although principal-agent relationships should result in collaboration and mutual
benefit, they often degenerate into making the individuals worse off because “insiders” use
cooperation to exercise power over others. Moynihan (2006) gives further examples of the
difficulty in power sharing. In his study of managing for results utilization in the 50 states,
he found state governments have emphasized strategic planning and performance
measurement but failed to enhance managerial accountability. State managers were not
given authority to make real changes and financial, purchasing, and human resource control
systems were not changed.
NPM uses benchmarking as a tool to encourage competition and adoption of best
practices. Three of the better-known benchmarking projects include the Innovations Group,
the ICMA, and the North Carolina Institute of Government(IOG) benchmarking project.
The Innovations Group created a national performance center for U.S. local governments
data. If a jurisdiction wanted to benchmark a particular area, it could contact the agency and
obtain information. Jurisdictions paid to participate in this self-serve type project. The
quality of the data depended on the level of effort of the participants (Ammons, Coe, and
Lombardo, 2001).
The ICMA Center for Performance Measurement Benchmarking project began in 1984.
Its participants included 44 cities and counties with populations above 200,000. Currently,
there are over 100 participants. Initially, it examined four core services: police, fire,
neighborhood, and support services. At first a policy committee was composed of the top
administrators of the counties or cities. Later, this was replaced by a 10-member steering
committee from the technical areas being studied. Each area had a technical advisory
committee. The ICMA staff and project participants collect useful and relevant performance
information that is uniform and comparable (Ammons, Coe, Lombardo, 2001; Poister and
Streib, 1999 a; ICMA Website).
The North Carolina IOG benchmarking project also began in 1994. Unlike other
benchmarking projects, the IOG project pays close attention to cost accounting. Since the
model uses a full cost model, cost comparisons can be made among local governments and
private contractors. The IOG project provides efficiency, effectiveness, and explanatory
measures for the 15 cities that continue to participate in this project.
Results Based Management (RBM)
Results based management, a hybrid of TQM and NPM, began in the mid 1990s. RBM,
Rather, RBM replaces the rules of traditional bureaucracy with outcomes. Moreover, RBM
uses a control orientation based on principal agent theory or it can be adapted to TQM’s
emphasis on continuous monitoring. RBM is useful at any level of the organization – the
governing body, chief executive, or department heads. RBM is particularly valuable when
applied to areas like welfare programs that involve broad partnerships between the federal,
state, local governments and the private and nonprofit sectors.
Swiss (2000:2) gives five principles of results based management, which are useful to
decentralize functional structures and make process improvements.
1. Measurable results instead of procedures and processes
2. Long term strategic planning and shorter annual plans and goals 3. Empowerment of workers
4. Business process reengineering and use of teams
5. Incentives such as budget and personnel rewards and external market incentives
Reporting
In 1907 the New York Bureau of Municipal Research included accounting and
management data in the New York City budget. Later in the century, reporting non-financial
data drew the interest of many professional organizations, which began to recognize the need
for PM in governments. In the 1970’s, the American Institute of Certified Public
Accountants (AICPA), the Government Accounting Office (GAO), the Financial Accounting
Standards Board (FASB), and the National Council on Governmental Accounting (NCGA)
recognized the need for non-financial performance information for government and
nonprofits (GASB 2003 report).
The Financial Accounting Foundation established the Government Accounting
local government accounting. Immediately after being formed, GASB called for PM
experimentation with Service Efforts and Accomplishment (SEA) reporting (Brown and
Pyers, 1998). Through thiseffort, GASB seeks to address the concern that traditional
financial reports do not provide enough information on the bottom-line of government
success or failure. The GASB defines service efforts and accomplishments to mean
performance measures of efficiency and effectiveness. Although the GASB addresses
internal uses of data, the main emphasis is on external users such as the public and bond
rating agencies. The purpose of SEA reports is “to communicate relevant, reliable
information about the performance of government programs and services to elected officials,
citizens, and other users.” (GASB 2003 report: 1). So far, the GASB has only made
suggestions, but it has the power as a standards setting board to mandate a form of SEA
reporting for local and state governments.
In addition to the primary users identified by the other models, SEA reporting
provides PM information for monitoring by citizens in their role as government owners. One
tool used by SEA reporting proponents to ensure efficient ownership is the citizen
committee. An example of citizen committees initiating PM is the Citizen Initiated
Performance Assessment (CIPA) in Iowa municipalities (Ho and Coates, 2005). This project
uses a citizen performance team composed of city council members, city administrators, and
citizen representatives to develop performance measures for specific services. These citizen
representatives are also involved in data collection and evaluation.
A potential limitation of citizen participation in performance measurement is that
individuals who are not direct clients are not advantageous (NCPP Website). GASB
participant focus groups pointed out the difficulty of engaging citizens beyond the “axe
grinders.” Generally, except for school performance, GASB research has not found
widespread use of PM by citizens and media. The GASB also finds it problematic that easy
to read performance measurement reports are not readily available. For the most part,
citizens who care about the details of government performance measures may be in the
minority. The media is not interested in writing general reports on government performance.
They are more interested in incidents of misdeeds (GASB 2003 report).
HOW THE CURRENT RESEARCH ADDS TO THE BODY OF KNOWLEDGE
The foregoing discussion illustrates how important PM has been in management
systems of all kinds. Thus, considerable research has focused on it, but most research has
been normative or descriptive. The principal research question concerns stakeholders’ use of
performance measurement information. Does how they use performance measurement
require different states of PM readiness and will different uses bring varying benefits?
Some empirical research has examined bivariate relationships; fewer still have developed
multivariate models to explain the factors that promote performance measurement utilization.
Even fewer have developed multivariate models to explain the benefits of performance
measurement utilization. The most relevant multivariate models include the following:
• Kong (1998) explained the factors that promote PM utilization in the federal government, including organizational culture, goal clarity, training, involvement of stakeholders, leadership, measurement capacity, and data quality.
• Wang (2002 a) described the difference in immediate and long-term benefits from using PM in local governments. The immediate benefits included improved communication, decision-making, and coordination. The long-term benefits were improved efficiency, effectiveness, and accountability.
community characteristics, respondent characteristics, organizational culture, and performance measurement characteristics.
• Ammons and Rivenbark (2005) hypothesized that using performance measurement in key management systems including strategic planning and comparative benchmarking with high quality data (particularly efficiency measures) would produce greater service improvements than using it in reporting systems alone.
This dissertation will advance the research begun by Kong, Wang, Melkers and
Willoughby, and Ammons and Rivenbark. Kong (1998) used path analysis to explain
differences in direct impacts of PM utilization as well as indirect effects of intervening
variables. Melkers and Willoughby (2005) and Wang (2002 a) used multiple regression to
explain differences in a single dependent variable. Rivenbark and Ammons (2005) used a
case study of 15 local government participants in the North Carolina IOG project.
This study advances their research by using structural equation modeling (SEM). This
methodology is considered state of the art technology for testing and developing models. In
addition to examining the effects of intervening variables, SEM can also model the effects of
interactions, non-linearities, correlated independents, measurement error, and correlated error
terms (Byrne, 2001, 3-4).
PREVIEW OF UPCOMING CHAPTERS
Chapter 2 discusses pertinent literature regarding the factors that promote PM
utilization, the perceived benefits from PM utilization, and the control factors such as type of
government (city versus county), respondent position, and the tenure and experience of the
respondents in working with PM utilization that affect utilization and benefits. The chapter
concludes with the hypotheses to be examined in this research. Chapter 3 presents the
methodology and the threats to internal and external validity. This chapter discusses how the
discussed and linked to the various variables.
Chapter 4 discusses the descriptive variable statistics with the data analysis
methodology, and the cleaning methods employed. Chapter 5 tests the bivariate relationships
identified in the hypotheses using Pearsonian correlation. The data limitations as well as the
theoretical relevance of the relationships are discussed.
Chapter 6 tests the multivariate relationships identified in the hypotheses using
structural equation modeling. Specifically, it tests Kong’s internal determinant model of
factors promoting performance utilization in management, budgeting, and reporting. Chapter
7 analyzes the benefits provided by PM utilization in PM utilization in management,
budgeting, and reporting. Particularly, it tests Wang’s model of immediate and long-term
impacts. It also tests the comprehensive utilization model proposed by Ammons-Rivenbark.
Chapter 8 presents a comparative analysis of the four models examined in this research. This
includes the Kong model, the Kong-Rogers model that was developed after factor analysis
and model-building. It also compares the Wang model and the Ammons-Rivenbark model.
Finally, Chapter 9 summarizes the findings and presents practical applications and
implications of the findings for PM utilization in management, budgeting, and reporting. The
CHAPTER 2 LITERATURE REVIEW
This chapter discusses the factors that promote PM utilization, the perceived benefits
from PM utilization, multivariate models that have been developed to explain utilization and
benefits from using PM, and control variables such as form of government and respondent
demographics, and position held in the respective government. Finally, this chapter lists the
hypotheses derived from the literature review and lists the expectations of the present study.
Kong (1998) identified organizational factors (organizational culture and goal
clarity), human factors (training, involvement of stakeholders, and leadership), and
measurement factors (measurement capacity and data quality) as variables that promote PM
utilization in the federal government. A literature review has confirmed these factors as the
ones to be tested by this research.
ORGANIZATIONAL FACTORS
Perhaps the most important promoting factor for PM utilization is the adoption of a
“results-based” culture or climate. This promotes the use of performance measures through a
focus on the “overall mission” of the organization. A “results-based” organization
communicates goals and objectives to its employees, give them the authority to achieve
established goals, recognizes when objectives are achieved, and holds the employees
accountable if goals are not achieved. Incentives and rewards help to reinforce the clarity of
goals. In a situation where workers do not clearly know what their goals are, performance
measurement is not a useful tool. When there are clear “consequences” such as rewards and
sanctions, then performance measurement is more important and utilization is clearly
Organizational Culture
A cornerstone of an organization is its culture, which includes the values, beliefs, and
shared understandings of the members of the organization. Effective organizations actively
manage culture. They recognize it as the cement that holds the organization together.
Culture components can include motivation, goals, job design, support, internal customer
supply chain, work group leadership, communication, empowerment, performance, morale,
and readiness (Hennessey, 1998:526).
Hendrick (2000:316) embraced the normative values of “open, flexible, tolerant, and
forgiving cultures.” She felt permissive cultures are necessary to allow organization learning
to occur as individuals explore options and learn and make mistakes. Organizations need to
share information beyond their defined boundaries with stakeholders and others. They need
to elicit broader participation in key decisions (Broom, 1995). Hellein and Bowman
(2002:77) determined that, for TQM to be implemented successfully, a required requisite
was an organizational culture conducive to “cooperation, empowerment, and trust.” Klay
(2003) also argued performance improvement is more likely where the development of
learning organizations is encouraged. Kravchuk and Schack (1996) stressed
performance-monitoring systems as a mechanism for enhancing organizational learning. PM systems help
organize and understand processes and outcomes, thereby improving program effectiveness.
Katzenbach and Smith (1993) in The Wisdom of Teams stressed the importance of
organizational learning through teams. They believed that teams promote performance and
support learning and behavioral changes in organizations. Teams are expected to help
coordination across organizations. Organizations with a TQM orientation are more likely to
use teams. Results based management also emphasizes use of teams.
Evidence Pertaining to Organizational Culture
Kong (1998: 65) used a construct of authority, accountability, recognition, and feedback
to operationalize organizational culture. Kong employed “authority” to refer to whether
agency managers or supervisors have the decision-making authority they need to help the
agency accomplish its strategic goals. Accountability entails whether the agency managers
or supervisors are held accountable for the programs, operations, or projects they are
responsible for. Recognition is related to whether employees in those agencies receive
positive recognition for helping the agency accomplish its goals. Communication refers to
whether the individual to whom the respondent reports periodically reviews the results or
outcomes of the program, operations or projects that he or she is responsible for.
Kong found that organizational culture as defined above was a significant factor in
utilization of PM. Likewise, Wang and Berman (2001) found that mission driven
governments had a positive association with PM utilization of outputs and outcomes. Mission
driven governments were more likely to use outcome performance measurements that
focused on results to be achieved rather than merely measuring production of outputs.
Expectations for Current Research Concerning Organizational Culture
Based on Kong, afavorable observed organizational culture will be positively
correlated with the local government’s reported PM utilization.
Goal Clarity
how to provide services, the professional orientation of government workers, or the complex
policy environment in which the government official has to operate.
In using PM, Swiss (2000) points to the benefit of having a clear conversion process with
plainly established goals. A clear knowledge of how to convert inputs to outputs is
necessary to tightly link PM to incentives but it is often difficult in government settings.
Some performance measurements offer perverse incentives. For example, successful closing
of criminal cases could lead to too many plea bargains by district attorneys (Kelly and
Rivenbark, 2003 a). Perrin (1998) posits that PM is more appropriate for simple and directly
delivered services than other types. For instance, prevention of crimes, fires, and child abuse
is very difficult to measure, while garbage pick-up is easier.
Professionalism often leads to fragmented goal clarity among government workers.
Lipsky (1980) discusses the professional orientation of “street bureaucrats.” According to
this author, most “street bureaucrats” have freedom from supervisory control and
administrative discretion to develop their own goals. Clients and others defer to the
professionalism and discretion of public administrators since they have little knowledge of
performance measures. Lipsky discusses the difficulty of performance measures because of
goal conflict in street-level bureaucracies. This comes about because of the worker’s
concern for the client conflicts with the general social role of the agency. There are also
conflicting goal expectations from peers, reference groups, community activists, and clients.
Finally, the ability of the street level bureaucrat to treat people is at odds with the need for
the organization to process cases efficiently. This can lead to goal displacement.
governmental settings. Meyers, Riccucci, and Lurie (2001) studied goal congruence in
governmental organizations delivering welfare reform at the local levels in three states. They
found that goal congruence among the participants was particularly problematic when policy
goals or organizational systems were complex.
To overcome the difficulty of unclear processes, professionalism, and complex policy
environments, incentives and sanctions are often employed. Incentives (rewards) and
sanctions have been touted as one way to ensure that jurisdictions align individual
performance with organizational goals and objectives (Straight, 2000). This has been called
the “consequences” strategy to reward successes and discipline failure to achieve goals
(Rivenbark and Ammons, 2005).
However, in reality, these schemes are often not deployed or are limited (Van
Landingham, Wellman, and Andrews, 2005; Andrews and Hill, 2003). Daley (1995)
discussed the difficulty of pay-for-performance in the federal government, which was viewed
as ineffective by civil servants because of the non-availability of merit pools to deliver
increases in pay. Also, employees distrusted performance appraisal as an ineffective tool to
link performance and rewards.
Evidence Pertaining to Organizational Goal Clarity
De Lancer Julnes and Holzer (2001) ascertained that goal clarity or orientation was an
important factor in the adoption of PM but not in the implementation of PM. They found that
adoption of PM was significantly and positively affected by goal orientation defined as
consensus on program goals.
was significantly negatively related to managerial effectiveness. Evaluative goal ambiguity
refers the extent to which organizations express their targets in an objective and measurable
manner that does not allow deviance or interpretation from employees. This would support
the hypothesis that organizations would not use PM if managers were not able to clearly
understand and quantify their goals.
Kong (1998: 65) used goal clarity as a composite exogenous variable in his
dissertation. His variable is composed of “the extent to which the respondent’s agency has
communicated its organizational mission to its managers in a clear and understandable way,
defined its strategic goals, communicated to its managers how their everyday job
responsibilities relate to the attainment of the agency’s strategic goals, and communicated the
link between the achievement of agency strategic goals and the performance of agency
programs, operations, and projects. Agency mission is defined as explaining why the
government component where the manager works exists, telling what it does, and describing
how it does it. Agency strategic goals are defined as “long-term” goals that explain the
purposes of the agency’s programs and the results they are intended to achieve.” Kong
found that goal clarity had a positive and significant relationship with both budget and
management utilization of PM.
Expectations for Current Research Concerning Goal Clarity
Based on Kong’s findings,reported goal clarity (incentives and sanctions) will be
positively correlated with reported PM utilization.
HUMAN FACTORS
involvement of stakeholders, and leadership. Training is a necessary component when
organizations adopt PM utilization. Performance measurement requires development of
human capital in both the “hard” measurement skills of developing, collecting, and analyzing
data and in the “soft” skills of consensus, facilitation, and working in teams. If ample
training is providing, local government employees will be more likely to use PM.
Active involvement of participants in the PM process is another essential component.
Participation helps generates understanding and a tolerance of performance measurement,
thus ensuring continuing utilization. Some of the more important stakeholders are the
central budget office and citizens and elected officials of the jurisdiction. Involvement of a
central budget office is very important in promoting PM. A budget office that has a passion
and a proclivity for performance measurement will through its involvement in evaluations,
reviews, and studies improve the measurement capacity. This will lead to higher quality data
and enhance both managerial and policy making utilization of PM. Citizens and elected
officials can also act as a promoter of PM if they demand improved data. Many groups are
interested in more citizen involvement. Citizens can act as a pressure group, which demands
PM data at websites and through SEA type reports.
There are many examples of the importance of leadership in using performance
measurements at the federal, state, and local levels. This applies to both political, top
management, and departmental leadership. If the leaders are committed to PM and stress its
importance, using it in their decision-making processes, then it is more likely to be used
Training
Poister and Harris (2000) argued that organizations embracing TQM must have a
“long-term” commitment to training that requires a substantial part of the employee’s time.
They also pointed out the need for group process skills such as consensus tools, facilitation
skills, and team-building approaches. Although entities can rely on consultants to help with
implementation, operational training from internal staff is necessary for ongoing success of
PM (Kelly and Rivenbark, 2003 a). For instance, the Balanced Scorecard system requires
considerable training and education to implement (Kaplan and Norton, 1992). Participation
in professional organizations such as ICMA, state budget associations, and the American
Society for Public Administrators (ASPA) is also important in implementing performance
measurement (Kelly and Rivenbark, 2003 a).
Evidence Pertaining to Training
Kong (1998:66) asked to what extent the agency provides respondents training to
accomplish the following tasks: conducting strategic planning, setting performance goals,
developing program performance measures, using performance measurement information to
make decisions, and linking performance of programs to the achievement of agency strategic
goals. Kong found a significant and positive relationship between training and PM
utilization for both management and budgeting.
Expectations for Current Research Concerning Training
Based on Kong’s findings observed training will be positively correlated with the
Stakeholder Involvement
Active involvement of stakeholders is a promoting factor for PM utilization. Behn
(2002) believed that active participation is necessary to get over the natural barriers in
implementing PM:
• Citizens emphasize personal results rather than what is important for society.
• Legislators place more emphasis on the immediacy of inputs rather than “long-term” impacts. Chief executives follow suit as they try to please their bosses.
• Public employees try to avoid mistakes that will certainly get them fired rather than produce successes that earn tiny amounts of praise.
• Creating better policies is more exciting than trying to achieve results with current policies.
• Administrators try to change policy, rather than focusing on the everyday, boring attention to detail that is necessary to make slow but steady progress toward improvement.
Behn contrasted the implementation of the federal performance program, Government
Performance and Results Act (GPRA) and Comstat, finding that Comstat displayed more
participation resulting in better performance. Swope (1999) also emphasized the
participatory style of Comstat. Using geographic information systems (GIS) and database
technology, commanders are held responsible for outcomes of crime in their district. Maple
and Mitchell (2000) believed that using a combination of involvement and a strong focus on
performance measurement could reduce crime.
Cederblom (2002) in his study of the Washington State Patrol also credited frequent
face-to-face meetings with peers and higher managers as instrumental in instilling mid-manager
commitment to using performance measures in the human resources function. Swiss (2000)
also considered performance measures developed through face-to-face participation through
MBO to be more effective than passive continuous monitoring performance measurement
Evidence Pertaining to Stakeholder Involvement
Researchers have focused on several groups of stakeholders. Evidence shows there is
support for the hypothesis that involvement of elected officials, citizens, the central budget
office, and others promotes the utilization of performance measurement.
Involvement of Politicians: Research findings on political involvement are mixed.
Some researchers have found political involvement to be positively related to PM utilization,
while others have identified it as a negative barrier. Wang (2000) found that elected
officials did not initiate PM systems or provide sufficient funding for implementation. His
research showed that legislative involvement in PM at the county level is not as strong as at
municipal, state, and federal levels. In their case study of Florida PM utilization in
budgeting, Grizzle and Pettijohn (2002) criticized the Florida legislature as micromanagers
rather than leaders.
On the other hand, some researchers have found legislative involvement to be a
positive factor in the adoption of PM. Broom (1995) pointed out legislative involvement was
crucial in implementing results based management in the states of Texas, Oregon, Minnesota,
and Virginia. Moynihan and Ingraham (2003) found that governors in high performing states
exhibited positive leadership in regards to the “managing for results” process. Bernstein
(2000) found that support of senior elected officials was vital in five local governments he
studied. Berman and Wang (2000) determined that involvement of county elected officials
was an important variable in differentiating high users of PM from lower users. Legislative
involvement has also been important at the federal level. Senator Roth provided leadership
2003; Roth, 1992).
Involvement of Citizens: Wang (2000) found that citizen support was a factor in PM
utilization in counties. Berman and Wang (2000) also found that citizen advocates was an
important variable explaining differences between higher and lower PM users. Hill and
Andrews (2005) in their study of performance-based reform in Virginia found that citizen
involvement was one of the factors that made the state successful in continuing to use PM in
budgeting and management. Wang and Berman (2000) found a positive association between
external support including elected officials and citizens with both output and outcome
performance measures. Relationships between citizen involvement and use of outcome
performance measurement were stronger in their study of larger counties.
Involvement of Budget Staff: Hill and Andrews (2005) found that involvement of the
central budget staff was an important factor in making PM utilization part of the budget
“ritual” in the state of Virginia. These budget staff contributed to the use of PM utilization
by showing its value to the managers. They also acted as consultants to the agencies. This
helped to entrench the use of PM and ensure practical usage of the tools of performance
measurement. Wang and Berman (2001) also found a positive association with central
management involvement including the budget office and PM utilization of outputs and
outcomes. The stronger relationship was with use of performance measurement outputs.
Involvement of Employees: De Lancer Julnes (2001) in a case study of the Teen
Responsibility, Education, Achievement, Caring, and Hope (REACH) program in Illinois,
determined that a majority of the partakers agreed participation was an important factor in