Data
Farid Alborzi, Rada Chirkova, Jon Doyle, and Yahya Fathi Computer Science Department, North Carolina State University
North Carolina, USA
{falborz,rychirko,jon_doyle,fathi}@ncsu.edu
Abstract. The quality and character of organizational decisions de-pends both on the character of the data available to make these decisions and on the value of the data in the decision-making process. This study introduces and investigates Data Readiness Level (DRL) as a quantita-tive measure of the value of a piece of data at a given point in a processing flow. DRL is considered as a multidimensional measure that takes into account relevance, completeness, and utility of data in confronting tasks. This study provides a formalization of some simple DRL measures and illustrates how to use knowledge of rules and facts about a database and the world to identify transformations of the data that improve DRL.
Keywords: data readiness level, data quality measurement, data qual-ity improvement, knowledge base, relational database
1
Introduction
1.1 Motivation
for quantifying and improving the quality value of data. To address this problem, we introduce and investigatedata-readiness level (DRL),a quantitative measure of the quality value of a piece of data at a given point in a processing flow. As such, the DRL represents a paradigm shift from the qualitative aspect of tra-ditional exploratory data analysis towards a rigorous metrics-based assessment of the quality value of data in various states of readiness. Each decision making process is composed of a sequence of analytical tasks, and each task has some requirements on the quality value of the input data, with regard to returning acceptable-quality information or knowledge for the decision making. The DRL represents the value of a piece of data to an analyst, analytic, or other process, and is expected to change as that datum moves through, is interpreted by, or changed by that process. We consider DRL as a multidimensional measure based on one or more data quality dimensions and task characteristics. In “Toll Booth example”, DRL contributes to decision making process by measuring the quality value of DMV and CCCS data in terms of data quality dimensions. Moreover, the DRL value demonstrates the distance between the existing information of the provided data and required information for decision making. Consequently, based on the demonstrated distance, improving solutions are employed to in-crease the quality value.
In this paper, we consider DRL as a vector of data quality dimensions. Data quality is defined as “fitness for use” in [1] and a data quality dimension is defined as an aspect of data that can be measured to quantify the data quality [2]. Consequently, data quality is a task oriented concept measured by data quality dimensions. This study considers relevance and completeness dimensions as DRL components and tasks requirements. We define relevance dimension of a database for a specific task as the closeness of data content and the required attributes to address the task. This definition is in line with [17]. Furthermore, a certain level of data quality such as completeness is required for each attribute to support the managerial decision making. Completeness dimension is defined as availability of all relevant data to satisfy the user requirements in [4]. Consequently, in this study, we consider the completeness of an attribute for a specific task as the availability of all relevant data for the required attribute to address the task.
While dimensions have been extensively studied in the literature to quantify the data quality value of a database for a specific task and also data cleaning methods have been developed to improve the data quality value of a database,to the best of our knowledge no formalization has been developed for integrating the computation and improvement of the task-dependent data-quality value of a database considering multiple tasks. This study introduces the first approach to such a formalization, for measuring the DRL value that helps determining the quality-value of data, as well as for improving it.
day and their plate was registered in a specific state. Thus, the task requirements are existence of drivers name, date, and state attributes in the datasets and a certain level of completeness for each attribute. Moreover, existing datasets are different in satisfying the requirements. Although the existence of the required attributes in the datasets and the completeness of each attribute are critical to address the task, attributes might be different in their importance based on the level of their contribution to address the task and satisfy users demand.
This study uses relevance and completeness dimensions to define DRL for a relational database. The foundational fact concerning data readiness is that data-readiness assessments rely on knowledge extracted from the data and in turn constitute knowledge about the data. At the highest level of abstraction, two major goals can be considered for DRL:
1. Determine whether the data have information of sufficient quality with re-spect to the task.
2. If the answer is negative, identify ways to increase the information quality with respect to the task.
While defining DRL addresses the first goal, it does not provide solutions for the second goal. Identifying readiness-improving operations requires knowledge about the database itself, the task domain, and the task environment.
1.2 Contribution and Plan of the Paper
The main contribution of this study is an initial formalization of data readiness level, which includes the following elements.
– Section 3 defines a simple DRL measure for relational databases that com-bines measures of data completeness and relevance motivated by a simple analytical task.
– Section 4 illustrates how to quantify the effects of data-readying operators of familiar types, and how to integrate data-readiness evaluation with knowl-edge about the task domain and the database to improve DRL.
– Section 5 explains the concepts introduced in section 4 through employing a use case.
– Section 6 summarizes key points, presents conclusions, and highlights direc-tions for future work.
Section 2 first summarizes related work on quantification and improvement of data quality and the use of such measures in knowledge management.
2
Related Works
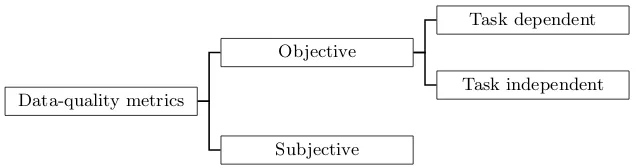
Data-quality metrics
Subjective Objective
Task independent Task dependent
Fig. 1.Data quality metric types
Related studies follow two main streams of measuring data quality: a) quality of conformance and b) quality of design ([13],[14]). Quality of conformance aims the correspondence between information system’s existing data values and its design specifications ([13]). Quality of design, however, checks the closeness of system’s specifications and customers’ requirements ([13]). Consequently, while quality of conformance is mostly objective, quality of design is a subjective concept. While subjective data quality assessment can be approached by distributing questionnaire among stakeholders ([15]), studies published on objective mea-surement investigate descriptive metrics. Objective assessments can be either task-dependent or task-independent ([15]). Task-independent assessments (or “impartial” as they are called in [16]) do not depend on the task and just give a general view of the data status. In contrast, task-dependent assessments (or “contextual” as they are called in [16]) are designed for a specific application. Figure 1 summarizes the above discussion.
The data quality metrics investigated in the literature either consider one specific task or no task to quantify the data quality. This study, however, provides a framework based on which metrics can be computed considering a collection of tasks imposed on a database.
Researchers have proposed principles and requirements to be enforced on the metrics. Even and Shankaranarayanan ([16]) proposed interpretation consis-tency, representation consisconsis-tency, aggregation consisconsis-tency, and impartial-contextual consistency as consistency rules to be followed by metrics. Moreover, Heinrich et al. ([3]) mentioned normalization, interval scale, interpretability, aggregation, adaptivity, and feasibility as six requirements on metrics. In this study, we con-sider two metrics: a) relevance, and b) completeness.
Completeness is defined as a measure of non-null values of an attribute ([7], [15]). We base the same definition for both formulating the completeness of a database and finding solutions to improve it. It is extensively accepted in the literature that existing null values in a database results a deterioration in the quality of the information and misleads the users ([23]). Thus, there have been both practical and theoretical approaches in database management systems liter-ature to handle problems originating from null values existence in a database. In 1970s, Codd ([24],[25]) investigated handling null values in commercial database management systems. [24] and [25] developed a three-valued logic to solve the problem of working with null values and the logic was reflected in SQL stan-dard. On one hand, the practical solutions such as the three-valued logic feature for SQL has been criticized in several studies ([26], [27]),on the other hand, the theoretical approaches have been so complicated hindering them to be used in applications ([28]). There are three main streams of studies in the literature of incomplete information([28]) developing approaches based on: a) representation systems and certain answers([29],[30]); b) logical theory ([31],[32]); and c) pro-gramming semantics ([33],[34]). While these studies use the structure contained in the relational databases to work with incomplete information and do not use any external knowledge to improve the completeness, this study develops a for-malization to improve completeness based on rules and facts contained in the database and/or provided by user.
Knowledge bases have been progressively used in academia and industry on a variety of applications ([35]). While [36] developed a platform employing user-imposed rules to repair data based on detecting the rules violations, the platform was not established on the quality value evaluation of a database con-fronting tasks. This study develops a framework measuring the task-dependent quality value of data to support exploiting a knowledge base. The contained knowledge aims to find quality improving solutions and is composed of the facts about the database structure in addition to rules about data quality dimensions improvement.
3
Formalizing DRL
This section provides a concrete definition of DRL for the data represented in a relational database and tasks consisting of simple SQL queries. We sketch extension of the formalism to other data representations and more complicated tasks in Section 6.
3.1 Example 1: Traffic Flow Identification
Table1from LPR Table2from DMV
row plate lane CL user time date
1 NMU45 3 1.00 ⊥ 09:20:16 07/04/2014 2 STA00 1 0.73 n1 09:20:03 07/04/2014 3 ABWD9 3 0.85 n2 09:19:53 07/04/2014 4 TRC19 4 1.00 n3 09:19:52 07/04/2014
LN name plater state
11156 n2 ABWD9 VA 78922 n1 STA00 VA 58556 w1 NMU45 NC 82659 n3 TRC19 MD
Fig. 2. Relational tables in databaseD1. CL stands for Confidence Level in Table1,
andLNstands for License Number inTable2, and⊥stands for a null value.
error, for which the system supplies either a confidence figure in the interval [0,1] or a null value, denoted ⊥. The city sets 0.8 as the minimum confidence required in answering its query about NC registrants.
Suppose further that the city’s databaseD1 is a relational database that in-cludes copies a tableTable1obtained from the LPR system and a tableTable2 obtained from the NC Department of Motor Vehicles (DMV), as presented in Figure 2. Observe that neither Table1 nor Table2 can address the aforemen-tioned task perfectly by itself. The queryQ1 given by
(Q1): SELECT user FROM Table1
WHERE state = ’NC’ and date=’07/04/2014’ and CL >= 0.8; fails because of the lack of the attribute stateand the null value in row 1, and the queryQ2 given by
(Q2): SELECT name FROM Table2
WHERE state = ’NC’ and date=’07/04/2014’ and CL >= 0.8; fails because of the lack of the attributes date andCL. Together, however, the two tables can provide the desired answers, as we explain below.
3.2 Tasks
For simplicity of treatment, the formalization of DRL undertaken here restricts attention to data stored in relational databases, and each task consists of a standard SQL query with a restricted form. More general formalizations drop or weaken these restrictions and broaden the conception of task.
We first elaborate the notion of task used here.
Definition 1. A task is a SQL query composed of SELECT, FROM, and WHERE
clauses that has no subqueries and in which the FROM clause references a single table.
Definition 2. The task signatureof a queryQ, written T(Q), is a triple
T(Q) = [S(Q), F(Q), W(Q)] (1)
in whichS(Q)is the set of attributes in theSELECTargument ofQ,F(Q)is the set of tables in theFROMargument ofQ, andW(Q)is the set of attributes in the
WHERE argument ofQ.
In considering of enumerated queriesQ1, . . . , Qn, we writeTi,Si,Fi, andWifor the signature elements ofQi.
Definition 3. The available attributes of a query Q, writtenA(Q), is the set of all attributes in all tables inF(Q).
Of course, restricting attention to queries with only one FROM table means that the available attributes of a query are just the attributes in that single table.
For example, the queriesQ1 andQ2 given in Example 1 have the following signatures.
T1= [{user},{Table1},{state,date,CL}] (2)
T2= [{name},{Table2},{state,date,CL}] (3) The available attributes of these queries consist of the following sets.
A1={row,plate,lane,CL,user,time,date}
A2={LN,name,plate,state}
As noted previously, theSELECT and WHEREattributes of these queries refer to attributes not among the attributes available in the query.
For convenience, we sometimes include the set of available attributes in the query signature, writingT = [S, F, W, A].
3.3 Database Relevance Utility
We regard readiness judgments as involving notions of utility of data in perform-ing tasks. Utility might depend on numerous factors, but for this initial study we consider a very simple form of utility that assumes readiness depends only on the signature of a task, not on the specific query, and that combines a notion of relative relevance of different attributes in the task signature with a notion of relative importance of completeness of different attributes in the task signature. Definition 4. The task-specific relevance utility of an attribute to a task sig-nature T = [S, F, W], denoted ρ(a, T) for a ∈ S or a ∈ W, is a nonnegative number representing the relative importance of that attribute in performing the task.
We regard these attribute utilities as cardinal utilities, that is,ρ(a, T) = 2ρ(a0, T) means that the relevance ofais twice as important to readiness as is a0.
a user state date CL
ρ(a) 4 1 4 2
Table 1.Relevance utility values forQ1.
Definition 5. The relevance utility of a database D for a task with signature
T = [S, F, W, A], denoted R(D, T), is defined as the proportion of the total rele-vance utility of the task attributes available in the database (available relerele-vance utility) to the total relevance utility of all the attributes in the task (ideal rele-vance utility), or formally,
R(D, T) =
P
a∈S∩Aρ(a, T) +
P
a∈W∩Aρ(a, T)
P
a∈Sρ(a, T) +
P
a∈Wρ(a, T)
ifD containsF
0 otherwise.
(4)
By D contains F, we mean that the database D includes each of the tables in F. The numerator of the fraction in 4 represents available relevance utility and the denominator represents ideal relevance utility. Thus if the query FROM table exists in the database, a weighted average method is used to formulate the relevance of the database to the task, while if the FROM table does not exist in the database, the corresponding relevance value is zero.
To extend Example 1, assume that the relative relevance utilities of attributes for T1 are given by those in Table 1. Also, assume that the relevance utility of attributes for T2 are the same as those in Table 1. Moreover, consider name and user attributes in T1 andT2 respectively, having the same relevance util-ity value. Using (4), we compute the relevance of D1 for T1 and T2 using the signatures given in (2) and (3) to be
R(D1, T1) =R(D1,[{user},{Table1},{state,date,CL}]) = 4 + 0 + 4 + 2
4 + 1 + 4 + 2 = 0.91
R(D1, T2) =R(D1,[{name},{Table2},{state,date,CL}]) = 4 + 1 + 0 + 0
4 + 1 + 4 + 2 = 0.45
3.4 Database Completeness Utility
In order to define the completeness utility of a database for a task, we first define the notion of attribute completeness for a database as follows. We write r∈D
to mean that the relational database D contains a relational table r. We write
a∈rto mean that the relationrcontains an attributea. Whenr∈D, we write
|r| to denote the number of rows inr, and when a∈r as well, write|r(a6=⊥)|
a user state dater CL
κ(a) 1 2 4 3
Table 2.Completeness utility values forQ1 of Example 1.
Definition 6. The attribute completeness fractionof an attributeawith respect to a database relation r, denotedφ(a, r), is defined as the fraction of rows of r
containing non-null values for a, or formally,
φ(a, r) =
|r(a6=⊥)|
|r| ifa∈r and|r| 6= 0
0 otherwise.
(5)
For example, in Example 1, taking r to be Table1, φ(time, r) is 1, while
φ(user, r) is 34.
We now employ a notion of relative utility of the completeness of attributes, paralleling the notion of attribute relevance utilities.
Definition 7. The task-specific completeness utility of an attribute to a task signature T = [S, F, W], denotedκ(a, T) fora∈S or a∈W, is a nonnegative number representing the relative importance of the completeness of that attribute to performing the task.
We assume these completeness utility values are cardinal and depend only on the task signature.
One can now combine attribute completeness utilities into a database com-pleteness utility as follows.
Definition 8. The database completeness utilityof a databaseDfor a task with signature T = [S, F, W, A], denoted K(D, T), is defined as the proportion of the total completeness utility of the task attributes available in the database (available completeness utility) to the total completeness utility of all the attributes in the task (ideal completeness utility), or formally,
K(D, T) =
P
a∈Sκ(a, T)φ(a, F) +
P
a∈Wκ(a, T)φ(a, F)
P
a∈S∩Aκ(a, T) +
P
a∈W∩Aκ(a, T)
ifD containsF
0 otherwise.
(6) The completeness utility of a query is computed as the completeness utility of each query attribute weighted by its completeness (the numerator in (6)), and normalized by the total possible completeness utility (the denominator in (6)).
utility value. Using (5) and (6), we compute the completeness utility ofD1 for
T1 andT2 using the signatures given in (2) and (3) to be
K(D1, T1) =K(D1,[{user},{Table1},{stater,date,CL}])
= 1.(3
4) + 2.(0) + 4.(1) + 3.(1) 1.(1) + 2.(0) + 4.(1) + 3.(1) = 0.97
K(D1, T2) =K(D1,[{name},{Table2},{state,date,CL}]) = 1.(1) + 2.(1) + 4.(0) + 3.(0)
1.(1) + 2.(1) + 4.(0) + 3.(0) = 1
3.5 Database DRL
Based on the discussions in Sections 1 and 2 we define data readiness level as a vector of relevance and completeness dimensions in which relevance represents the closeness between data content and task requirements, and in which com-pleteness represents availability of values for attributes required to address a task.
Definition 9. The data readiness level (DRL)of a databaseD with respect to a taskT, writtenDRL(D, T), consists of the relevance and completeness utilities of the database with respect to the task, namely
DRL(D, T) = [R(D, T), K(D, T)]. (7) For example, in Example 1 the DRL forD1forT1 and forT2 are given by
DRL(D1, T1) = [0.91,0.97]
DRL(D1, T2) = [0.45,1].
To obtain a unidimensional measure of readiness, one can instead regard relevance and completeness utilities as subutility functions of a more inclusive conception of utility of a database for a task. To do this, one defines a total utility functionDRL∗(D, T) taking numerical values. Such a total utility function might be obtained as some function of the relevance and completeness utility figures alone, such as a weighted sum of the two (w1R(D, T) +w2K(D, T), or as a nonlinear combination of the two components, or as a more general evaluation that takes into account other properties of the database and task.
To extend the notion of database readiness to several tasks, one can aver-age readiness across tasks or treat readiness as a game-theoretic multicriteria optimization problem.
denoting the weight ofQ, and obtains a weight-relative measure of DRL as
DRL(D) =
PI
i=1w(Qi)DRL(D, Ti)
PI
i=1w(Qi)
. (8)
Here one multiplies and sums readiness and completeness components pointwise. For example, one might weight each query by the number of times it is imposed on the database. Using this interpretation in further extending Example 1, assume that Q1 is performed 50 times onD1, and thatQ2 is performed 100 times. The averaging approach then yields an overall DRL forD1of
DRL(D1) =
50.(0.91,0.97) + 100.(0.45,1)
150 = [0.60,0.99].
The multicriteria optimization approach comes in two versions. In the pes-simistic optimization, one seeks to minimize the worst one can do with respect to the two readiness dimensions, seeking to identify the elements of
min
i (DRL(D, Ti)). (9)
In the optimistic version, one seeks instead to maximize the readiness dimensions as represented by the elements of
max
i (DRL(D, Ti)). (10) Identifying these solutions constitutes a Multi Criteria Decision Making (MCDM) problem, and more specifically, a Multi Attribute Decision Making (MADM) problem, which can be solved by various solution approaches (TOPSIS, AHP, SAW, etc.).
Applying the multicriterion optimization approach to Example 1 under the same frequency assumptions as considered before, one sees thatDRL(D1, T1) is higher in relevance but lower in completeness than DRL(D1, T2). Thus in the absence of further optimization criteria, D1 is Pareto optimal with respect to the two queries.
4
Improving DRL
Data-Readying Operators
Database Inte-grating Operators
Resource Chang-ing Operators Null Values
Clean-ing Operators
Providing the range Inferring via at-tribute dependencies
Replacing with mean value Replacing with values of matching attribute
of another table
Fig. 3.Data-Readying Operator types
4.1 Data-Readying Operators
Operators aimed at improving data readiness fall into three main classes: Null Values Cleaning Operator (NVCO), Resource Changing Operator (RCO), and Database Integrating Operator (DIO). Figure 3 presents these as part of a tax-onomy of operators. NVCOs look for null values existing in the relations of a database and uses four possible techniques to clean the null values which in-creases the completeness of the database. RCOs look for alternative resources (relations) for a task to increase the relevance of the database for that specific task. Finally, DIOs look for appropriate databases which can be integrated with current database to improve both relevance and completeness. Since DIOs re-quire specific assumptions beyond the ones we considered in Section 3 of this paper, they are not detailed here.
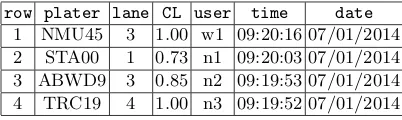
row plater lane CL user time date 1 NMU45 3 1.00 w1 09:20:16 07/01/2014 2 STA00 1 0.73 n1 09:20:03 07/01/2014 3 ABWD9 3 0.85 n2 09:19:53 07/01/2014 4 TRC19 4 1.00 n3 09:19:52 07/01/2014
Table 3.ImprovedTable1of LPR data
4.2 Null Values Cleaning Operators
NVCOs aim to improve DRL by removing null values. NVCOs are explained in the following:
Matching Attributes This method aims to clean null values of an attribute in a table using non-null values of a matching attribute in another table. Two attributes are matched if they represent the same concept in the subject matter ontology. Cleaning the null values can be done by using a concept appearing in both tables as a base for pairing records across tables.
For example, in Example 1,Table1has attributesplate anduserpointing to concepts P lateN umber and U serN ame, also Table2 has attributes plate and name pointing to concepts P lateN umber and U serN ame. Thus, platein Table1matchesplateinTable2anduser inTable1matchesnamein Table2. Consequently, null values ofuser attribute inTable1 can be replaced byname attribute of Table2 based on the concept P lateN umber and through pairing the records containing the same values ofplateattribute in Table1andplate attribute inTable2. The output of implementing this matching attribute DRO onuserattribute ofTable1in Example 1 is demonstrated in Table 3.
In addition to knowledge about database structure and the operator function-ality, implementing attribute matching NVCO requires several types of knowl-edge, namely:
– A subject-matter ontology containing the concepts present in the database; and
– A mapping between equivalent concepts and table attributes.
Replacement With the Mean In some applications, knowledge of statistical characteristics of a numerical attribute is used to clean null values. In particular, if the mean and distribution type of the values of an attribute are known, or are known to be close to the mean of the non-null values of the attribute in the database, one can replace null values by the mean value.
In addition to knowledge about database structure and the operator function-ality, implementing replacement with the mean value requires statistical knowl-edge about the distribution of attributes.
Inferring Values Through Attribute Dependencies This approach at-tempts to infer missing values of an attribute from dependencies that relate the missing values to values of other attributes.
Implementing value inference requires knowledge of the dependencies among different attributes in addition to knowledge about database structure and the operator performing behavior.
Evaluating the Range of Null Values This DRO aims to provide a range for the values of an attribute. If it is assumed that a continuous quantitative attribute has normal distribution, then about 99.74 percent of attribute values fall into±3 standard deviation from mean value. Thus, if the number of non-null values for the attribute is statistically adequate, then this DRO provides a range for null values by computing the mean and standard deviation logically. The idea is by 99.74% confidence level the null value falls inµ±3σ.
In addition to general requirements of knowledge about database structure and the operator functionality, this DRO operates through the statistical knowl-edge about distribution of attributes.
4.3 Resource Changing Operators
This DRO changes theFROMargument of queries to see if the new table or tables yields a better DRL value than the old table or tables. If it does, the query is changed to reflect the newFROM argument.
In addition to general requirements, this DRO requires the following for im-plementation:
– Logical definition of DRL which is able to compute the completeness and relevance logically; and
– A module to find available resources or relations to replace theFROM argu-ment of the task.
5
Use Case: Marketing
To demonstrate the concepts introduced in section 4, we introduce the following use case to complement Example 1. In this use case, the marketing department of a company decides to mail customers over 20 years old withPlan Bto motivate them to switch toPlan A.
The relational databaseD2contains the SalesandCustomerrelations pre-sented in Figure 4. These contain a company’s information about its sales and customers.
Table4:Sales Table5:Customer
id customerId boughtPlan date
1 103 Plan B 01/11/2015
2 102 Plan B 10/05/2014
3 104 Plan A 12/28/2014
4 102 Plan A 01/07/2014
id name address currentPlan age 101 David Smith 22nd St. Plan A ⊥ 102 Alfred Luck 20th St. ⊥ 18 103 Daniel Bush 25th St. Plan B 30 104 Goldy Elbetri 7th St. ⊥ ⊥
Fig. 4.SalesandCustomertables for Marketing problem
a name address currentPlan age
κ(a) 1 4 4 2
Table 4.Completeness utilities for Example 2
(Q3): = SELECT name, address FROM Customer
WHERE currentPlan = ’Plan B’ and age >= 20;
Consequently,T3 is as follows:
T3= [{name,address},{Customer},{currentPlan,age}]. (11)
Since all of the attributes required to addressQ3are contained in the database, the relevance value of database D2 for T3 is 1. Assume that the completeness utilities for attributes inT3are contained in Table 5. Following the formulas in Section 3 yieldsDRL(D2, T3) = [1.0,0.73].
Assuming that the values of theageattribute inCustomertable are normally distributed, there are statistically enough observations with non-null value for ageattribute inCustomertable, and most of the observations on customers fall around mean value, replacing the null values of age attribute with its mean
value is possible. The output of implementing this DRO in Marketing problem onageattribute of Customertable is demonstrated in Table 5.
id name address currentPlan age 101 David Smith 22nd St. Plan A 24 102 Alfred Luck 20th St. Plan B 18 103 Daniel Bush 25th St. Plan B 30 104 Goldy Elbetri 7th St. Plan A 24
Table 5.ImprovedTable5of Customertable
6
Conclusion and Future Work
This paper has studied the problem of quantifying the readiness of a relational database to handling tasks expressed as SQL queries. We call this the Data Readiness Level or DRL of the database with respect to the task.
We formalized the problem to not only evaluate the current level of data readiness in terms of relevance and completeness data quality metrics, but also to identify “data readying” operators that improve readiness. The proposed for-malization is extensible to quantify the overall relevance and completeness data quality dimensions of a database with respect to a set of new tasks or queries. We discussed several DRL-improving operations and identified the knowledge required to apply them as including a) a structure mapping attributes to con-cepts in the database ontology to find matching attributes in the relations, b) the logical definition of data readiness level, c) logical definition of data readying operators, d) facts about relations in the database, and e) the rules provided by user about the world in which the database exists and the attribute dependen-cies.
This inital study of DRL involves several simplifying assumptions about the structure of databases, tasks, and task-dependent utility of different represen-tations of data. Our future work aims to relax these assumptions, and this aim provides many important problems to investigate. Specifically, considering in-ference tasks that employ more than one table permits DRL assessment and improvement to involve joined relations. Extending the framework to allow sub-queries enables treatment more complex and realistic scenarios. Finally, data readiness assessment can be extended to cover additional data quality dimen-sions and application to databases other than relational databases.
Acknowledgment. This material is based upon work supported in whole or in part with funding from the Laboratory for Analytic Sciences (LAS). Any opinions, findings, conclusions, or recommendations expressed in this material are those of the author(s) and do not necessarily reflect the views of the LAS and/or any agency or entity of the United States Government.
References
2. Sebastian-Coleman, L.: Measuring data quality for ongoing improvement a data quality assessment framework. Burlington: Elsevier Science, 40-53, ch04, (2013). 3. Heinrich, B., Kaiser, M., Klier, M.: How to measure data quality? A metric-based
approach (2007)
4. Gardyn, E.: A Data Quality Handbook for a Data Warehouse. Infrastructure. IQ, 267–290 (1997)
5. Wang, R. Y., Storey, V. C., Firth, C. P.: A framework for analysis of data quality research. Knowledge and Data Engineering, IEEE Transactions on, 7(4):623-640, (1995).
6. Redman, T. C., Blanton A.: Data quality for the information age. Artech House, Inc., (1997).
7. Lee, Y. W., Strong, D. M., Kahn, B. K., Wang, R. Y.: Aimq: a methodology for information quality assessment. Information & management, 40(2) 133-146, (2002). 8. Eppler, M. J.: Managing information quality: increasing the value of information in
knowledge-intensive products and processes. Springer, (2006).
9. English, L. P.: Improving data warehouse and business information quality. J. Wiley & Sons, (1999).
10. Hinrichs, H., Datenqualitatsmanagement in Data Warehouse-Systemen. PhD the-sis, Universitat Oldenburg, (2002).
11. Heinrich, B., Klier, M., Kaiser, M., A procedure to develop metrics for currency and its application in crm. Journal of Data and Information Quality (JDIQ), 1(1):5, (2009).
12. Ballou, D., Wang, R., Pazer, H., Tayi, G., K.: Modeling information manufacturing systems to determine information product quality. Management Science, 44(4):462-484, (1998).
13. Heinrich, B., Helfert, M.: Analyzing data quality investments in crm. a model-based approach. (2003).
14. Teboul, J.: Managing quality dynamics. Prentice Hall, (1991).
15. Pipino, L. L., Lee, Y. W., Wang, R. Y.: Data quality assessment. Communications of the ACM, 45(4):211-218, (2002).
16. Even, A., Shankaranarayanan, G., Utility-driven assessment of data quality. ACM SIGMIS Database, 38(2):75-93, (2007).
17. Kulikowski, J. L.: Data Quality Assessment. In: Ferraggine, V. E., Doorn, J. H., Rivero, L. C. : Handbook of Research on Innovations in Database Technologies and Applications: Current and Future Trends (2 Volumes). pp. 378-384 Hershey, PA: Information Science Reference. doi:10.4018/978-1-60566-242-8. ch041 (2009). 18. Wang, R. Y., Strong, D. M.: Beyond accuracy: what data quality means to data
consumers. Journal of Management Information Systems 12 (4), pp. 534, (1996). 19. Jarke, M., Vassiliou, Y.: Data warehouse quality: a review of the DWQ project.
Proceedings of the Conference on Information Quality, Cambridge, MA, pp. 299313, (1997).
20. Delone, W. H., McLean, E. R.: Information systems success: the quest for the dependent variable. Information systems research 3 (1), pp. 6095 (1992).
21. Redman, T. C.: Data Quality: Management and Technology. Bantam Books, New York, NY, (1992).
22. Wand, Y., Wang, R. Y.: Anchoring data quality dimensions in ontological founda-tions Communicafounda-tions of the ACM 39 (11), pp. 86-95 (1996).
23. Date C. J., Database in Depth - Relational Theory for Practitioners. OReilly, 2005. 24. Codd, E. F.: Understanding relations (installment # 7). FDT - Bulletin of ACM
25. Codd, E. F.: Extending the database relational model to capture more meaning. ACM TODS, 4(4) 397434, (1979).
26. Date, C. J.: Database in Depth - Relational Theory for Practitioners. OReilly, (2005).
27. Date, C. J., Darwin, H.: A Guide to the SQL Standard. Addison-Wesley, (1996). 28. Libkin, L.: “Incomplete data: what went wrong, and how to fix it.” In Proceedings
of the 33rd ACM SIGMOD-SIGACT-SIGART symposium on Principles of database systems, 1-13. ACM, (2014).
29. Abiteboul, S., Hull, R., Vianu, V.: Foundations of Databases. Addison-Wesley, (1995).
30. Grahne, G.: The Problem of Incomplete Information in Relational Databases. Springer, (1991).
31. Reiter, R.: On closed world data bases. Logic and Data Bases, 5576, (1977). 32. Reiter, R.: Towards a logical reconstruction of relational database theory. On
Con-ceptual Modelling, 191233, (1982).
33. Libkin, L.: A semantics-based approach to design of query languages for partial information. Semantics in Databases, LNCS 1358, 170208. Springer, (1995). 34. Buneman, P., Jung, A., Ohori, A.: Using power domains to generalize relational
databases. TCS, 91(1), 2355, (1991).
35. Deshpande, O., Lamba, D. S., Tourn, M., Das, S., Subramaniam, S., Rajaraman, A., Doan, A.: Building, maintaining, and using knowledge bases: A report from the trenches. In Proceedings of ACM SIGMOD International Conference on Manage-ment of Data, 1209-1220, ACM (2013).
Determining Query Readiness for Structured Data . . . 1
Farid Alborzi, Rada Chirkova, Jon Doyle, and Yahya Fathi 1 Introduction . . . 1
1.1 Motivation . . . 1
1.2 Contribution and Plan of the Paper . . . 3
2 Related Works . . . 3
3 Formalizing DRL . . . 5
3.1 Example 1: Traffic Flow Identification . . . 5
3.2 Tasks . . . 6
3.3 Database Relevance Utility . . . 7
3.4 Database Completeness Utility . . . 8
3.5 Database DRL . . . 10
4 Improving DRL . . . 11
4.1 Data-Readying Operators . . . 12
4.2 Null Values Cleaning Operators . . . 13
Matching Attributes . . . 13
Replacement With the Mean . . . 13
Inferring Values Through Attribute Dependencies . . . 14
Evaluating the Range of Null Values . . . 14
4.3 Resource Changing Operators . . . 14
5 Use Case: Marketing . . . 15
6 Conclusion and Future Work . . . 16