ABSTRACT
POOLE, CHAD ASHLEY. The Effect of Controlled Drainage on Crop Yields and Nitrate Nitrogen Losses on Drained Lands in Eastern North Carolina. (Under the direction of co-chairs R.W. Skaggs and M.A.Youssef.)
Research studies on a wide range of soils, crops, locations, and climates have shown
that Controlled Drainage (CD) has the potential to substantially reduce the loss of nitrogen
(N), from drained agricultural lands to surface waters. Controlled drainage is an integral part
of Drainage Water Management (DWM), of which the adoption and widespread application
depends on its impact on crop yields and overall performance on reducing nitrogen loading.
This dissertation presents results from a long term field study on the effect of CD on crop
yields and nitrate-N losses in a 3 crops in 2 years corn/wheat-soybean rotation.
Crop yields were measured on replicated field scale plots under CD and conventional
or Free Drainage (FD) treatments for a total of 18 crops on two experimental sites during the
period 1990 to 2011. Data were collected on 7 corn crops, 5 wheat crops and 6 soybean
crops. Controlled drainage had no significant effect on yields of winter wheat, which in
North Carolina is grown in the wettest, coolest part of the year. Controlled drainage
significantly increased corn yields compared to FD in all 7 years. The average yield increase
for corn was 11% with a range between 4 and 23%. Controlled drainage also significantly
increased soybean yield in all years with an average increase of 10% compared to FD with a
range between 2 and 20%. The data shows that small amounts of drainage water conserved
by CD during critical periods of the growing season can have a substantial impact on crop
1992 and 2012. Annual nitrate-N export was reduced by an average of 6.3 kg/ha or 30%
compared with FD. Annual reductions ranged from 0.5 to 14.1 kg/ha. The observed
reductions were a function of significant increases in NO3-N concentrations and significant
decreases in drainage volumes with CD. Controlled drainage reduced annual drainage
volumes by 33% on average. The reduction in drainage volume and increases in nitrogen
removed by the crop under CD were the primary factors responsible for reducing NO3-N
export. The reduction in the loss of NO3-N with CD is about the same as the increase in N
taken up and harvested by the crop. The successful reduction in NO3-N is directly linked to
continuous management and control settings. The results indicate that CD is an effective
© Copyright 2015 Chad Ashley Poole
The Effect of Controlled Drainage on Crop Yields and Nitrate Nitrogen Losses on Drained Lands in Eastern North Carolina
by
Chad Ashley Poole
A dissertation submitted to the Graduate Faculty of North Carolina State University
in partial fulfillment of the requirements for the Degree of
Doctor of Philosophy
Biological and Agricultural Engineering
Raleigh, North Carolina
2015
APPROVED BY:
_______________________________ _______________________________
Dr. R. Wayne Skaggs Dr. M. Youssef Co-Chair, Minor Representative Co-Chair
_______________________________ _______________________________
DEDICATION
BIOGRAPHY
Chad A. Poole was born on January 24, 1981 to Steve and Lucinda Poole. He was
born and raised on a small family farm in Belhaven, N.C., in Beaufort County. His parents
and grandparents instilled in him the value of hard work and stressed the importance of
dedication to everything one undertakes.
He graduated Valedictorian of his class at Northside High School in 1999. That fall,
Chad enrolled in North Carolina State University to pursue a degree in Biological and
Agricultural Engineering. He received a B.S. in Biological and Agricultural Engineering in
2003 with dual concentrations in Agriculture and Environmental Engineering while also
receiving a minor in Agribusiness Management. He also graduated Valedictorian of his class
at NCSU in 2003.
In May 2006, he graduate from the Department of Biological and Agricultural
Engineering (BAE) with and M.S. degree under the direction of Dr. R.W. Skaggs and Dr.
G.M. Chescheir. His thesis focused on the effects of shallow subsurface drains on nitrate-N
and orthophosphorus losses from drained lands.
In January of 2007, while working as a ¾ time Research Associate in BAE, he began
his efforts to pursue a PhD degree under the direction of Dr. R.W. Skaggs and Dr. Mohamed
Youssef. His dissertation work was focused on determining the effects of drainage water
management on crop yields and nitrate-N losses in North Carolina.
While studying at NCSU, Chad has remained active in the day-to-day operations of
the family farm. He has continued working as a Research Associate and received his
water control structure for open ditch drainage systems. He has planned/or participated in
over 20 extension related Drainage Water Management field days, workshops, or meetings
ACKNOWLEDGMENTS
We can do all things through the support of God and family. Without their help, no
matter how dedicated or passionate one is about the work he undertakes, success will not
come. First and most importantly, I want to thank the Lord for standing beside me and
offering support throughout my life. This dissertation would not have been possible without
you in my life. Thank you to my family for your support.
Secondly, I’d like to thank my committee for the opportunity to undertake this
project, and for the countless hours of support and encouragement given to me along the
way. Dr. Skaggs has not only been a professional role-model but a caring friend during some
difficult times. His patience and understanding will always be appreciated. In his own way,
he could always point out the areas where improvement was necessary while at the same
time offering encouragement to get the job done. It has truly been an honor to work with Dr.
Skaggs.
Dr. Youssef has supported me throughout the project. He has offered valuable
encouragement and insight during this process. A special thanks is offered to him for his
support and assistance with the completion of this work.
Dr. Chescheir and Dr. Crozier offered valuable support for field work, equipment,
and data analysis. Without their extensive knowledge and assistance in these areas, it would
have been difficult to complete this project. A special thank you is given to them for their
My family has served not only in a supportive role, but also in a cooperative role.
Assistance was offered numerous times with site setup, downloading data, and collecting
water samples. Their help will always be greatly appreciated.
I worked closely with Wilson Huntley and Dr. Tim Appelboom in the maintenance
and installation of equipment. Tim served in electronic troubleshooting of the site, and
Wilson always assisted when maintenance work had to be performed. Jewell Tetterton
provide support by periodically checking the site for problems and coordinating the planting
and harvesting operations with Dr. Crozier and myself.
The Biological and Agricultural Environmental Analysis Laboratory and the Soil
Science Analysis Laboratory at North Carolina State University deserve special thanks for
TABLE OF CONTENTS
LIST OF TABLES ... ix
LIST OF FIGURES ... xi
CHAPTER 1. INTRODUCTION ... 1
INTRODUCTION ... 1
Conventional Systems ... 1
Controlled Drainage Systems or Drainage Water Management Systems. 2 Management of DWM Systems for Crop Yield ... 4
Stresses Due to Excessively Wet Soil Water Conditions (Wet Stresses). 5 Stresses Caused by Deficit Soil Water Conditions (Dry Stresses) ... 6
Corn... 7
Soybeans ... 10
Wheat ... 12
Management of CD systems for Nitrate-N Reduction ... 13
OBJECTIVES ... 16
REFERENCES ... 18
CHAPTER 2. THE EFFECTS OF DRAINAGE WATER MANAGEMENT ON CROP YIELDS IN NORTH CAROLINA ... 23
ABSTRACT ... 23
INTRODUCTION ... 24
MATERIAL AND METHODS ... 28
Site 1- TRS ... 29
Site 2- BATH ... 31
RESULTS AND DISCUSSION ... 36
SUMMARY AND CONCLUSIONS ... 44
ACKNOWLEDGEMENTS ... 45
CHAPTER 3. THE EFFECT OF DRAINAGE WATER MANAGEMENT ON
NITRATE NITROGEN LOSS TO TILE DRAINS IN NORTH CAROLINA ... 49
INTRODUCTION ... 49
MATERIALS AND METHODS ... 54
Site and Drainage System ... 54
Water Table Management ... 63
Statistical Analysis ... 65
RESULTS AND DISCUSSION ... 65
Hydrology: Effect of CD on Drainage and Water Table Depth ... 71
Effect of CD on Losses of Nitrate-N in Drainage Water ... 76
CONCLUSIONS... 83
REFERENCES ... 84
APPENDIX ... 89
LIST OF TABLES CHAPTER 1
Table 1.1. Crop growth stages of corn plants ... 7
Table 1.2. Crop susceptibility factors for corn... 9
Table 1.3. Crop growth stages of soybean plants ... 10
Table 1.4. Crop susceptibility factors for soybeans ... 11
Table 1.5. Guidelines for CD management in NC ... 15
CHAPTER 2 Table 2.1. Measured crop yields for conventional free drainage (FD) and controlled drainage (CD) for three crops on two sites in North Carolina ... 37
CHAPTER 3 Table 3.1. Field effective hydraulic conductivity and drainable porosity for Portsmouth sandy loam on field plots 2-5 on the Tidewater Research Station, Roper, NC ... 56
Table 3.2. Cropping sequence, tillage practices, liming, and fertilizer rates and timings for 1992-1994, 2007-2012 ... 61
Table 3.3. Monthly and annual precipitation (mm) from the research site compared to 50 year average ... 66
Table 3.4. Measured rainfall minus potential evapotranspiration (mm) for April-October ... 66
Table 3.5. Average annual drainage outflow for conventional (free) drainage and for controlled drainage at the Tidewater Research Station, Plymouth, NC ... 74
Table 3.6. Water table elevations during the study ... 76
the study period ... 76
Table 3.8. Losses of NO3-N measured in subsurface drainage waters by
treatment and replication at the Tidewater Research Station,
Plymouth, NC ... 79
Table 3.9. Nitrogen removed in the grain harvest and total measured export
LIST OF FIGURES CHAPTER 1
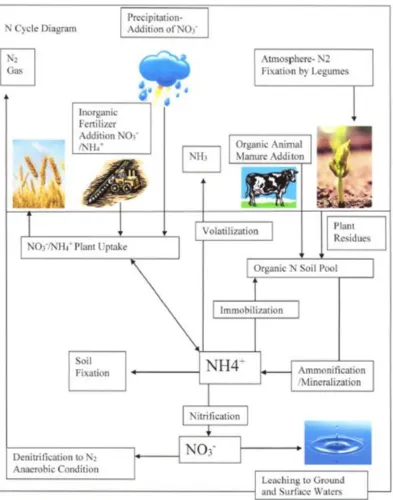
Figure 1.1. Nitrogen Cycle ... 15
CHAPTER 2
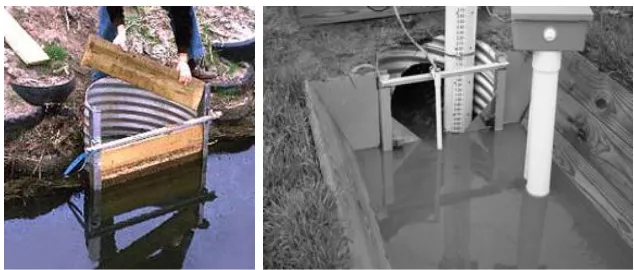
Figure 2.1. Flashboard riser control structure (left). Weir for measuring
drainage rates (right) ... 26
Figure 2.2. General layout of the Tidewater Research Station
experimental site near Plymouth, NC and site locations in NC ... 29
Figure 2.3. General layout of the Bath open-ditch experimental site near
Bath, NC ... 34
Figure 2.4. Controlled and conventional DWM for corn in 1993 ... 39
Figure 2.5. Controlled and conventional DWM for soybeans in 1994 ... 39
Figure 2.6. Monthly precipitation values for 1993, 1994, and 50 year
average, (1957-2006) at TRS ... 40
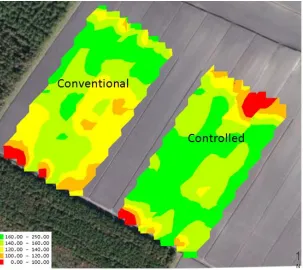
Figure 2.7. Spatial distribution of corn yield in Bath, 2008 ... 44
CHAPTER 3
Figure 3.1. General layout of the drainage system at the Tidewater
Research Station site ... 57
Figure 3.2. Detailed layout of an experimental field plot at the Tidewater
Research Station site ... 59
Figure 3.3. Effect of controlled drainage on hydrology and NO3-N losses in
drainage water during 1994. Crops were wheat followed by soybean. (A) Daily drainage and NO3-N concentration and
sampling dates for CD and FD; (B) Daily water table (WT) depth, precipitation, and control setting for CD and FD; (C) Cumulative drainage and precipitation for CD and FD; (D) Fertilizer applications and flow weighted NO3-N measured
concentrations for CD and FD; (E) Cumulative NO3-N Export
Figure 3.4. Effect of controlled drainage on hydrology and NO3-N losses in
drainage water during 2008. Crops were wheat followed by soybean. (A) Daily drainage and NO3-N concentration and
sampling dates for CD and FD; (B) Daily water table (WT) depth, precipitation, and control setting for CD and FD; (C) Cumulative drainage and precipitation for CD and FD; (D) Fertilizer applications and flow weighted NO3-N measured
concentrations for CD and FD; (E) Cumulative NO3-N Export
for CD and FD ... 69
Figure 3.5. Effect of controlled drainage on hydrology and NO3-N losses in
drainage water during 2009. Crops was corn. (A) Daily drainage and NO3-N concentration and sampling dates for CD
and FD; (B) Daily water table (WT) depth, precipitation, and control setting for CD and FD; (C) Cumulative drainage and precipitation for CD and FD; (D) Fertilizer applications and flow weighted NO3-N measured concentrations for CD and FD;
(E) Cumulative NO3-N Export for CD and FD ... 70 Figure 3.6. Linear regression analysis for annual CD NO3-N export vs FD
NO3-N export ... 79 Figure 3.7. Total nitrogen removed from field plots under FD and CD
drainage treatments during the 9 year study ... 82
APPENDIX
Figure A.1. Effect of controlled drainage on hydrology and NO3-N losses in
drainage water during 1992. Crop was wheat/soybean. (A) Daily drainage and NO3-N concentration and sampling
dates for CD and FD; (B) Daily water table (WT) depth, precipitation, and control setting for CD and FD;
(C) Cumulative drainage and precipitation for CD and FD; (D) Fertilizer applications and flow weighted NO3-N measured
concentrations for CD and FD; (E) Cumulative NO3-N Export
for CD and FD ... 91
Figure A.2. Effect of controlled drainage on hydrology and NO3-N losses
in drainage water during 1993. Crop was corn. (A) Daily drainage and NO3-N concentration and sampling dates for
and flow weighted NO3-N measured concentrations for CD
and FD; (E) Cumulative NO3-N Export for CD and FD ... 92 Figure A.3. Effect of controlled drainage on hydrology and NO3-N losses in
drainage water during 2007. Crop was corn. (A) Daily drainage and NO3-N concentration and sampling dates for CD and FD;
(B) Daily water table (WT) depth, precipitation, and control setting for CD and FD; (C) Cumulative drainage and
precipitation for CD and FD; (D) Fertilizer applications and flow weighted NO3-N measured concentrations for CD and FD;
(E) Cumulative NO3-N Export for CD and FD ... 93
Figure A.4. Effect of controlled drainage on hydrology and NO3-N losses in
drainage water during 2010. Crop was wheat/soybean. (A)Daily drainage and NO3-N concentration and sampling
dates for CD and FD;(B) Daily water table (WT) depth, precipitation, and control setting for CD and FD;
(C) Cumulative drainage and precipitation for CD and FD; (D) Fertilizer applications and flow weighted NO3-N measured
concentrations for CD and FD; (E) Cumulative NO3-N Export
for CD and FD ... 94
Figure A.5. Effect of controlled drainage on hydrology and NO3-N losses
in drainage water during 2011. Crop was corn. (A) Daily drainage and NO3-N concentration and sampling dates for CD
and FD; (B) Daily water table (WT) depth, precipitation, and control setting for CD and FD; (C) Cumulative drainage and precipitation for CD and FD; (D) Fertilizer applications and flow weighted NO3-N measured concentrations for CD and FD;
(E) Cumulative NO3-N Export for CD and FD ... 95 Figure A.6. Effect of controlled drainage on hydrology and NO3-N losses
in drainage water during 2012. Crop was wheat/soybean. (A) Daily drainage and NO3-N concentration and
sampling dates for CD and FD; (B) Daily water table (WT) depth, precipitation, and control setting for CD and FD; (C) Cumulative drainage and precipitation for CD and FD; (D) Fertilizer applications and flow weighted NO3-N measured
concentrations for CD and FD; (E) Cumulative NO3-N
CHAPTER 1. INTRODUCTION Conventional Systems
Draining surplus water out of the soil profile has been practiced as long as production
agriculture has existed. Van Schilfgaarde (1974) cited writings of the Roman Cato in the
second century B.C. who “referred to the need for removing water from wet fields, stating
that in low–lying areas, it is necessary to have many drains”.
Sustained profitable crop production in poorly drained areas is not possible without
improving drainage. Consequently, crop producers have built drainage systems for centuries
to enable them to utilize poorly drained lands. The purpose of all drainage systems is to
increase the efficiency and reliability of production. The goal is to have high crop yields
with a minimum investment of energy, water and other resources. Skaggs (1982) stated that
drainage systems in humid regions historically have been installed for trafficability and to
remove excess water from the root zone, which prevents crop yields from being reduced by
oxygen deficiencies or other stresses associated with wet soils. In humid regions, the
prevailing drainage practice has been to install drain tubes or ditches as deep as possible and
as wide as possible to meet the primary drainage objectives (Doering, 1982). Though the
deep and wide principle reduces the length and costs of drains required for an area, excessive
drain depths may lead to over-drainage and increased drought stresses in some cases (Skaggs
and Chescheir, 2003).
Ditches have been used along the eastern seaboard of the United States to drain
drainage ditches were installed by individuals or plantation owners. This later moved to
groups of individuals that organized drainage management districts and worked in
cooperation with government agencies (Haynes, 1966). Typical ditch depths in eastern North
Carolina varied from 1 to 1.5 m.
While conventional drainage enables and improves crop production on poorly drained
soils, it can significantly change the quality of water draining from the soils (Gambrell et al,
1975). Since subsurface drainage is increased, a greater amount of soluble nitrogen (mostly
in the form of nitrate nitrogen) can be leached from the soil and exported in the drainage
water (Gilliam et al., 1999). With the increase of subsurface drainage intensity, surface
runoff is decreased which reduces the amount of sediment and sediment bound contaminants
being exported. Nitrogen export from drained land; however, has received the most attention
and has been considered a major source of nutrients leading to algal blooms and hypoxia in
nutrient sensitive receiving waters. Since the late 1970s, a large percentage of drainage
research has focused on methods to reduce nitrogen export from drained lands without
compromising crop production.
Controlled Drainage Systems or Drainage Water Management Systems
Controlled drainage (CD) systems limit the amount of water draining from artificially
drained fields by managing the elevation of the water surface at the drainage outlet. The
water level at the outlet is controlled by a water control structure which is typically a
flashboard riser. When flashboards are added to the riser, the water level at the outlet, during
a drainage event, rises to the level of the boards and drainage rates decrease compared to the
given system by reducing the drainage depth through control of the water level in the drains
and at the outlet.
Controlled drainage was used in the northern everglades of Florida as early as the
1930s (Clayton, 1941). During the 1970s, studies completed by Skaggs et al., 1972; Skaggs,
1973; and Doty et al., 1975 showed that water table control practices could be applied to a
wide variety of soils if design parameters were fitted to soil and site conditions. There are
seven basic design goals for controlled drainage systems as presented by Fouss et al., (1999).
1. Provide trafficability
2. Reduce plant stress caused by excessive soil water
3. Control soil salinity and alkalinity
4. Reduce plant stress caused by deficit soil water conditions
5. Minimize harmful offsite environmental impacts
6. Conserve and efficiently utilize water supplies
7. Maintain a soil-water environment so that other practices, such as conservation
tillage, are more effective and beneficial.
Research has shown that CD can reduce contaminant loads to surface waters from
drained agricultural lands (Gilliam et al., 1979, 1999). More recent research conducted on
various soils and climates in Sweden, Canada, and the Midwest, USA, has shown that CD
reduced nitrogen loads by 18 to 80%. Results from these recent studies along with those from
earlier studies have been summarized and discussed by Skaggs et al. (2010, 2012). Most
studies show that nitrogen reductions due to CD result from the reductions in flow volume
Management of DWM Systems for Crop Yield
Proper management of CD systems is required to achieve maximum crop yield
benefits. Failure to lower the control level during excessively wet periods may increase
excess water stress and damage the growing crop. Not raising the control level after planting
will result in loss of drainage water that could be used by the crop during dry periods. Poor
management of CD can, therefore, lead to lower yields than those occurring with
conventional drainage. Since crop yields play a major role in the adoption of the practice by
producers, yield reductions resulting from poor management can be perceived as a
disadvantage of CD. This perception may be one reason that CD has not been readily
accepted, despite the fact that controlled drainage is an accepted BMP in North Carolina and
is cost shared by programs such as the Environmental Quality Incentives Program (EQIP)
and the North Carolina Agricultural Cost Share Program. Another reason for less than
enthusiastic acceptance and use of CD is the effort needed to manage the system. In order
for CD systems to be enthusiastically accepted and properly managed, producers need to see
an economic incentive to install and manage the system.
There have been a few studies that have reported yield increases under a controlled
drainage system; however, the data are limited. Jaynes (2012) reported an 8% yield increase
of soybean in central Iowa due to CD, but corn yields were not significantly affected by
controlled drainage. In northern Ohio, Fausey et al (2004) reported no significant effect of
CD on corn and soybean yields, while Helmers et al (2012) in southeast Iowa, reported no
increase in soybean yields, but a significant decrease in corn yields. Consistent yield
added to the controlled drainage system as subirrigation (Fisher et al, 1999, Tan et al., 2004,
Allred et al., 2003, and others). Documenting the long term yield benefits of the practice has
been limited due to the long time required to complete such studies. As a result, much of the
predicted benefits have come from short term studies followed by long term modeling
(Skaggs and Gilliam, 1981; Ale et al, 2009). More data are needed on yield benefits of this
drainage management system to ensure the continued support of the BMP by producers and
to develop management strategies that increase crop yields. Specific issues relating to
managing a drainage system to reduce water related stresses and increase crop yields are
briefly discussed the following sections
Stresses Due to Excessively Wet Soil Water Conditions (Wet Stresses). Excess water in the root zone leads to oxygen depletion which is the main cause of stress in plants.
Processes affected by excessive water in the root zone include soil oxygen and carbon
dioxide exchange with the atmosphere, oxidation-reduction reactions in the soil and
subsequent diffusion of gaseous metabolites, nutrient availability and uptake, and
accumulation of CO2, ethylene, and other toxic substances and byproducts of reduced
conditions such as nitrite, highly soluble Fe and Mn, and hydrogen sulphide (Evans, 1999).
These processes can both directly and indirectly affect crop growth by suppressing seed
germination, restricting root growth and nutrient uptake, shoot wilting, reduction in available
nutrients such as nitrate-N, epinastic curvature of main stems, chlorosis, and desiccation.
Comprehensive reviews of the effects of excessive water stresses in growing crops is given
by Clement (1921), Russell (1952), Wesseling and van Wijk (1957), Grable (1966),
(1985), Heritage (1985), Kowalik (1985), Patwardhan et al. (1988), Evans (1999), and
multiple others.
Stresses Caused by Deficit Soil Water Conditions (Dry Stresses). Inadequate access to soil water during any part of a plant’s physiological growth can have significant
impacts on yields. Drought stress decreases nutrient transport in soil by diffusion and mass
flow to the root surfaces thus decreasing nutrient absorption by roots. Under dry stress, roots
are unable to take up nutrients from the soil because of lack of activity of fine roots, water
movement, and ionic diffusion of nutrients (Prasad, 2008). Several research studies have
reported reduced N response by plants under low soil moisture contents (Larson 1950,
Singleton, et al 1950).
Inadequate moisture when crops are planted can slow, and even prevent, germination.
When inadequate soil moisture exists, conductance is decreased through stomata which limits
the process of transpiration (Cornic, 2000). Plant temperature increases as a result of
decreased water available for transpiration leading to damage to respiratory and
photosynthesis mechanisms. Consequently, biological functions are limited and plant growth
and yield reductions occur.
Photosynthesis processes are significantly reduced under deficit soil water conditions.
At late stages of drought stress, tissue dehydration can occur, leading to metabolic
impairment. Plant respiration is also affected.
The effects of drought stress on whole-plant processes are large and can ultimately
influence germination, emergence, leaf, root, tiller, and stem development and growth, dry
seed yield, and seed quality (Prasad, 2008). Drought stress can not only influence the
transition of one development stage to another, but also the duration of the development
stage. For example, drought stress during a critical period such as pollination for some plants
can lead to failure of fertilization because of decreased pollen or sterility thereby shortening
the pollination period. In general, crops are more sensitive to drought stresses during
reproductive stages of development which influences seed yield.
Corn plants have multiple stages of growth. The stages are broken down into two categories including vegetative (V) and reproductive (R) stages, as given in Table 1.1 below.
Table 1.1. Crop growth stages of corn plants.
Subdivisions of the vegetative stages represent the number of emerged leaves before
the tassel emerges. This can vary from one variety of corn to another and is denoted with
Vn, where n represents the last emerged leaf before tasseling. The R stages are straight
forward and the same for all varieties of corn, though the number of days necessary for each
Water related stresses vary throughout the growth stages of corn. Excessive wet
stresses can cause severe yield losses at any plant stage, but is especially true at the early
vegetative stages. Evans (1999) stated that most crops are more susceptible to moisture
stresses, both excessive and deficient, at some physiological growth stage(s) than others. He
used the stress-day-index (SDI) concept developed by Hiler (1969) to mathematically
describe the response of yield to stresses caused by planting delays, excessive soil water, and
deficit soil water. Hiler used a crop susceptibility factor (CS) to describe a unit of stress
which is a function of crop species and its stage of development. The relationship is given
by:
CSi= (X-Xi)/X, (1.1)
where:
Xi: is the harvested crop yield when subject to the critical stress at growth stage i
X: is the crop yield when no stress is applied
Higher CS values imply that the crop is more susceptible to stress at a particular
stage. Multiple authors have studied this relationship and developed CS values for both corn
and soybeans (Hardjoamidjojo et al., 1982, Desmond et al, 1985, Scott et al. 1989, Mukhar et
al., 1990a, Evans et al 1990, and Shaw, 1974) which are given in table 1.2 below (Evans,
Table 1.2. Crop susceptibility factors for corn.
The CS values imply that the emergence period through silking and pollination are
the more important periods to avoid excessive wet stresses in corn. Kanwar (1988) showed
that excessive water early in the growing season lowered corn yield significantly. The most
critical period for avoiding wet stress is during the late vegetative period when
evapotranspiration and nutrient uptake are maximum.
The late vegetative periods is also important for avoiding dry stress. This period is
2nd only to pollination for drought stress issues. It is therefore important to maximize water conservation to prevent deficit soil conditions at tasseling and silking. These observations
are consistence with studies reported by Denmead (1960), and Robins (1953). Denmead’s
studies showed that drought stress prior to silking (VT-R1) reduced grain yield by 25%,
deficit water at silking (VT-R1) by 50% and moisture stress just after silking (R2) by 21%.
Robin’s study showed that deficit water during one or two days during VT-R1 reduced yield
by 22% and six to 8 days during this period reduced yields by 50%.
A CD water management system for corn must provide adequate drainage from
during this period to prevent saturated conditions in the root zone for a period greater than 24
hours. However, some water must be conserved during this period to ensure a viable water
supply in the subsoil for late vegetation (Vx-Vn) (typically X would represent about the 6th leaf stage). This will ensure that ET demands are met for tasseling, silking, and pollination
(VT-R1) to promote viable pollen for reproduction. Denmead (1960) observed that the
critical period for deficit water stress does not extend longer than 3 weeks after 75% silking.
This would be in line with the R4 period. This implies that water conservation would not be
necessary in most cases 10-14 days after silk emergence, but CD mode should continue
through the growing season for water quality purposes. Operation of irrigation pumps are
also not necessary 10-14 days after silk emergence.
Soybeans plants also have multiple stages of growth. The stages are also broken down into two categories including vegetative (V) and reproductive (R) stages. These stages
are given in Table 1.3 below.
Subdivisions of the vegetative stages are denoted with Vn, where n represents the last
emerged unrolled trifoliolate leaf before bloom. Indeterminate and determinate varieties
grow virtually the same until the R1 stage at which time indeterminate varieties continue to
develop leaves on the main stem and branches throughout the flowering period. Determinate
varieties differ because growth ceases on the main stem after the R1 stage, but leaves
continue to develop on the branches. The R stages are the same for all varieties of soybean,
though the number of days and timing of when each stage starts is dependent on the maturity
group (i.e Group 00 to IX).
Water related susceptibility factors (CS) vary throughout the growth stages of
soybeans (Table 1.4). Excessive wet stresses can cause severe yield losses at any plant stage,
but CS values are higher before ripening. The most critical period to prevent saturated
conditions is during pod development and fill.
The CS values in Table 1.4 are consistent with studies reported by Sionit (1977),
Hobbs (1983), Sugimoto (2000), and Doss (1974). Doss (1974) showed that irrigation after
flowering and just before pod fill was the critical time for maximum yields. Sionit (1977)
showed that drought stress during flower induction and flowering produced fewer flowers,
pods and seeds, whereas stress during earlier pod formation caused the greatest reduction in
the number of pods and seeds at harvest. Hobbs (1983) demonstrated soybean water use to
be low during early season growth with a peak use during late flowering and pod
development in southern Alberta. Sugimoto (2000) noted that seed yield was notably
depressed with excessive soil moisture conditions at the flowering and bud stages. He also
noted that soybeans were more tolerant to wet stresses at the ripening stage than the
flowering or pod fill stages.
It appears that it is essential in a water management system for soybeans to provide
adequate drainage from emergence through pod fill. A CD system should be closely
monitored during this period to prevent saturated conditions in the root zone longer than 24
hours. However, water must be conserved during this period to ensure a viable water supply
in the subsoil for the critical periods of flowering and pod development and fill. As noted,
from the CS values and the reported studies herein, water stress or deficit water stress during
the ripening period is of minimal importance. This implies that water conservation or
irrigation would not be necessary in the majority of cases after pod fill.
Wheat is typically planted in the fall in NC and tillering slows or stops when winter weather turns cold which coincides with the normal high water tables present in the poorly
theory should have little impact on wheat yield. Wheat production may or may not occur in a
typical crop rotation in NC and is highly driven by commodity prices. The two crops that are
most critical to producers in the area where CD can be utilized are corn and soybeans.
Management of CD systems for Nitrate-N Reduction
Drainage and water management practices have a profound influence on the soil N
cycle, Figure 1.1. Drainage promotes aerobic conditions which significantly influences the
rate of mineralization of the soil organic N pool. Good drainage also influences the rate of
nitrification. Both processes are influenced by aerobic bacteria. The enhanced
mineralization and nitrification resulting from improved drainage along with N fertilizer
leads to high amounts of nitrate in the soil profile. Excess nitrate is available for leaching
which is enhanced by improved subsurface drainage. Nitrate leached from the soil through
drainage pipes or ditches can eventually reach nutrient sensitive receiving waters and cause
environmental problems. Nitrate can also be transported through deep seepage to
groundwater and eventually to streams.
Drainage water management can be utilized to control the rate of loss of nitrate by
three processes. The first is to artificially increase the water table elevation in the soil profile
which will remove oxygen from the soil system. This increases the volume of the anaerobic
zone where denitrification can convert nitrate to N2 gas, which is released into the
atmosphere. The second mechanism that drainage water management uses is to control the
drainage outlet elevations reducing the drainage intensity and the subsurface drainage rate.
This reduces the volume of water moving through the soil and leaching NO3-N to surface
enhance crop growth, and ultimately yield, by providing favorable soil water conditions for
crop growth. Excess soil water conditions are prevented by drainage. Deficit water
condition are avoided by not overdrawing the soil profile and conserving water that can later
be utilized by the crop. If soil water is properly managed, crop yields will be improved and
more N will be utilized by the crop and removed from the system at harvest. The key is to
The following guidelines, provided by the Division of Soil and Water Conservation in
North Carolina (Kelly Hedgepeth, personal communication, July 2015), are given to
producers who participate in the NC Cost share program for CD structure management
(Table 1.5). These guidelines where developed based on the information given above and the
typical cropping schedule in NC to protect crop yields and maximize nitrate-N reductions.
This is the typical starting point for CD management with most systems, but can be modified
based on field conditions determined by crop stage, soil and water conditions in the field, and
drainage system capacities.
Table 1.5. Guidelines for CD management in NC
OBJECTIVES
The main goal of this research is to quantify the effects of Drainage Water
Management (DWM) through Controlled Drainage (CD) on crop yields effects and water
quality over a wide range of weather conditions and cropping practices in North Carolina.
Specific objectives are:
1. Quantify the crop yield effects of CD in long-term field experiments for the
2. Quantify the effects of CD on drainage volumes, nitrate-N concentrations and
REFERENCES
Ale, S., L.C. Bowling, S.M. Brouder, J.R. Frankenberger, M.A. Youssef. (2009). Simulated effect of drainage water management operational strategy on hydrology and crop yield for Drummer soil in the Midwestern United States, Agric. Water Manage., 96, pp. 653–665
Allred, B. J., C. Thorton, G. A. La Barge, D. T. Riethman, B. J. Czartoski, P. W. Chester, N. R. Fausey, L. C. Brown, R. L. Cooper, G. L. Prill, and W. B. Clevenger. (2003). Water table management to enhance crop yields in a wetland reservoir subirrigation system. Appl. Eng. Agric. 19:407-421.
Cannell, R.O. and M. B. Jackson. (1981). Alleviating Aeration Stresses. In Modifying the root environment to reduce crop stress. G.F. Arkin and H.M. Taylors (ed.) ASAE Monograph., (p. 141-192). St. Joseph, MI.
Clayton, B.C., and L. A. Jones (1941). Controlled Drainage in the Northern Everglades of Florida. Agricultural Engineering 22 (August 22).
Clement, R.F. (1921). Aeration and air content. The role of oxygen in root activity. Carnegie Inst. Publ. 315. Carnegie Inst., Washington, DC.
Cornic, G. (2000). Drought stress inhibits photosynthesis by decreasing stomatal aperture: Not by affecting ATP synthesis. Trend Plant Sci. 5:187-188.
Denmead, O.T., and R.H. Shaw. (1960). The effect of soil moisture stress at different stages of growth on the development and yield of corn. Agron. J. 52:272-274.
Desmond, E.D., G.F. Barkle, and G.O. Schwab. (1985). Soybean yield response to excess water. ASAE Pap. No. 85-2562. ASAE, St. Joseph, MI: American Society of Agricultural and Biological Engineers.
Doering, E.J., L. C. Benz, and G. A. Reichman (1982). Shallow-Water-Table Concept for Drainage Design in Semiarid and Subhumid Regions. In Advances in Drainage Proceedings of the American Society of Agricultural Engineers Fourth National Drainage Symposium. ASAE Publication Number 12-82. St. Joseph, Michigan
Doss, B.D., R.W. Pearson, and H.T. Rogers. (1974). Effects of Soil Water Stress at Various Growth Stages on Soybean Yield. Agron J. 66:297-299.
Evans, R.O., and N.R. Fausey. (1999). Effects of inadequate drainage on crop growth and yield. Chapter II In: Agricultural Drainage. Agronomy Monograph no. 38., R. W. Skaggs and J. van Schilfgaarde, eds., ASA, CSSA, and SSSA, Madison, WI., p. 13-54
Evans, R.O., R.W. Skaggs, and R.E. Sneed. (1990). Normalized crop susceptibility factors for corn and soybeans to excess water stress. Trans. ASAE 33:1153-1161.
Fausey, N.R., K.W. King, B.J. Baker, and R.L. Cooper. (2004). Controlled drainage performance on Hoytville soil in Ohio. In Drainage VII Proceedings of the Eighth International Symposium, ed. R. Cooke, Sacramento, California, March 21-24, 2004. St. Joseph, MI: American, Society of Agricultural Engineers.
Fisher, M. J., N. R. Fausey, S. E. Subler, L. C. Brown, and P. M. Bierman. (1999). Water table management, nitrogen dynamics, and yields of corn and soybean. Soil Sci. Soc. Am. J. 63:1786-1795
Fouss, J.L., R. O. Evans, and H. W. Belcher. (1999a). Design of Controlled Drainage and Subirrigation Facilities for Water Table Management. In. Agricultural Drainage. Agronomy Monograph no. 38. R. W. Skaggs and J. van Schilfgaarde, eds., ASA, CSSA, and SSSA, Madison, WI., p. 719-742.
Gambrell, R.P., J.W. Gilliam, and S.B. Weed. (1975). Denitrification in subsoils of the North Carolina Coastal Plain as affected by soil drainage. J. Environ Qual. 4:311-316
Gilliam, J. W., J. L. Baker, and K. R. Reddy. (1999). Water quality effects of drainage in humid regions. In Agricultural Drainage. Agronomy Monograph no. 38., R. W. Skaggs and J. van Schilfgaarde, eds., ASA, CSSA, and SSSA., Madison, WI., p. 801-830
Glinski, J., and W. Stepniewski. (1985). Soil aeration and its role for plants. CRC Press, Inc., Boca Raton, Fl.
Grable, A.R. (1966). Soil aeration and plant growth. Adv. Agron. 18:57-106.
Hardjoamidjojo, S., R.W. Skaggs, G.O. Schwab. (1982). Corn Yield response to excessive soil water conditions. Trans. ASAE. 25:922-927, 934.
Helmers, M., Christianson, R., Brenneman, G., Lockett, D., Pederson, C., (2012). Water table, Drainage, and yield response to drainage water management in southeast Iowa., J. Soil Water Conserv. 67, 495–501.
Heritage, A.D. (1985). Temporary waterlogging, poor soil aeration and root susceptibility to fungal infection review. p. 1175-125. In W.A. Muirhead and E Humphreys (ed.) Root zone limitations to crop production on clay soils. Proc. Symp. Of the Australian Soc. Of Soil Sci. Inc., Riverina Branch, Griffith, NSW. 25-27 September 1984. CSIRO, Melbourne, Australia. CSIRO:117-125.
Hiler, E.A. (1969). Quantitative evaluation of crop drainage requirements. Trans. ASAE
12:499-505.
Hobbs, E.H., and H.H. Muendel. (1983). Water requirements of irrigated soybeans in southern Alberta. Can. J. Plant. Sci. 63: 855-860.
Jaynes, D.B. (2012). Changes in yield and nitrate losses from using drainage water management in central Iowa, United States. J. Soil Water Conserv. 67, 485–494.
Kanwar, R.S., J.L. Baker, S. Mukhtar. (1988) Excessive Soil Water Effects at Various Stages of Development on the Growth and Yield of Corn, Trans ASABE 31 (1):0133-0141.
Kowalik, P.J. (1985). Influence of land improvement on soil oxidation. Rep. 42. Swedish Univ. Agric. Sci., Uppsala.
Kozlowski, T.T. (ed.). (1984). Flooding and plant growth. Acad. Press, Inc., Orlando, FL.
Larson, Carl A., Viets, F. G., and Leamer, R.W. (1950). Field corn production on the Umatilla Irrigation Project. Oregon State College Station Bul. 480.
Mukhtar, S., J.L. Baker, and R.S. Kanwar. (1900a). Corn growth as affected by excess soil water. Trans. ASAE 33:437-442.
Patwardhan, A.S., J.L. Nieber, and I.D. Moore. (1988). Oxygen, carbon dioxide, and water transfer in soils: Mechanisms and crop response. Trans. ASAE 31:1383-1395.
Robins, J.S., and C.E. Domingo. (1953). Some effects of severe soil moisture deficits at specific growth stages of corn. Agron J. 45:12:618-621.
Russell, M.B. (1952). Soil aeration and plant growth.. In B.T. Shaw (ed.) Soil physical conditions and plant growth. Agron. Monogr. 2. ASA, Madison, WI. p. 253-301
Scott, H.D., J. DeAngulo, M.B. Daniels, and L.S. Wood. (1989). Flood duration effects on soybean growth and yield. Agron. J. 81:631-636.
Sionit, N., P.J. Kramer. (1977). Effects of water stress during different stages of growth on soybean. Agron. J. 69:274-278.
Singleton, H. P., et al. (1950) Soil, water, and crop management investigations in the Columbia Basin Project. State College of Washington Bul. 520.
Shaw, R.H. (1974). A weighted moisture-stress index for corn in Iowa. Iowa State Journal of Research. 49:10.
Skaggs, R.W. (1973). Water table movement during subirrigation. Trans. of the ASAE
16:988-993
Skaggs, R.W. and G.M. Chescheir III. (2003). Effects of subsurface drain depth on nitrogen losses from drained lands. Transactions of the ASAE 46(2): 237-244.
Skaggs, R.W., and J.W. Gilliam. (1981). Effect of drainage system design and operation on nitrate transport. Transactions of the ASAE 24(4):929-934.
Skaggs, R.W., G.L. Kriz, and R. Bernal. (1972) Irrigation through subsurface drains. L. Irrig. Drain. Div. 98:363-373.
Skaggs, R.W., M.A. Youssef, R.O. Evans, and J.W. Gilliam. (2010). Effect of controlled drainage on water and nitrogen balances in drained lands. Trans. ASABE 53(6): 1843-1850.
Skaggs, R.W., N.R. Fausey, and R.O. Evans. (2012). Drainage water management. J. Soil Water Conserv. 67, 167-172.
Sugimoto, H., Y. Koesmaryono, and R. Nakano. (2000). Effects of excess moisture in the soil at different stages of development on the growth and seed yield of soybean.
Pakistan Journal of Biological Sciences 3 (9): 1465-1467.
Tan, C.S., C.F. Drury, J.D. Gaynor, W.D. Reynolds, T.W. Welacky and T.Q. Zhang (2004). Effect of Water Table Management on Water Quality and Crop Yield at the Farm Scale Fields. ASAE Paper No. 042241 St. Joseph, Mich.: ASAE
Van Schilfgaarde, J. (1974). Drainage for agriculture. Agron.. Monogr. 17. ASA, Madison, WI.
Wesseling, J. (1974). Crop growth and wet soils. In J. van Schilfgaarde (ed.) Drainage for agriculture. Agron. Monogr. 17. ASA, Madison, WI. p. 39-90.
Wesseling, J., and W.R. van Wijk. (1957). Soil physical condition in relation to drain depth.
CHAPTER 2.
THE EFFECTS OF DRAINAGE WATER MANAGEMENT ON CROP YIELDS IN NORTH CAROLINA
Published:
Poole, C.A. R.W. Skaggs, G.M. Cheschier, M.A. Youssef, and C.R. Crozier. Effects of
drainage water management on crop yields in North Carolina. Journal of Soil and Water
Conservation. Nov/Dec 2013 vol 68, no 6, p. 429-437
ABSTRACT
Research studies on a wide range of soils, crops, locations, and climates have shown
that Drainage Water Management (DWM) (or Controlled Drainage, CD) can be used to
substantially reduce the loss of nitrogen (N), and in some cases, phosphorus (P) from drained
agricultural lands to surface waters. The adoption and widespread application of DWM
depends on a variety of factors including its impact on crop yields. This paper presents
results from a long term field study on the effect of DWM or CD on crop yields in a 3 crops
in 2 years corn/wheat-soybean rotation. Yields were measured on replicated field scale plots
under CD and conventional or Free Drainage (FD) treatments for a total of 18 crops on two
experimental sites during the period 1990 to 2011. Data were collected on 7 corn crops, 5
wheat crops and 6 soybean crops. Controlled drainage had no significant effect on yields of
winter wheat, which in North Carolina is grown in the wettest, coolest part of the year.
Controlled drainage increased corn yields compared to FD in all 7 years. The average yield
increase for corn was 11%. Controlled drainage also increased soybean yield in all years
application of drainage water management which will result in both economic and
environmental benefits.
Key words: drainage water management (DWM)—controlled drainage (CD)—yield— corn—soybean—wheat
INTRODUCTION
The primary purpose of agricultural drainage has historically been to increase crop
yields, profits, and the reliability of production. Improved or artificial drainage systems have been used for centuries (Luthin, 1957) to provide trafficable conditions for field
operations, remove excess water from the root zone, prevent crop yield reductions due to
oxygen deficiencies and associated stresses, and control soil salinity. These systems may
include improvements to surface drainage by land smoothing to fill potholes and provide an
outlet for surface runoff, and subsurface drainage by the installation of ditches or drain
tubes (clay, concrete, or plastic tubes or tile). Research since the 1970s has shown that
improved subsurface drainage has increased the loss of some potential contaminants,
particularly nitrogen (N), to surface waters while reducing the loss of others (Gilliam et al.,
1999). This has resulted in negative environmental impacts at both local and basin scales.
The most prominent example is in the Midwest, USA where N losses from subsurface
drained land is a primary source of N linked to the development of the hypoxic zone in the
Gulf of Mexico (Rablais et al., 2002; Burkhart and James, 1999; EPA-SAB, 2007). By the
of drainage design and management was well recognized by drainage scientists and
engineers (Skaggs, 1992).
Improved drainage continues to be needed to provide increased sustainable yields
to satisfy increasing global demand for food production. Federal conservation programs
have been established to reduce the loss of nutrients and other contaminants to surface and
ground waters. Drainage water management (DWM) has emerged as an effective method
of conserving water, increasing yields and reducing N and phosphorus (P) losses to the
environment. However the adoption of the practice is highly dependent on production
economics.
Drainage water management or controlled drainage (CD) is not a new practice. It
has been used to control soil subsidence and conserve drainage water in drained organic
soils in the Florida Everglades and other locations for many years (Clayton and Jones,
1941; Stevens, 1955). Studies in North Carolina during the 1970s (Skaggs et al., 1972;
Skaggs, 1973; Doty et al., 1975) showed that water table control practices could be applied
to a wide variety of soils if design parameters were fitted to soil and site conditions.
Gilliam et al. (1999) reviewed research on the effect of DWM on drainage water quality.
More recently Skaggs et al. (2010) reviewed results of studies on the effects of N losses to
surface waters. Early research in NC (Gilliam et al., 1979; Evans et al., 1995) showed that
CD reduced nitrate-N losses by 40% to 50%, and P losses by 25% to 35% compared to
conventional free drainage. Similar findings have been confirmed at other locations
(Lalonde et al., 1996; Tan et al., 1998; Fausey, 2005; Wesstrom and Messing, 2007; Drury
that DWM had been reported to reduce N losses in drainage waters by 17 to over 80% and
discussed the mechanisms controlling the effectiveness of the practice and how soil
properties, drainage intensity, and site conditions affect its performance.
Because DWM has been referred to as CD in North Carolina since the 1970s, we
will use that term in this paper. CD is implemented by using a water control structure to
control the outlet water level elevation. A typical water control structure used for CD in an
open ditch is shown in Figure 2.1. A similar in-line system is used in drain tube
applications (not shown). When boards are added, the water level in the drain rises during
wet periods and the subsurface drainage rate is decreased. Conversely, when boards are
removed, the subsurface drainage rate increases to that of conventional or free drainage
(FD). Proper management of the system is required to achieve maximum water quality and
crop yield benefits.
CD reduces N losses in drainage waters by three fundamental mechanisms: (1) it
reduces subsurface drainage volumes, which is the principal pathway of N losses from
drained soils; (2) it increases denitrification by increasing the anaerobic zone in the soil
profile; and (3) it conserves water, reduces deficit soil water stresses, and increases yields
resulting in more N removed from the field with the harvested crop and less available for
loss in the drainage water.
Drained agricultural lands make up about 40% of North Carolina's cropland. The
lands are primarily located in the coastal plain in the eastern and southeastern parts of the
state. Controlled drainage has been employed in these areas to reduce losses of N and P to
surface waters (Gilliam et al., 1999; Evans et al., 1995). Controlled drainage was accepted
in the mid-1980s as a Best Management Practice (BMP) for reducing nutrient losses in
drainage waters with the control structures cost shared by the state of North Carolina at the
rate of 75% (state) to 25% (farmer). The practice is now eligible for cost share under the
USDA EQIP program, as well as from North Carolina through the N.C. Division of Soil
and Water Conservation (DSWC). Since the first cost share contracts were issued in 1984,
over 4,000 water control structures affecting about 160,000 ha (400,000 acres) have been
installed in the state (Evans and Skaggs, 2004). Controlled drainage is one of the most
effective BMPs for reducing N and P losses from drained agricultural lands in North
Carolina.
The driving force behind the adoption of the practice in NC has been the state and
federal cost-share incentives for installation of the practice with the primary goal of reducing
research concentrated on the effectiveness of the practice in reducing N and P loads to
receiving waters. Effects on yields were observed in some studies, but few replicated field
experiments were conducted. Evans and Skaggs (1985) found that water conserved by CD
substantially increased yields in some years but had only minor impacts in others. General
guidelines to producers indicated that, properly managed, CD could be expected to increase
yields by an average of about 5%, but the emphasis was on management for reduction of N
and P losses to surface waters. Tan et al. (2004) showed that a combination controlled
drainage-subirrigation system reduced nitrate loss by 38% and increased corn yields by 64%
in a sandy loam soil in Ontario, Canada. However, subirrigation requires a water supply and
associated pumps and controls. The most common mode of DWM is CD which conserves
drainage water but does not provide irrigation during long dry periods. Controlled drainage
conserves water that would otherwise drain out of the soil profile. This may be expected to
increase yields, but its effectiveness depends on when rainfall and drainage events occur,
plant growth stage, and weather conditions following those events. Crop yield effects of
water conservation resulting from CD in North Carolina have not been fully studied. This
paper presents data on the effect of controlled drainage on yields of corn (Zea mays L.), soft
red winter wheat (Triticum aestivum L.), and soybean (Glycine max L.) collected from two
experimental research sites in North Carolina during the period 1990 through 2011.
MATERIAL AND METHODS
Data were collected from two study sites to determine effects of CD on crop yields
drained with 10 cm (4-in) diameter corrugated subsurface drain tubing, and Site 2 (BATH),
located near Bath, NC, is drained with parallel open ditches. Locations of the sites are shown
in Figure 2.2.
Figure 2.2. General layout of the Tidewater Research Station experimental site near Plymouth, NC and site locations in NC.
Site 1- TRS
The response of crop yields to CD was evaluated using data collected between (1990
and September 2011) from TRS. The site is a 13.8-ha (34.1 ac) agricultural field divided into
eight experimental plots, four of which were used in this study (Figure 2.2).
Soil on the site is classified as Portsmouth sandy loam (Typic Umbraquult;
fine-loamy, siliceous, thermic), which is very poorly drained under natural conditions. The site
has nearly flat topography and is bounded on all four sides by drainage ditches,
approximately 2.0 m (6.6 ft) deep. There are two different drainage systems installed at the
and 1.0 m (3.3 ft) deep. The original system was closed at the end of 1990 and a second
system was installed and used in subsequent years. That system consisted of parallel drains
23 m (75 ft) apart and 1.2 m (4.0 ft) deep. Center drain lines were used for experimental
purposes. The function of the guard lines on each side is to hydraulically isolate the area
drained by the center drain line from the influence of adjacent experimental plots. The
subsurface drains of each experimental plot discharge to receiving tanks installed in an
instrument house. Each plot has two 100 mm (4 in) diameter water table monitoring wells
equipped with automatic recorders and data loggers programmed to measure and record
water table depth at a one hour interval. Tipping bucket and manual rain gauges were
installed at the site to continuously measure and record precipitation.
Plots 2-5, which were used in this study, were managed in either FD or CD. In FD,
pump controls were set to keep the water level in receiving tanks below the elevation of the
subsurface drains. In CD, water was pumped out of the receiving tank when the outlet water
level in the tank exceeded a preset control elevation which, except for periods of seedbed
preparation, planting and harvest, was higher than the elevation of the subsurface drains. The
control elevation represents the weir elevation in a conventional drainage water management
structure. No water was pumped into the system.
Crop yields were determined for each plot at the end of each growing season. Grain
yield was determined by harvesting 2 subplots located 6 m (20 ft) on either side of the center
drain line. Generally, the corn harvest areas were 1.8 m (6 ft) wide by 23 m (75 ft) long.
were collected from plots 2-5 on this site from 1990 through September 2011. The impact of
CD on yields was determined on 14 crops during this period at TRS.
Wheat was not harvested in 2010 due to wet planting conditions and poor emergence
on all plots in the fall of 2009. A power outage during tropical storm Nicole in October 2010
resulted in complete submergence of some of the plots for a prolonged period and other plots
for a shorter period. It confounded results for soybean that year which were omitted from the
analysis.
Site 2-BATH
The (BATH) site consists of 24 ha (60 ac) in northeastern Beaufort county near Bath,
North Carolina. The soil is also Portsmouth sandy loam, (Typic Umbraquult; fine-loamy,
siliceous, thermic). The site originally had irregular spaced lateral ditches with relatively
poor surface drainage. In December 2007, all interior ditches were filled and replaced with
parallel ditches 60 m (197 ft) apart. Surface leveling was required to facilitate surface
drainage to the new ditches and permit efficient production.
The drainage water management model DRAINMOD 6.0 (Skaggs 1978; Youssef et
al. 2005; Skaggs et al. 2012), was utilized to predict the effects of surface grading, ditch
depth, and spacing on crop yields and N losses for a typical Portsmouth soil. Decision
parameters used to determine proposed ditch spacing on the site included crop yield,
trafficability, and machine efficiency. Machinery for farming practices at the site was 7.3 m
(24 ft) wide. In order to have an even number of passes in each plot, ditch spacing needed to
be a multiple of 14.6 m (48 ft). Simulated crop yields for ditch depths varying from 0.61 to
m (197 ft). A spacing of 60 m (197 ft), which allows for a 1.5 m (5 ft) wide ditch, was
selected because it was both efficient for the producer and sufficient for draining the site.
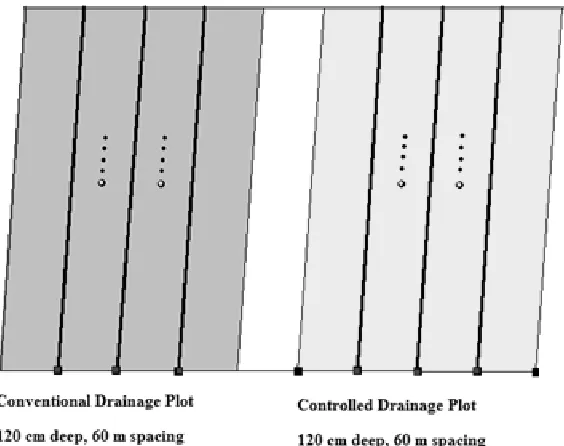
The field site (Figure 2.3) was divided into 2 separate blocks consisting of
approximately 12 ha (30 ac) each. The blocks were isolated from one another by leaving a
2.4 ha (5.9 ac) plot between the treatments. Each block is drained by five lateral ditches with
the exception of the FD treatment, which is drained with 4 lateral ditches and a subsurface
drainage line. The subsurface line was used in place of an open ditch at the western edge of
the field to provide more efficient operating conditions and convenient access to the field.
The west block was operated in conventional FD mode with 1.07 m (3.5 ft) deep lateral
ditches. The eastern block was operated in CD mode with 1.07 m deep (3.5 ft) lateral ditches
managed using flashboard risers with the exception of the wheat crop in 2009 which was
managed in free drainage for ditch bank stabilization purposes. The land drained by each of
the three inner ditches in each block was treated as a field scale experimental plot, giving
three replications for each treatment. The two outer ditches in each block served as guard
drains to hydraulically isolate the area drained by the three inner drains from the influence of
the adjacent block.
The FD and CD blocks were surface leveled (field crowning and land smoothing) by
practices that are standard in the area. Box-blades and land planes are typically used in the
NC coastal plain to do this type of surface grading and are typically not laser controlled.
This results in approximately a 7.6 cm-15 cm (3 to 6 in) surface crown with some shallow
Water table elevations at two locations per block were continuously monitored in
wells equipped with automatic recorders and data loggers. Eight flashboard risers were
installed at the site. Three risers were used on the FD system and five on the CD system.
Risers on the center-lines of each plot were used for drain flow monitoring. Weirs were
installed and used to measure flow after March 2009. Precipitation data were collected with
automatic tipping bucket and manual rain gauges at the site.
Crop yield was determined for each plot by harvesting and mapping the yield on the
whole plot with a calibrated yield monitoring system. Crop samples were collected to
determine grain moisture and test weights. Yield data from 4 crops were collected from April
2008 through June 2011 from the BATH site. Controlled drainage was not applied to the
wheat crop of 2009/2010; the site was managed in free drainage mode in all plots during that
Figure 2.3. General layout of the Bath open-ditch experimental site near Bath, NC.
The crop rotation on both study sites consisted of three crops in two years: corn, year
1; wheat, year 1-2; and soybean, year 2. This cropping sequence is common on farmlands of
the North Carolina lower coastal plain (Chescheir et al., 1996). Corn, the first crop in the
rotation, was planted in April and harvested in late August to early September. Wheat was
then planted in mid-November and harvested in early June of the following year. Soybean
fallow after soybean harvest until April of the following year when corn was planted and the
rotation repeated.
Both conventional tillage and no-till practices were implemented on the sites at
different times during the observation period. The tillage treatment remained consistent
across the plots in any given year. Corn and wheat were grown under both practices.
Soybean was grown using no-till only.
Nitrogen fertilization followed common practices in the region with one exception for
experimental reasons. Two N fertilization rates were used during 1998 as part of an
experiment to study the effect of N fertilization on crop yield and N leaching losses at (TRS).
The two rates were used for both drainage treatments which allowed the use of the yield data
in this study. Lime application rates followed soil test report recommendations (Chescheir et
al., 1996).
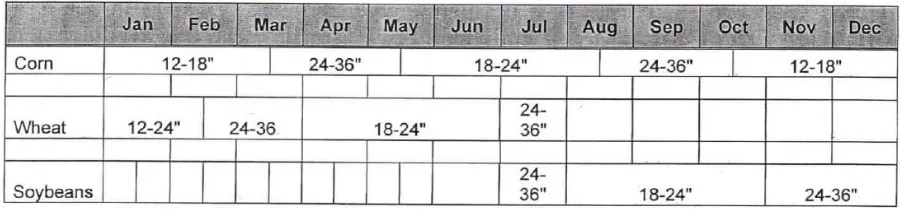
Controlled drainage settings from the surface varied slightly during the study. During
1990, 1991, and 1994 the control elevations were set to 30 cm (1 ft) from the surface. In all
other seasons, the CD control settings were either 45 or 50 cm (1.5 ft) from the surface (table
2.1). Adjustments to the control levels were made based on site conditions, crops to be
grown, and scheduling of necessary field operations. Controlled drainage control settings
were adjusted to FD occasionally to facilitate planting and harvesting operations, or during
wet periods.
The crop yield data were paired by year and location, and analyzed with a paired
variability in climate, soils, tillage, varieties, and the drainage systems that existed at the TRS
and BATH sites.
RESULTS AND DISCUSSION
Annual crop yields and associated data are summarized in Table 2.1 for all crops,
years and locations. Yield data were collected on field plots under CD and FD on a total of
18 crops over the period 1990-2011. Results from each treatment were grouped by crop and
paired by year. Controlled drainage significantly increased corn yield (p= 0.01). Yields in
the CD plots were higher than in the plots under FD in every year during the study with
increases of greater than 10% in 3 out of the 7 years of observation. During 1993 and 2010
corn yields on CD plots were increased by more than 20% compared to FD. On average
across all years at both locations, CD increased corn yield by 11%.
Analysis of data for wheat yields indicated that CD did not significantly affect yield
for this crop (p=0.22). Wheat yields were higher on the CD treatment for only two of five
crop years, 1.6% in 1990 and a 0.7% increase in 1992. Wheat yields were lower on the CD
plots in 1998, 2008, and 2011 by 11.1%, 1.9%, and 3.1%, respectively. The lack of response
for wheat is not unexpected as it is grown in the coolest, wettest part of the year (Nov.-June)
when gains due to water conservation in some periods are potentially offset with losses due
Table 2.1. Measured crop yields for conventional free drainage (FD) and controlled drainage (CD) for three crops on two sites in North Carolina.
Analysis of the yield data for soybean indicated that CD significantly increased yields
for that crop (p=0.008). The soybean yields in CD plots were greater than FD in all six years
observed with the highest increase of 20% in 1990. On average, CD increased soybean yield
by 10%. Water table data were available for 15 of the 18 crop/years. Analysis of the data by
production year using a paired two sample t-test for the means showed that the water table
plots than in FD plots) (p=0.006), over all crop seasons. When the data were grouped by
crop and paired by year, results showed that the water table depth was significantly less in
the CD plots for wheat (p=0.1), and for soybean (p=0.08), compared to the respective FD
plots. Controlled drainage reduced the average water table depth by 8.5 cm (3.3 in) for
wheat and by 8.5 cm (3.3 in) for soybean. Average water table depths under CD were 6.5 cm
(2.6 in) less than FD for corn, but the difference was not statistically significant (p=0.25).
Depending on the crop and year, outlet elevations in the CD treatments were set 30 to 50 cm
below the soil surface (Table 2.1). The drains were 107 to 120 cm deep, so CD resulted in a
substantial decrease in the effective drain depth during the treatment period. Thus the
relatively small effect of CD on water table depth may at first seem unusual. Measured water
table depth is plotted for the 1993 corn growing season in Figure 2.4 and for the 1994
growing season in Figure 2.5. Results plotted in Figures 2.4 show that the water tables in
both CD and FD plots were below the drain depth, and hence unaffected by drainage
treatment for relatively long dry periods in 1993. Similar results were obtained in most other
years (not shown). Controlled drainage does have an effect on water table depth during
wetter periods (e.g., days 140-160 in 1993) as expected. However, the nearly negligible
impact of CD during dry periods causes its effect on average water table depth to be
relatively small in most years. The effect was larger during wet growing seasons such as
1994 (Figure 2.5). Rainfall during the 1994 growing season was above average (Table 2.1
and Figure 2.6) and drainage from the FD plots occurred during most of the time. Controlled
drainage, with outlet weirs set at a depth of 30 cm, decreased subsurface drainage by 14.3