ABSTRACT
SNIPES, WILLIAM BAYLOR. Evaluating Developer Responses to Gamification of Software Development Practices. (Under the direction of Dr. Emerson Murphy-Hill.)
As software development practices evolve, toolsmiths face the continuous challenge of get-ting developers to adopt new practices and tools. We tested an idea with industrial software
developers that adding game-like feedback to the development environment would improve
adoption of tools and practices for code navigation. We present results from a pre-study survey of 130 developers’ opinions on gamification and motivation, usage data from a study with an
intact team of six developers of a game on code navigation practices, and feedback collected
in post-pilot interviews. Our pre-study survey showed that most developers were interested in gamification, though some have strong negative opinions. Study results show that two of the
c
Copyright 2014 by William Baylor Snipes
Evaluating Developer Responses to Gamification of Software Development Practices
by
William Baylor Snipes
A thesis submitted to the Graduate Faculty of North Carolina State University
in partial fulfillment of the requirements for the Degree of
Master of Science
Computer Science
Raleigh, North Carolina
2014
APPROVED BY:
Dr. Mladden A. Vouk Dr. David Roberts
DEDICATION
To my loving wife Suzanne. You create a meaningful life in each day that passes perhaps without note otherwise.
BIOGRAPHY
Will Snipes is a Principle Scientist in ABB Corporate Research for Industrial Software Sys-tems. Will has worked as a practitioner of software engineering for 20 years and contributed
to published works in Software Engineering conferences and journals. His current research area is applying alternative methods such as games and personal metrics to motivate developers
towards adopting new tools and practices. Prior work includes defining global software
engi-neering metrics reporting requirements and reporting results from prediction models for software defects and fault-prone code. Will led the development of global verification and validation
pro-cesses at Nortel and served as the lead analyst for software reliability prediction and software
ACKNOWLEDGEMENTS
There are so many people who contributed to making this thesis a reality that I will surely miss your perhaps momentary but lasting contribution to the development of this student.
To my advisor, Dr. Emerson Murphy-Hill, I am eternally grateful for the chance you gave me to complete this work.
Though we are separated by distance, I am grateful for the steadfast support of my partner
Dr. Anil R. Nair at ABB Corporate Research in India who made the realization of this study possible.
Thank you to Balaji W and your team for participating in the pilot of the Blaze tool.
Thank you, Dr. Vinay Augustine for your help and feedback.
Thank you, Dr. David Shepherd for your leadership in the development and deployment of
this work.
Thank you, Andy Cordes for your enduring patience and kindness through this time of personal growth.
Thank you, Patrick Francis for your help and feedback.
Thank you, Dr. Brian Robinson and Dr. Laurie Williams for believing that I could grow. Thank you, Dr. Mladen Vouk for your gracious kindness and leadership.
Thank you, Dr. David Roberts for being willing to serve on my committee.
Thank you to my ABB colleagues locally and around the world for your kindness and encouragement.
Thank you to Ram Chillarege and the people of ISSRE who planted a seed and allowed it
to grow.
Thank you to the RealSearch team for the open door and opportunity to serve.
Thank you to the Developer Liberation Front team for being there at the right time with
the right thing to say.
Thank you John Hudepohl, for your continuous openness, kindness, and friendship of the
past 20 years.
Thank you to my family and extended family for your love and encouragement. Thank you Mom, for your love and having an open ear through all these years.
TABLE OF CONTENTS
LIST OF FIGURES . . . vi
Chapter 1 Introduction . . . 1
1.1 Introduction . . . 1
1.2 Related Work . . . 2
1.2.1 Monitoring Practice Studies . . . 2
1.2.2 Gamification . . . 3
Chapter 2 Assessment of Developers Views on Motivation and Gamification . 5 2.1 Pre-study Background . . . 5
2.2 Pre-study Survey Results . . . 5
Chapter 3 Tool and Study Design . . . 10
3.1 Game Design . . . 10
3.1.1 Select a Practice . . . 10
3.1.2 Design the Game . . . 11
3.2 Tool Design . . . 12
3.3 Study Design . . . 13
3.3.1 Tool Feature Staging . . . 13
3.3.2 Study Participants . . . 14
3.3.3 Post Study Survey . . . 15
Chapter 4 Results and Conclusions . . . 16
4.1 Post-Study Survey Results . . . 16
4.2 Study Data Observations . . . 18
4.2.1 Observations About Drivers of Edit Session Duration . . . 18
4.2.2 Observations on Navigation Ratio . . . 18
4.2.3 Observations on Points . . . 20
4.2.4 Developer Feedback Discussions . . . 20
4.3 Threats to Validity . . . 22
4.4 Conclusions . . . 23
LIST OF FIGURES
Figure 2.1 Acceptance of gamification . . . 7
Figure 2.2 Comfort with sharing usage information . . . 8
Figure 2.3 Motivation for using tools and practices . . . 9
Figure 3.1 Blaze Tool Window . . . 14
Figure 4.1 Influence of Feedback Elements . . . 17
Figure 4.2 Navigation Ratio by Week . . . 19
Figure 4.3 Average Points per Day by Week . . . 21
Chapter 1
Introduction
1.1
Introduction
Sascha is a hypothetical developer with years of software development experience who knows how to maintain code fairly well. Sascha heard about navigation tools, but kept using familiar
commands and browsing mainly out of habit. When Sascha’s company started a game around
code navigation in Visual Studio, he became interested in being a part of the fun. Sascha tried the code navigation tools and practices that were part of the game and soon found himself at
the top of the game’s leaderboard. After learning the new practices Sascha spends less time
navigating code to accomplish his maintenance tasks.
Like Sascha, software developers who maintain code face challenges navigating an existing
code base to incorporate changes as they build new features or fix bugs. Toolsmiths respond to
these challenges by creating new tools for assisting developers through difficult activities like code navigation. However, as new practices and tools become available, developers may not be
motivated to start using them unless they interact with a peer developer who promotes them [17]. Of course, they are intrinsically motivated to improve, but urgent demands interfere with
experimenting using new tools and they become less efficient than otherwise possible. Thus, we
need to both communicate with and motivate developers like Sascha to start using new tools. One option for motivating people to adopt new practices is to apply elements of game
me-chanics or “gamify” the practice. Gamification is the incorporation of game elements into an
activity that people do not typically consider a game[1]. Prior work envisioned a tool that would motivate developers by providing constant feedback and allowing them to compare their
im-provements to how their peers are doing [24]. This tool, now called Blaze, creates a competitive
game with continuous feedback on how well the developer adopts the improved practice. The more they change their practices to adopt new techniques or tools, the higher they score in the
This thesis hypothesizes that gamifying software developers’ practices such as structured
navigation will influence developers to change their practices. This work contributes an assess-ment of developers’ responses to game-like eleassess-ments tied to their use of new tools and practices. I
assessed 130 developers’ responses and relevant concerns about the idea of gamification through
a web-based survey. I developed a tool called Blaze that introduces game elements focused on improving navigation practices into Visual Studio. I conducted a study using Blaze to determine
the influence of and developers’ reactions to gamification. Reactions were mostly positive with
a few detractors, and results of the study show that game elements influence some developers to try new practices, but have no effect on others’ use of tools and practices.
1.2
Related Work
The two areas of related work are research studies using other monitoring methods and studies
applying gamification to other areas.
1.2.1 Monitoring Practice Studies
Robillard, Coelho and Murphy explore hypotheses around how developers can be more effective at performing a maintenance task [19]. Robillard et al. say developers are more successful finding
and fixing bugs when they create a detailed plan for implementing a change, use structured
navigation with keyword search or cross-reference search, and only review methods once during their search. I build on their work by testing methods for increasing the use of structured
navigation in developers’ everyday practice.
Johnson and Kou defined Zorro [10], a system for detecting whether developers use Test Driven Development techniques based on data from Hackystat, a monitoring framework
de-veloped by Johnson. Zorro divides development activities into episodes delimited by events such as configuration management code check-in, start of a unit test run, or start of a build.
Using the distinct events developers follow within these episodes, Zorro determines whether
the episode followed Test-Driven Development (TDD) practices in their prescribed order or a different scenario. In two student-based studies comparing Zorro classifications with a
simulta-neous observational screen video, Zorro achieved between 70% [11] and 89% [10] accuracy when
classifying episodes into their proper TDD scenarios. The studies did not, however, attempt to use or evaluate the influence of instant feedback aimed at encouraging participants to follow the
classic definition of Test Driven Development. This study attempts to present data collected
directly to developers in order to influence them to change their practices.
Murphy-Hill, Parnin, and Black [15] use the Mylyn Monitor and other tools to explore
for specific refactoring commands in Eclipse and determine the amount of time developers use
tools versus hand refactoring the code. This study focuses on developers use of commands in Visual Studio that allow them to navigate the code project.
The Pro Metrics (PROM) tool provides a framework for collecting data for further analysis
from tools used by developers. [4] It provides a flexible data model and a plug-in architecture to facilitate collection from different data sources. Studies conducted using PROM include a series
of studies on trends in time spent Pair Programming [5], benefits of refactoring on productivity
[13], impact of refactoring on re-usability [14], and prediction of effort [2]. Studies using the PROM tool correlate the time spent editing with code metrics obtained through source code
analysis. Applying these data to specific research questions ,such as whether refactoring
im-proves productivity [13], shows the utility of combining automated effort data with code metric data. Taking a different focus on techniques, this study uses more detailed events captured from
the Integrated Development Environment to detect commands the uses to navigating through
the code in addition to knowing duration of edit sessions for code modules.
Murphy-Hill et al. study a large usage history data set and apply several different
algo-rithms to accurately suggest Integrated Development Environment commands to novice users
[16]. Algorithms based on command history performed well particularly when synchronized chronologically with the recipient’s usage history. Novice users were better served by
recom-mendation algorithms that did not require a long history, while more expert users benefited from more sophisticated algorithms that included more history. The “Most Widely Used” algorithm
recommends commands based on the collective usage profile of the team and performed nearly
as well as the more sophisticated algorithms. The paper presents the methodology for making recommendations and evaluating their accuracy. This work takes a further step evaluating how
to get users to change their practices by gamifying the use of recommended practices and tools.
1.2.2 Gamification
When discussing gamification, folks raise a concern about replacing an activity like software development, which is intrinsically motivated, with extrinsic motivation provided by points and
achievements. To discover what is behind this concern, I reviewed several studies on motivation
and gamification.
Beecham and colleagues provide a thorough analysis of existing literature on studies of
moti-vation in Software Engineering [3]. They claim that the most common motivator found in cited
references is “the work”. The list of de-motivators is also useful with common job satisfaction items like stress and inequity in recognition, plus poor quality software (low accomplishment)
new challenges.
Maehr proposes an affirmative theory whereby individuals achieve as a member of a social group, choosing the behavior that meets the expectations and values of the group that is
significant to them [12]. A key factor in raising achievement motivation is establishing a social
group where the person is motivated to belong and excel. Maehr states that since achievement behaviors can be triggered by circumstance, they are present in most people regardless of
background.
Hamari et al. analyze achievement patterns in game systems and provide guidance on defin-ing successful achievement systems [8]. They recommend achievement awards be setup as a
secondary form of scoring so players have multiple objectives available for a particular game.
Players should feel like they earned achievements in the game; they should not be given for trivial tasks.
Singer and Schneider demonstrate the use of a message board and points for encouraging
students to increase their frequency of commits to the source code repository [23]. The commu-nication mechanism enabled students to see each others’ progress and resulted in more frequent
commits than baseline. Participants valued the communication and collaboration aspect and
some valued the competition enough to change their opinion on optimum commit frequency. The subsequent thesis by Singer [22] describes results of an experiment conducted across two
iterations of a class where active feedback on commits was deployed to one course and another course served as the control group where commit frequency was simply monitored. Results show
an increase in the frequency of commits at a statistically significant level. This study looks at
more detailed data of the actions performed by the developer such as structured navigation that take place between commits.
Dubois and Tamburrelli discuss theoretical concepts behind applying gamification to
soft-ware development [6]. Their approach is to consider how gamification could be applied through-out the software development life-cycle to motivate many practices in different phases. They
provide guidance on assessing gamification in the software development domain including
an-alyzing the actors and game mechanics, defining integration with existing tools and processes, and designing the evaluation of results. Dubois and Tamburrelli demonstrate this guidance
us-ing a study of students workus-ing on a class project. Definus-ing a control group and subject group
of students, both groups receive the same feedback about their code comments, test coverage, code size, and static analysis rule violations. The subject group can see each others’ rankings
while the control group only sees their personal rankings. Results, though not significant, show
Chapter 2
Assessment of Developers Views on
Motivation and Gamification
2.1
Pre-study Background
Being concerned with how developers would respond to gamification of their development tools,
I created an assessment survey questionnaire to determine whether the developer community would be receptive to a gamification approach to software development. I presented the survey
to developers at ABB Inc, my employer an industrial engineering and equipment company,
using a randomly selected email list of 2000 recipients. Over 130 software developers at ABB completed the questionnaire.
2.2
Pre-study Survey Results
A consulting firm, Saatchi and Saatchi, conducted a survey on Gamification that is often cited in
Gamification initiatives. A key question from this survey [20] relates to how interested workers
are in a gamified worplace. I reused the question as directly as possible substituting “software engineering tools” for their general “work” term. I asked developers at ABB “How interested
they would be in working for a company that incorporated some aspects of games into software
engineering tools as a way to increase productivity in the workplace”? I segmented results by country in Figure 2.1 and found gamification of software engineering is more interesting to
developers in India, Poland, and Finland than in other major countries. The responses indicate
74% of developers overall are at least somewhat interested in applying games to their work. Comments from participants reflected a more interesting controversial reaction than these
measurements might otherwise indicate. A developer from India said “Gamification is a juvenile
a concern that “Gamification of best practices can have nasty side effects,” although no specific
side effects were mentioned. Another participant said “there is already high a level of compe-tition between software development teams.” indicating they are under considerable pressured
to get the work done. Another developer reacted with a statement that identifies the kind of
intrinsic motivation we all hope for “I am using practices and tools because I want to do my job well’,’ indicating that gamification was unnecessary to motivate people to improve.
On the positive side, a developer from Poland said, “In a previous work place we had a
game between developers - scoring broken/unbroken builds and new/passed/failed tests. It was helping to improve quality and it worked well. [It is] recommended especially for junior
developers. ” Other comments indicated competition or points are acceptable “as long as it
doesn’t interrupt or slow down my work. ”
Because I nearly identically reused their original question, I compare the overall response
from the survey to the Saatchi and Saatchi survey[20] upon which this question was based. For
the survey, 74% of respondents were at least somewhat interested in gamification, which is very close to the 75% average reported by the Saatchi and Saatchi study.
I asked developers how likely they would be to try tools and practices recommended to them
through an automated usage tracking system. Answers showed 95% of the developers surveyed are likely to try the recommended tools and practices. Thus, a recommendation system would
positively impact the deployment of software engineering tools and practices at ABB.
Another question was whether sharing detailed usage information with colleagues and the
company as a whole would be a concern for developers. The question provided a graduated scale
for the scope of who data was shared with and divided the questions between whether sharing was anonymous or not. Figure 2.2 shows over 90% of respondents are comfortable with sharing
either anonymous or non-anonymous information with their team members. Their comfort level
decreases as the scope of who the information is shared with increases. Developers were less comfortable sharing with anyone (the category for people outside ABB) particularly if the data
was not kept anonymous. The first conclusion from these questions on sharing data is that
people are very willing to share information that could help their team. Second, sharing within the company is acceptable if I take care to make the data anonymous.
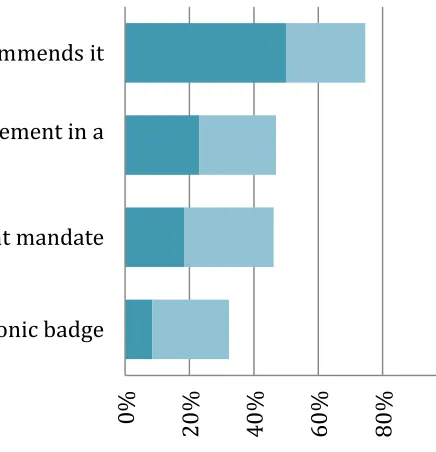
I asked developers what would motivate them to use tools and practices and gave them four
choices to rank. In Figure 2.3, we see that 75% of respondents ranked coworker recommendation in 1st or 2nd place. Of several comments, a developer in Sweden captured the following scene,
“[The] most motivating [thing] is when a new practice / tool is discussed during a continuous
improvement meeting or even coffee break, where one co-developer tells about the benefits and there is a joint discussion on where it (tool or practice) could be best applied.”
The team goal ranked second behind coworker recommendation. This response indicated
0% 20% 40% 60% 80% 100% India
Poland Finland Switzerland United States Sweden
Interest in Working for a Company That Uses Gamification
Extremely Interested Very Interested Somewhat Interested Not Very Interested Not Interested at All
Figure 2.1: Acceptance of gamification
a competion between development teams at ABB. The result shows that advancing their team
team in a competition would be first or second on the list for 47% of developers to motivate
their use of practices or tools.
Just behind team competition is management mandate where developers would be asked
to follow specific practices by the organization. The lowest was having badges posted on their
social network profile where 32% ranked this in 1st or 2nd place. Badges and management mandate received the most negative written comments in the survey. A developer from the
United States captured the lower opinion of badges that several participants expressed “I am
motivated because ABB allows me to choose the tools that best work for me. A badge will not really do anything for me.”
The answers on this question influenced the design of the game towards providing
compet-itive elements in the form of a leaderboard where developers could see their performance in relationship to other developers on their team.
0% 20% 40% 60% 80% 100% Anonymous
Non-Anonymous
Comfort with Sharing Data
Anyone My Company My Team Selected People Nobody
Figure 2.2: Comfort with sharing usage information
for. Overall 68% of developers ranked receiving an award for consistently performing quality
practices as either 1st or 2nd place. Thus, providing awards to developers for using good prac-tices would motivate developers to do them consistently.
To summarize, the high-level conclusions from each key question are:
• 95 percent of developers responding would try tools and practices suggested by an
auto-mated recommendation system
• Developers are motivated by collaboration and team goals more than mandates and
in-dividual awards
• Awards for good quality development practices ranked highest
• Over 90% of respondents approved of sharing data with their team members
Thus, this pre-study survey provided a positive indicator for going forward with a software
engineering tool focused on sharing developer data and rewarding developers for using good
0% 20% 40% 60% 80%
10
0%
I received an electronic badge There is a management mandate Elevated team’s achievement in a
game
A coworker recommends it
Ranking of Motivation for Using Tools and Practices
1st place 2nd place
Chapter 3
Tool and Study Design
The pstudy response to the first question confirmed that a majority of developers are re-ceptive to incorporating game elements in their work. The next steps were to select a practice
to create a game around and design the game elements to implement. Then build a tool that
deploys the practice as a game. Finally conduct a study with a small team using the tool.
3.1
Game Design
3.1.1 Select a Practice
I defined the first criteria for selecting a practice based on prior work applying gamification to
other domains outside software development. In their paper on game design patterns, Hamari et al.stated that assigning achievements to required tasks reduces intrinsic motivation because
player autonomy is reduced by the achievements [8]. Thus I avoided selecting practices like bug fixing or task completion because they are simply requirements of the job.
Another criteria imposed by the instrument limits us to practices performed entirely in
the IDE so they can be monitored using Blaze. I identified potential practices of test-driven development, debugging practices, navigation practices, eliminating static analysis bugs, and
frequent Configuration Management submissions.
Frequent Configuration Management submission and static analysis bug elimination are highlighted in this paper’s related work section with prior gamification studies in classroom
environments. Johnson and Kou achieved automated monitoring of test-driven development
practices with Zorro [10] thus may provide a candidate for future gamification application. Debugging practices have developer community opinions on optimal methods, however, detailed
debug practices with modern IDEs have not received research community attention, thus are
also reserved for future work.
a practice more effective developers use when maintaining programs. Structured navigation fits
the requirements of a practice contained in the IDE, shows benefits, lends itself to measurement and scoring, is not an assigned task, and leaves room for developers to excel. Thus I selected
structured navigation as the practice to demonstrate gamification.
3.1.2 Design the Game
To setup the game, the Blaze tool provides an XML configuration file where the researcher can
configure Blaze to categorize and assign points to the commands that are part of a software
engineering practice. Blaze allows the researcher to define multiple command category levels. Thus I categorized commands as navigation then further classify them into structured and
unstructured navigation.
To evaluate whether developers improved their practices for structured navigation, I es-tablished a metric, Navigation ratio, as the number as the number of structured navigation
events in a session or period of time over the number of unstructured navigation events. My hypothesis is that instant feedback from points combined with game information would result
in an increase in the navigation ratio for developers in the study.
Structured navigation events included:
• Navigate To (Ctrl+,) is a fuzzy search interface that lists identifiers matching the selected
string
• Go To Definition (F12) brings up the code that defines the selected identifier
• View Call Hierarchy (Ctrl+K Ctrl+T) provides a two way analysis of an identifier’s
dependencies and uses
• Class View (Ctrl+W, C) provides a browser and search function for classes and class
hierarchy
• Find All References (Ctrl+K,R) provides a list of lines that reference an identifier
• Navigate to Event Handler in the XAML editor shows the event handler for an object
• View Class Diagram generates a class diagram
• View Object Browser is a search tool and browser
Unstructured navigation events included selecting a file in an explorer window or selecting
the tab for a file, using arrow and page up/down keys to go up/down through a file, scrolling,
clicking on a file element, and using any of the built-in find commands such as “Find in Files” or “Quick Find”.
To evaluate developers use of recommended tools in Visual Studio, I categorized them by
search tool. Sando is part of the recommended developer tool suite for ABB and supports
structured navigation using code search [21].
Gamification practices consider the feedback of achievements and points as critical to a
suc-cessful outcome. The design of achievement awards should gradually encourage the participant
to reach higher and higher levels of success in the activity. Achievements must feel earned to the participant so they recognize the effort to get the award was significant and feel satisfied [8].
Hamari and Eranti describe a general relationship between achievements in games and regular
game play. Achievements in games typically create a parallel scoring system to the main game play. They make the game more engaging by providing multiple ways to increase your score
and multiple challenges in one interface.
Considering these guidelines, I assigned one point for each use of structured navigation commands while unstructured navigation commands received zero points. I gave additional
emphasis to using the Sando search tool by assigning ten points for each use. To create levels
following the guidance from Hamari [8], I applied an exponential curve based on points scored. Users initially “level up” after working a day or two; the next level may require a week’s work to
achieve as the difficulty increases. I designed the points and levels so above average developers
can pass all levels during the study period.
3.2
Tool Design
To target practices for developers, I designed a tool to apply game elements to the Integrated Development Environment that is most commonly used at ABB, Visual Studio. The tool focuses
on motivating the adoption of good practices by including elements of games in the development
environment. The following sections describe how I selected a practice suitable for gamification, designed the game, and included competitive elements in the game.
Blaze logs events from actions the developer takes or actions from Visual Studio itself. The
event is basically a GUI event managed with Visual Studio by event handlers registered with the application to listen for the event. Blaze becomes a global event handler listening for all
events by registering for them in Visual Studio.
Blaze records key attributes along with each event in Visual Studio. The name of the event provides a low-level classification. The event type reflects an internal classification in Blaze. An
optional field for Artifact Reference captures data such as the file-name being edited and the
currently selected line number. An anonymized unique identifier for each Blaze user allows us to investigate differences between developers.
To assist in log analysis, Blaze classifies the events into categories for related activities such as navigating, editing, building, debugging, testing, and using a known tool. Each event
structured navigation from unstructured navigation.
In another processing step, Blaze aggregates events along the time-line into sessions. A session is an abstract concept grouping multiple events into a sequence with a beginning and an
end. Of the many possible ways to define sessions, I chose to define Edit Session sequences as all
the events that transpire before and during a set of edits to a specific file. When the developer edits a new file, all the events after the last edit to the previous file are included in the new
sequence for the new file. For example, the developer edits file A, then navigates through files B
and C finally landing at line 100 of file D where they make another edit. All the events between the edit of file A and the edit of file D are considered part of the edit session ending with the
edit of file D. Multiple edits to file D that occur before editing a different file are included in
the same sequence ending with the edits to file D. Although not at the method level, this way of generating sequences is similar to how Robillard et al. generated sequences based on located
methods for their study [19].
3.3
Study Design
Utilizing the continuous monitoring capabilities of Blaze, I designed the study to conduct a
longitudinal study of the effect of Blaze on developers’ navigation practices. The Blaze tool revealed information about navigation in three stages of one week duration each. A post-study
survey gathered developers’ opinions of Blaze and some confounding factors that could influence
results.
3.3.1 Tool Feature Staging
Part of the research objective was to determine whether we can influence developers to change
their practices through gamification. As previously discussed, I designed the game in Blaze to influence developers towards using more structured navigation practices. The study began with
developers installing the Blaze tool and using it in the staged feature roll-out for five weeks.
The first three weeks, new features were turned on each week with the points and leaderboard activated in the third week. The last two weeks established the new normal for the the team.
After the participants installed the tool in their Visual Studio environment, Blaze did not
present ant gui window and simply collected data in the background.
After a week’s data collection marking the end of the first stage, Blaze started to
automati-cally pop-up a window containing a button for a web page with information. The page included
a link to download Sando and information about using Sando in a video demo. The sub-page on navigation contained a page of tutorial on the built-in structured navigation commands
background on Blaze’s purpose.
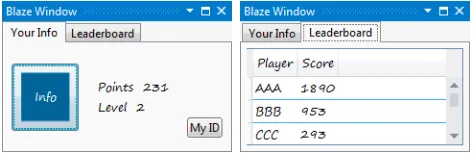
In the third stage, developers received instant feedback from Blaze on the points they accumulated during the development session. The tool’s appearance at this stage is shown in
Figure 3.1. The “Info” button provides a level indicator via colored contents and activates a
chart display windows when clicked. Points shows the points accumulated for the developer’s history. Level is the level of the game achieved based on an exponentially growing curve. The
leaderboard allows developers to see their own score in relation to the top five people on the
team. However, the other participants’ identifiers are auto-generated as three capital letters assigned based on their position on the leaderboard. Not knowing who of your colleagues was
ahead of you could reduce motivation, but this avoids one potential source of conflict in a team.
This final configuration remained as the display until the end of the study.
Figure 3.1: Blaze Tool Window
3.3.2 Study Participants
As mentioned in Figure 2.1 from the survey, the acceptance of gamification is highest in India.
Hence, I conducted this study with a team of 6 developers working in an R&D facility in India on a large industrial software system. By selecting a group of developer withing the same team
for the study, I hoped to leverage aspects of motivation such as the Leaderboard to spur feelings
of competition between teammates. Initially, I met the whole team along with the management staff to explain the research project and the Blaze tool I developed. I explained the aim of the
study, what data is collected, and how the data would be processed and managed.
It was important to gain the confidence of the participants that their data were kept con-fidential so their activities would be as close as possible to real-world. If the participants felt
like they are being tracked and the data would identify them to their peers or managers, then they may refuse to participate or deviate from their normal development style.
I assured the team about the confidentiality of the data, and the management reassured
however, managers did not know who participated in the study. Their names and data were kept
confidential to ensure that no one apart from the research team knows he/she is participating in the study. To distinguish individuals in the data each user is assigned a generated unique ID.
Developers could chose to share the unique ID with me or keep it confidential. All were willing
to share their unique ID with me during the follow-up feedback sessions.
Management wished to have no knowledge of who was participating and took great care to
remain detached from the study proceedings. Data at this level of detail has not been collected in
ABB development organizations. I was careful to create the system where developers controlled whether I could associate their identity with their data.
3.3.3 Post Study Survey
The goal for the study follow-up survey was to collect feedback on the tool and the effect it had on the developers’ navigation practices and knowledge. The survey questions were segmented
into portions that evaluate prior and post knowledge of navigation practices, key steps in the
study itself, the influence of game elements on their navigation practices, typical tasks and demographic information.
To find out whether Blaze increased developers’ knowledge of structured navigation
com-mands, I asked them to rate their knowledge of structured navigation commands prior to the study on a 1-10 scale. Then I asked them to contrast their knowledge after the study to assess
what they learned from the study.
The other key question is did Blaze have a perceived effect on their navigation practices. Here too I asked them to rate how much they used structured navigation prior to the study
using a 4 choice rating of “not at all”, “some”, “many times”, and “as much as possible”. Then
I asked whether they used structured navigation commands “about the same amount”, “more”, or “a lot more” during the study. These two questions assessed their perceptions of structured
navigation command use. I compared the answers with the usage data collected from Blaze.
The final assessment questions tested whether using Blaze influenced their attention to navigation commands by asking how much specific game elements influenced their practices.
The responses available were “not at all”, “a little”, “some”, and “a lot”.
The other questions included whether they reviewed the training materials on structured navigation commands, installed the Sando code search tool, and what types of development
tasks they would consider using structured navigation for in general. Another demographic
Chapter 4
Results and Conclusions
Following the study deployment of Blaze, I analyzed data generated by Blaze on developers work patterns, then conducted a survey questionnaire about their experience and reactions to
the game aspects of the Blaze tool. The questionnaire also shared an analysis of the individual
developer’s data as feedback to them and asked them questions about the data. In this chapter, I discuss the survey results, the observations drawn from data analysis, and the feedback I
gave developers and their reaction to the feedback. Finally I discuss threats to validity and
conclusions from this study.
4.1
Post-Study Survey Results
An in-person post study survey cross checks the quantitative data from Blaze with developers’
perception of their practices and their demographic information.
I asked developers to provide their years of experience so I could evaluate any effects
expe-rience might have. The developers in the study had between 7 and 14 years expeexpe-rience. One developer who dropped out of the study said their lower level of experience compared to their
peers influenced their decision to stop participating.
I asked developers to rate their knowledge of the code they maintain. Four of the six devel-opers reported they maintain code that they wrote, while the two most experienced develdevel-opers
maintain code that they recently learned. One developer reported during the individual
feed-back sessions that working in code they know well affects their navigation practices leading them to use more unstructured navigation.
On the assessment of prior structured navigation knowledge, three of the participants replied
they had very good prior knowledge about structured navigation and they use structured nav-igation “as much as possible”. The other half of the participants rated their prior knowledge of
0 1 2 3 4 5 6 Leaderboard
Point Score Navigation Indicator
Number of Participants With Rating Influence of Game Elements
A Lot Some A Little Not at All
Figure 4.1: Influence of Feedback Elements
developers who rated their prior knowledge and use of structured navigation higher, two of them had the highest point scores of the group. Thus developers’ prior knowledge of structured
navigation may contribute more to results in the study than the tool itself.
The chart in figure 4.1 shows how the individual feedback features influenced developers
to think about using structured navigation. Four out of six developers said the leaderboard
influenced them “a lot”, and all rated the leaderboard as having at least “a little” influence. Three out of six said their individual point score influenced them “a lot”, and all said the score
had at least “a little” influence. The element with mixed ratings was a graphical indicator on
whether they were improving over past use of structured navigation commands. The indicator received the influencing “a lot” rating from two participants and a “not at all” influence rating
from one participant with the rest having at least “a little” influence. The results indicate the
more obvious and more clearly comparative information in the leaderboard was the strongest influence for developers.
Three of out six participants requested that Blaze provide more feedback on tips to help
them increase their score. One of the three said specifically that more obvious feedback, such as hints that pop-up when they launch the tool, would help them more than passively provided
information. Two of the developers’ desire for personal metrics and historical views of the data
4.2
Study Data Observations
4.2.1 Observations About Drivers of Edit Session Duration
I selected navigation as the subject of the study game because it was identified by Robillard
et al.[19] as correlated with developers who effectively completed a maintenance task. In this analysis, I ask whether I am focusing on the right area of developers’ activity in Visual Studio.
In order to test whether navigation is an important area to address, I construct a hypothesis that using unstructured navigation is an important factor in developer productivity. Edit Session
duration, I assert by opinion, is a factor related to developer productivity though there are many
other factors I could consider. With the data available from Blaze, I can explore the categories of events correlated with the duration of edit sessions over the period of the study.
Using Weka[7], I performed an attribute selection process to identify the most significant
attributes related to edit session duration. The attribute search method I chose was Greedy Step-wise search, which selects attributes based on their correlation with the target, and stops
adding attributes when the next attribute decreases the correlation. The top 5 out of the 15
possible categories ranked by this process are as follows:
1. Unstructured navigation
2. Debug - events from running the debugger
3. Edit - events that modify the code
4. Other Actions - other events in visual studio
5. Build - events from running a build
To determine the correlation with edit duration, I used R [18] to construct a linear
regres-sion model for unstructured navigation. The linear model found a positive correlation with
unstructured navigation with:
p−value < .001
df = 1694
R−squared= 0.64
The adjusted R-squared of 0.64 shows a good portion of the variation in edit duration is
explained by the unstructured navigation category.
This analysis shows I cannot disprove that unstructured navigation is correlated with edit duration, thus I conclude it is an important factor in developer productivity.
4.2.2 Observations on Navigation Ratio
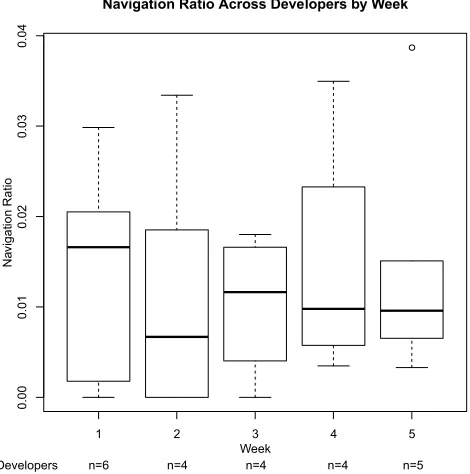
During the study, I staged the deployment of information feedback to developers so they would
1 2 3 4 5 0 .0 0 0 .0 1 0 .0 2 0. 0 3 0 .0 4
Navigation Ratio Across Developers by Week
Week N av ig a tio n R a tio
Developers n=6 n=4 n=4 n=4 n=5
Figure 4.2: Navigation Ratio by Week
of points for using structured navigation commands.
To evaluate whether developers use more structured navigation when they receive instant
feedback, I monitor the change in navigation ratio over the study period. I expected developers learning about navigation commands and tools that count towards the score would begin using
the practices more during the second week. In the third week, I turn on points feedback and
the leaderboard expecting this will encourage developers to use more structured navigation. My hypothesis is that instant feedback from points combined with game information would result
in an increase in the navigation ratio for developers in the study.
I observe visually in Figure 4.2, that the navigation ratio did not increase significantly from the beginning to the end of the study. I evaluated the week over week differences using
a Wilcoxon Rank sum test [9] comparing week one to week two and week one to week three.
In week two, when the developers were able to learn about structured navigation commands, there was no significant change. Also in week two, two developers were not providing data. One
was working in another environment and returned to the study, while the other dropped for the rest of the study. In week three there was a slight increase in the mean, however the increase
is not significant. Weeks four and five follow the formal period of study show the navigation
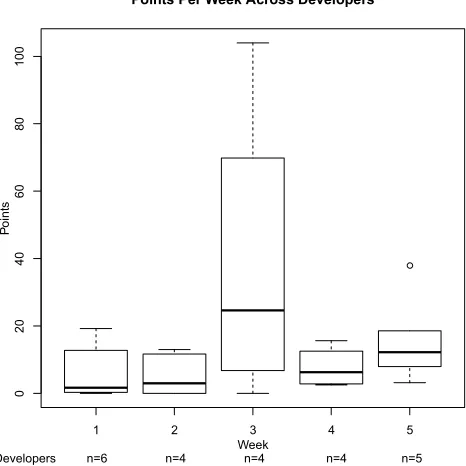
4.2.3 Observations on Points
The developers using Blaze received feedback in the form of points given for using structured
navigation commands and using the Sando search tool[21]. Per the study design, the points
display was disabled until the third week following installation to establish the effect of in-stant feedback apart from other information. The points display and the navigation arrow were
enabled in the third week to test whether the instant feedback was successful in driving
in-creased use of the targeted features. During the first two weeks shown in Figure 4.3, developers were fairly consistent in their use patterns. With the introduction of the points feedback, two
developers’ points accumulation spiked in week three due mostly to increased use of Sando.
In these results, I see an effect from the points display in Blaze in week three when the developers could see their points feedback for the first time. I conducted a Wilcoxon Rank sum
test on points similar to the way I did for navigation ratio to determine significance. Across the study developers, the difference is not significant at the .05 level. The p-value for week two
against week three is .19, and for week one against week three it is .31. I do know from feedback
discussions and usage data that two developers took notice of the points and used Sando more in the third week. Their use of Sando continued at a lower level in weeks four and five. The effect
of points feedback is greater than navigation ratio during week three because of the additional
emphasis of the ten point bonus given for Sando usage. Results from the post-study survey where at least half the developers said the points and leaderboard influenced them “a lot” also
supports the conclusion that two developers were influenced by the game elements in Blaze.
4.2.4 Developer Feedback Discussions
Following the data analysis, feedback sessions were conducted with the study participants. I generated the feedback in the form of individualized presentations of quantitative charts and
written analysis of the information. The key quantitative chart shown in Figure 4.4 compared
their distribution of time in each category to the median for the group.
Developers revealed during these feedback sessions that they did not spend the entire time
in their desktop environment because they had a virtual machine environment available for testing. Thus categories like testing and debugging were affected by whether they used the
virtual environment or their desktop for these activities. Because those categories are not part
of navigation, they are not discussed here. The developers use the virtual environment explains some instances where developers have no activity recorded on some days.
One developer’s build effort and the underlying build frequency was much higher than the
group median, see Figure 4.4. We asked the developer to explain how building more frequently helps them. By doing more frequent build, (s)he is trying to ensure the correctness of the work
1 2 3 4 5
0
2
0
4
0
6
0
80
10
0
Points Per Week Across Developers
Week
P
o
in
ts
Figure 4.3: Average Points per Day by Week
0% 20% 40% 60% 80%
Build Debug Edit Structured Unstructured
Percent of Time
Ca
te
og
ry
Time per Edit Session by Category
Median D
because the code and logic is fresh in her memory. If they build less frequently, even though it
reduces the build effort, there are more bugs each time and the developer often spends more time in identifying the problem area than fixing it. Hence the developer feels more frequent
builds improves her productivity.
In another case, I observed a higher level of unstructured navigation than median and asked the developer to explain. Even though they agree structured navigation is better than
unstructured navigation, (s)he prefers unstructured navigation in some specific instances. The
developer is the author of the code and (s)he knows the code completely. “I know that the line I need to fix is in XYZ method and it is four blocks down from where I am currently. It
takes much less time for me to reach the fix location using unstructured navigation. If the code
is not written by me, I will prefer structured navigation.” This instance cautions us to gather information on aspects such as code familiarity and developer experience with the product when
assessing the results of a navigation study.
Two developers said they expected a different experience from Blaze such as immediate prompts to suggest navigation commands within the context of what they are working on. This
contradicts some developers’ comments from the pre-study survey that indicated interruptions
from a game would be distracting and unwelcome.
In the feedback, I shared a set of achievement badges tied to specific navigation commands
with developers. Developers said badges would both inform and motivate them to use some specific tools or commands. This contradicts a result from the pre-study survey where
respon-dents rated badges last in their influence motivating them to improve. The difference in this
opinion may result from the context where developers, when presented with badges, see how badges serve as both a feedback mechanism and guidance on the commands for improving their
score and practices.
4.3
Threats to Validity
The threats to construct validity occur when measurements may not reflect the intended
op-erational definition.The key measures of navigation ratio and points in the study could have
results differing from their definition.
Measuring navigation ratio involved categorizing events into structured and unstructured
navigation. The categorization of events is specific to this study and documented herein,
how-ever, it may not be accurate to the intent of the operational definition of structured navigation depending on how the developer uses some commands like Find. Another factor affecting this
measurement may occur when developers repeat a command such as hitting the down arrow key many times, that may be something other than navigation (though it is classified as such
account for these repetitive actions.
The points measurement is more susceptible to influences of simple developer activity com-pared to navigation ratio. Thus, a very busy developer could accumulate more points using a
lower navigation ratio than a developer who has less activity performed more efficiently.
Threats to internal validity are those conditions that create alternative reasons for the conclusions, or confound the conclusion. The Hawthorne effect, where improvement occurs
because I am seeking a change in a particular practice, could impact the results because a
presentation to the study organization was required in advance of deployment. By making the purpose of the measurement and contest known, I may have triggered the participants to think
about navigation commands they use before establishing a baseline. This threat is mitigated
by the data showing four participants did not improve over the course of the study while two demonstrated some improvement.
Participants in the study were not randomly selected, they are all volunteers from one
intact team chosen due to their advanced practices and understanding of metrics. Therefore the participants may be predisposed to have an interest in the kind of tool and methodology I am
piloting and have bias towards a favorable opinion.
The team may be more familiar with the code they maintain thus be less likely to change their navigation practices. The post-study survey responses confirmed developers are less
in-clined to use structured navigation when they work in code they are very familiar with. Threats to external validity include the fact that the study was conducted in one
devel-opment location of one company. Other companies and locations may have different cultures
incompatible with this type of monitoring activity.
Threats to generalizable results exist because I conducted the study of the tool with six
developers thus the population size is too small to draw statistically significant inferences from.
The study was conducted in India, the country with the most positive response in the pre-study survey, perhaps where this activity was most acceptable. Thus, other countries who rated
their view of gamification lower may be less receptive.
Participants in the study were professional software engineers with at least seven years of experience. In other settings where developers have different levels of experience, the results
may differ. In the pre-study survey, experience was not part of the question set, thus it could
have results skewed to a particular age group.
4.4
Conclusions
I set out to demonstrate whether gamified software development practices would succeed in changing industrial software developers’ practices. Through a series of three steps I conducted
developers in an intact team using the Blaze tool, and post-study survey with the same six
developers. A common thread of findings through all three steps is developers are interested in the idea of using games to help them learn and improve their practices. On average, 74% of
developers were interested in gamified workspace in the pre-study survey, and five out of six
developers indicated elements like points and leaderboards influenced them in the post-study survey. The recorded usage data shows two out of six developers in the study responded
posi-tively when they started receiving points feedback. I learned developers need more detailed and
immediate feedback from Blaze on ways to improve their practices. Some developers also ap-preciated charts providing a historical view of how they spend their time by category compared
with the median for the team. This compliments their feedback on the game showing developers
want more information on how to become more effective at their job. Improvements to the Blaze tool include more active feedback to developers on structured navigation commands that both
informs them and keeps them thinking about them. The study would benefit from more
par-ticipants and establishing a control group who does not receive feedback and is just monitored by the tool. Future work includes providing a mechanism that shares tool recommendations
REFERENCES
[1] Oxford Dictionaries Online - American English (US). Oxford University Press, 2013.
[2] P. Abrahamsson, R. Moser, W. Pedrycz, A. Sillitti, and G. Succi. Effort Prediction in Iterative Software Development Processes – Incremental Versus Global Prediction Models.
InEmpirical Software Engineering and Measurement, ESEM, pages 344–353. IEEE, 2007.
[3] Sarah Beecham, Nathan Baddoo, Tracy Hall, Hugh Robinson, and Helen Sharp. Motivation in Software Engineering: A systematic literature review.Inf. Softw. Technol., 50(9-10):860– 878, August 2008.
[4] I. D. Coman, A. Sillitti, and G. Succi. A case-study on using an Automated In-process Software Engineering Measurement and Analysis system in an industrial environment. In
International Conference on Software Engineering, ICSE, pages 89–99. IEEE, May 2009.
[5] IrinaDiana Coman, Alberto Sillitti, and Giancarlo Succi. Investigating the Usefulness of Pair-Programming in a Mature Agile Team. In Abrahamsson and et al., editors, Agile
Processes in Software Engineering and Extreme Programming, volume 9 of Lecture Notes
in Bus. Info. Processing, chapter 13, pages 127–136. Springer, 2008.
[6] Daniel J. Dubois and Giordano Tamburrelli. Understanding gamification mechanisms for software development. InFoundations of Software Engineering. ACM, 2013.
[7] Mark Hall, Eibe Frank, Geoffrey Holmes, Bernhard Pfahringer, Peter Reutemann, and Ian H. Witten. The WEKA data mining software: an update. SIGKDD Explorations, 11(1), 2009.
[8] Juho Hamari and Veikko Eranti. Framework for Designing and Evaluating Game Achieve-ments. InDigra Conference, September 2011.
[9] Thomas Hill and Paul Lewicki. Statistics: Methods and Applications. StatSoft, Inc, 2007.
[10] P. M. Johnson and Hongbing Kou. Automated Recognition of Test-Driven Development with Zorro. InAgile Conference (AGILE), pages 15–25. IEEE, August 2007.
[11] Hongbing Kou, PhilipM Johnson, and Hakan Erdogmus. Operational definition and auto-mated inference of test-driven development with Zorro. Automated Software Engineering, 17(1):57–85, 2010.
[12] M. Maehr. Culture and achievement motivation.American Psychologist, 1974(29):887–896, 1974.
[13] Raimund Moser, Pekka Abrahamsson, Witold Pedrycz, Alberto Sillitti, and Giancarlo Succi. A Case Study on the Impact of Refactoring on Quality and Productivity in an Agile Team. In Bertrand Meyer and et al., editors,Balancing Agility and Formalism in Software
[14] Raimund Moser, Alberto Sillitti, Pekka Abrahamsson, and Giancarlo Succi. Does Refactor-ing Improve Reusability? In Maurizio Morisio, editor,Reuse of Off-the-Shelf Components, volume 4039 of Lecture Notes in Comp. Sci., pages 287–297. Springer Berlin Heidelberg, 2006.
[15] E. Murphy-Hill, C. Parnin, and A. P. Black. How We Refactor, and How We Know It.
IEEE Transactions on Software Engineering, 38:5–18, January 2012.
[16] Emerson Murphy-Hill, Rahul Jiresal, and Gail C. Murphy. Improving Software Developers’ Fluency by Recommending Development Environment Commands. In Foundations of
Software Engineering. ACM, November 2012.
[17] Emerson Murphy-Hill and Gail C. Murphy. Peer interaction effectively, yet infrequently, enables programmers to discover new tools. In ACM Conference on Computer supported
cooperative work, CSCW. ACM, 2011.
[18] R Core Team. R: A Language and Environment for Statistical Computing. R Foundation for Statistical Computing, Vienna, Austria, 2013.
[19] M. P. Robillard, W. Coelho, and G. C. Murphy. How effective developers investigate source code: an exploratory study. IEEE Transactions on Software Engineering, 30:889– 903, December 2004.
[20] Saatchi and Saatchi S. Gameification for business brands and loyalty.
http://www.slideshare.net/Saatchi S/gamification-study, June 2011.
[21] David Shepherd, Kostadin Damevski, Bartosz Ropski, and Thomas Fritz. Sando: an ex-tensible local code search framework. InFoundations of Software Engineering. ACM, 2012.
[22] Leif Singer.Improving the Adoption of Software Engineering Practices Through Persuasive
Interventions. PhD thesis, Gottfried Wilhelm Leibniz Universitt Hannover, 2013.
[23] Leif Singer and Kurt Schneider. It was a bit of a race: Gamification of version control.
In Second International Workshop on Games and Software Engineering: Realizing User
Engagement with Game Engineering Techniques (GAS). IEEE, June 2012.
[24] Will Snipes, Vinay Augustine, Anil R. Nair, and Emerson M. Hill. Towards recognizing and rewarding efficient developer work patterns. InInternational Conference on Software