ISSN(Online): 2320-9801
ISSN (Print): 2320-9798
I
nternational
J
ournal of
I
nnovative
R
esearch in
C
omputer
and
C
ommunication
E
ngineering
(An ISO 3297: 2007 Certified Organization)
Vol. 4, Issue 9, September 2016
Detection and Removal of Shadow Using
Very High Resolution Remote Sensing
Images
Sarita A. Ingale, Dr.Karbhari V. Kale
M.Tech Student, Department of Computer Science& IT, Dr. Babasaheb Ambedkar Marathada University,
Aurangabad, Maharashtra, India
Professor, Department of Computer Science& IT, Dr. Babasaheb Ambedkar Marathada University,
Aurangabad, Maharashtra, India
ABSTRACT- The shadows are mainly observed because of tall buildings, towers etc. in urban areas. Shadows in very high resolution (VHR) Remote Sensing images represent serious problems for their full development. To reduce the shadow effects in very high resolution (VHR) Remote Sensing images for their further applications, detection and removal of shadow is necessary which is developed. In this project we have addressed the issue of shadow detection and removal in VHR Remote Sensing images.The detection and classification tasks are implemented by means of support vector machine approach and for noise removal filtering is used. Shadow removal is done using linear regression method. In this method, the shadow blocks of the image are replaced by adjusting the intensities of the shaded points to the statistical characteristic of the non-shadow regions. Then fuse the original image and shadow removal image. Wavelet transform is used for image fusion. Inverse wavelet transform is used for getting original image back from decomposed image.
KEYWORDS: Shadow Detection; Shadow removal; Very High Resolutions (VHR) Remote Sensing Images.
I.INTRODUCTION
ISSN(Online): 2320-9801
ISSN (Print): 2320-9798
I
nternational
J
ournal of
I
nnovative
R
esearch in
C
omputer
and
C
ommunication
E
ngineering
(An ISO 3297: 2007 Certified Organization)
Vol. 4, Issue 9, September 2016
II.RELATEDWORK
T. Kim presented a technique which might be extension of Tsai method. Experimental result shows that the accuracy is more. For shadow removal they used avalanche histogram equalization [1]. A solution to the problem of automatic detection and removal of shadow features proposed by P.M. Dare [3].
Binary classification for shadow and no shadow region of image analyzed by K. Kouchi and F. Yamazaki. To get clear borders, they first applied canny edge detection algorithm and then applied image imposing process. For reconstruction process, they calculated mean and standard deviation for shadow and no shadow pixels of image and applied mean difference, and for improving results normalization process with the help of standard deviation [4].
The several invariant color spaces to analyze shadows were introduced by E. Salvador, A.Cavallaro, and T. Ebrahimi.The advantage of invariant color features found as a low complexity of the classification stage as well as the method gave better performance in detecting and classifying shadows [6].
Tsai used the several invariant color spaces that decouple luminance and chromaticity, including HSI, HSV, HCV, YIQ, and YC C model, which gives dramatically improved visualization of features within recovered shadow regions [7].Chung was found more accurately the successive thresholding scheme (STS) to detect shadows. STS-based algorithm has been implemented for identifying shadows of color aerial images under the observation of shadow maps.[10].D. Cai, M. Li, Z. Bao, Z. Chen,W.Wei, and H. Zhang presented an effective approach for shadow segmentation and compensation in colour satellite images. The approach uses (NSIDI) normalized saturation-intensity difference index in (HSI) Hue- Saturation-intensity colour space to detect the presence shadows [11] [12] [13]. P. Sarabandi, F. Yamazaki, M. Matsuoka, and A. Kiremidjian presented an efficient and simple approach for detection and removal of shadow based on Hue-saturation-value (HSV) color model. In the proposed method shadows are detected using (NDVI) normalized difference index and subsequent thresholding andbuffer area is calculated using morphological operators. The mean as well as variance of these buffer areas are used to compensate the shadow regions [14].
III.PROPOSED METHOD
The proposed method consist of two different phases; Training phase and testing phase.
A. GENRAL:In shadow detection and removal first part is training phase. In this manually select shadow and non-shadow block of original image and extract the features of that blocks in terms of R, G and B values. Then second part is testing phase, In this divide the original image and extract the features of that original image in terms of R, G and B values. Apply first binary classification to distinguish between shadow and non-shadow classes. To remove noise in the corresponding classes median filter is used. Then multi class classification is used to distinguish between the non-shadow classes and corresponding non-shadow classes. To remove isolated labels post processing is used. Then Shadow removal process is used to remove shadows in the image.
B. TRAINING PHASE:Fig1. Shows training phase is divided into two steps namely preprocessing followed by feature extraction.
1) Preprocessing: In training phase, first part is preprocessing. In region of interest creation manually select shadow and non-shadow blocks.
ISSN(Online): 2320-9801
ISSN (Print): 2320-9798
I
nternational
J
ournal of
I
nnovative
R
esearch in
C
omputer
and
C
ommunication
E
ngineering
(An ISO 3297: 2007 Certified Organization)
Vol. 4, Issue 9, September 2016
Fig1. Training Phase
C. TESTING PHASE: Fig. 2 Shows testing phase of the binary classificationBlock. In testing phase first divide the original image into 8*8 blocks. Then extract the features of that blocks in terms of mean of R, G and B values. Then apply these features of original image, training data and number of classes at input of SVM. For shadow pixel 1 will be selected and for non-shadow pixel 0 will be selected.
Fig2. Testing Phase
D. BINARY CLASSIFICATION: This classification procedure is used to implement in a supervised way by means of
a support vector machine (SVM). For binary classification at the SVM, 3 inputs are given which is feature extracted of original image, training data and classes. The output of SVM shows either 0 or 1. For shadow 1, and for non-shadow 0 will be selected.
E. NOISE REMOVAL: The binary image may be contains noise in the image. Basically this noise is due to the small
objects such as cars, trees etc. in the image. The problem in removing noise from binary image is due to image data and the noise share the same small set of values (either 0 or 1). Which gives the problems in the detection and removal of shadow areas. To minimize this problem right choice of filter is necessary. We are using Median filter to remove salt and pepper noise from VHR Remote Sensing image. It is possible for removing isolated shadow pixels in non-shadow area and isolated non shadow pixels in shadow area. The removal of noise in the binary image is performed by taking the place of window center by the median of center neighborhood. The main problem is relatedto distortion in the corners and thin lines present in the image.
F. MULTICLASS CLASSIFICATION: The previously obtained result which is obtained from noise removal process
ISSN(Online): 2320-9801
ISSN (Print): 2320-9798
I
nternational
J
ournal of
I
nnovative
R
esearch in
C
omputer
and
C
ommunication
E
ngineering
(An ISO 3297: 2007 Certified Organization)
Vol. 4, Issue 9, September 2016
3 inputs are given which is feature extracted of original image, train Tr1, and 4 different number of classes of shadow. If sum of array elements of binary image is less than 1, then at the SVM 3 inputs are given which is features extracted of original image, train Tr2, and 4 different number of classes for non-shadow areas. In the multiclass classification we are using 4 different no classes and different colors for shadow and correspondingly for non-shadow classes.
G. POST PROCESSING: To improve the classification result before exploiting it for the removal of shadow areas, post processing is applied on it. In this removing isolated shadow labels in non-shadow areas and isolated non shadow labels in shadow areas.
H. SHADOW REMOVAL: Shadow removal is important and last steps in our methodology. From the above result we
observed that the relation between shadow class and corresponding non shadow class on the other side is of the linear type. We are using linear regression method for shadow removal. In this method replace the shadow blocks of image by corresponding non shadow blocks. Then fuse the original image and shadow removal image. Haar wavelet transform is used for image fusion. Inverse wavelet transform is used for getting the original image from decomposed image.Steps for removal of shadow in image we have adopted are as follows:
1) Load the pixels of non-shadow blocks images in training phase.
2) Divide the original image and multiclass shadow region into 8*8 blocks.
3) Calculate the mean of multiclass shadow block by replacing the shadow blocks by corresponding nonShadowblocks. 4) Calculate the different values means for boosting the colors of new shadow free image using gammaCorrection method.
5) After boosting the colors for improving the result image fusion is used. 6) Second level haar Wavelet transform is used for the image fusion.
7) Inverse wavelet transform is used for getting the original image from decomposed image.
IV.PSEUDOCODE
Step 1: Train SVM by Selecting the shadow and non-shadow blocks manually. Step 2: Upload the original image.
Step 3: Apply Support Vector machine on the uploaded Original image for binary classification. Step 4: If noise is present in binary image, then remove that noise using filtering.
Step 5: Apply Multiclass classification
If (sum of array elements of binary image >1)
Then at SVM, three inputs are given i.e. Feature extracted from original image, train data Tr1 And number of shadow classes.
Else
This three inputs are given to SVM i.e. Feature extracted from original image, train data Tr2 And number of non-shadow classes
End
Step 6: To improve the classification result, apply post processing. Step 7: And then finally do shadow removal process as mentioned above. Step 8: End.
V. EXPERIMENTAL RESULTS
The experimental computer environment is described as follow: in 64 bits windows 7 operating system. Before starting the shadow removal process, for eachDataset we prepared a ground truth by photo interpretation so as to generate classification map conveying the shadow and non-shadow classes. The dominant non shadow classes we define for Boumerdes image are the following:
ISSN(Online): 2320-9801
ISSN (Print): 2320-9798
I
nternational
J
ournal of
I
nnovative
R
esearch in
C
omputer
and
C
ommunication
E
ngineering
(An ISO 3297: 2007 Certified Organization)
Vol. 4, Issue 9, September 2016
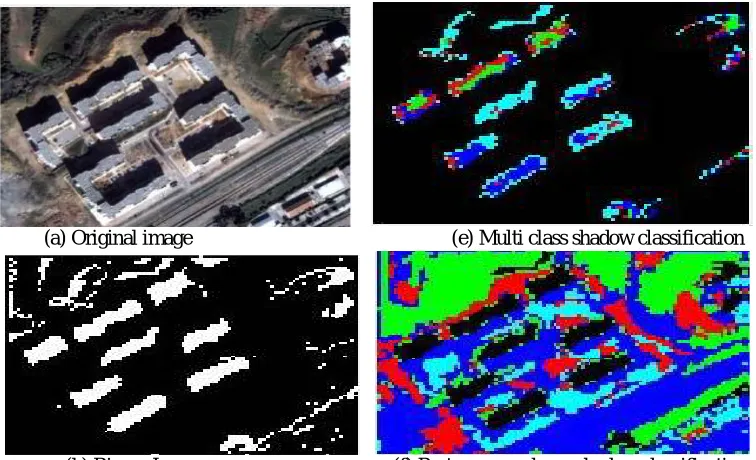
After completing the ground truth, we defined the corresponding shadow counterparts for each image. As described in the previous section, the first task of the proposed methodology is to divide the image, extract R, G and B features, and then, a binary SVM based on the Gaussian kernel was trained to recognize the group of shadow classes from the group of non-shadow classes. Next, the SVM was applied on the whole image to get first binary image [see Fig. 4 (b)]. A visual inspection of the binary image suggest that, while for Boumerdes and the Jeddah images appear less noise as compare to the Atlanta image (very small shadow areas). Such noise is not due to the binary classifier but mainly to the presence of numerous cars, each characterized by its proper shadow. To reduce their presence in binary image, median filtering is applied. The outcome of this operation for the boumerdes image is shown in Fig. 4(c),which show a clear improvement in the binary images.
Concerning the multiclass classification, two multiclass SVMs with Gaussian kernel are trained on the basis of the available ground truth, one for discriminating between the shadow classes and the other between the non-shadow classes. The resulting classification map for non-shadow class is shown in Fig. 4(d) and for shadow classis shown in Fig. 4(e). Before moving to the shadow removal step, as described in the previous methodological section post processing is applied on multi class images in which removing isolated shadow labels in non-shadow areas and isolated non shadow labels in shadow areas. The resulting post processed multiclass non shadow result is shown in Fig. 4(f) and multiclass shadow result isshown in Figs. 4(g).
Finally, for each image and each type of shadow area which is successfully passed through linear regression is applied in which shadow areas which is successfully removed by replacing the shadow blocks by corresponding non shadow blocks. Then for boosting the colors gamma correction method is used. After boosting the colors for improving the result image fusion is used. Second level Haar Wavelet transform is used for the image fusion. Inverse wavelet transform is used for getting the original image from decomposed image. The final shadow removal for the Boumerdes images [see Fig. 4(h)]. In greater detail, focusing first on the Boumerdes image [see Figs. 4.1(h)], one can notice that some areas, mostly small, still remain dark (shaded) since they have not been reconstructed very well. From accuracy estimation table i.e. Table1, we observed that after reconstruction of shadow we get better results.
(a) Original image (e) Multi class shadow classification
ISSN(Online): 2320-9801
ISSN (Print): 2320-9798
I
nternational
J
ournal of
I
nnovative
R
esearch in
C
omputer
and
C
ommunication
E
ngineering
(An ISO 3297: 2007 Certified Organization)
Vol. 4, Issue 9, September 2016
(c) Filter image (g) Post processed shadow classification
(d)Multi class non shadow classification. (h) Final output image.
Figure 4.1: Removal of shadow results for Boumerdes image. (a) Original image. (b) Binary Image. (c) Filter image. (d)Multi class non shadow classification. (e) Multi class shadow classification (f) Post processed non shadow
classification (g) Post processed shadow classification (h) Final output image.
Accuracy Estimation Using PSNR and MSE:
PSNR: PSNR is nothing but peak signal to noise ratio between two images. It is used for Quality Measurement for
original and noisy (compressed) image. If higher the PSNR, better the quality of an image.
Formula:PSNR= 10 log10 ([R. ^2]/MSE)
MSE (Mean Square Error): It is used to measure image compression quality, which represents squared error between original and noisy (compressed) image. If lower the MSE, lower the error in the image.
Formula:[I1 (m,n)-I2 (m,n)).^2]/ M*N (Where, M represents row and n represents Column.)
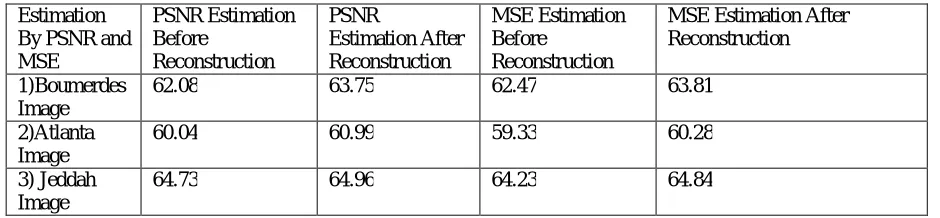
Table1: Accuracy Estimation
Estimation By PSNR and MSE
PSNR Estimation Before
Reconstruction
PSNR
Estimation After Reconstruction
MSE Estimation Before
Reconstruction
MSE Estimation After Reconstruction
1)Boumerdes Image
62.08 63.75 62.47 63.81
2)Atlanta Image
60.04 60.99 59.33 60.28
3) Jeddah Image
64.73 64.96 64.23 64.84
ISSN(Online): 2320-9801
ISSN (Print): 2320-9798
I
nternational
J
ournal of
I
nnovative
R
esearch in
C
omputer
and
C
ommunication
E
ngineering
(An ISO 3297: 2007 Certified Organization)
Vol. 4, Issue 9, September 2016
VI.CONCLUSION AND FUTURE WORK
This paper deal with the important and challenging problem of detection and reconstruction of shadow in VHR Remote Sensing image. In this project we examined first the basics of the shadow, how shadow occurs, then different types of shadows are also mentioned which can appear in the images. Detection and Removal of Shadow Regions may be useful for the geosciences department. Detecting of shadows in an image and reconstructing the shadow area gives the original information to some extent. As the performance of proposed method is analyzed by calculating PSNR and MSE values, in future work, we will try to get 100% reconstructed image. Also by using different methods of reconstruction of shadow, we will try to get better original information.
REFERENCES
1. T. Kim, T. Javzandulam, and T.-Y. Lee, “Semiautomatic reconstruction of building height and footprints from single satellite images,”IGARSS Transaction, vol. 2, pp. 4737–4741, Jul. 2007.
2. A. Massalabi, H. Dong-Chen, G. B. Benie, and E. Beaudry, “Detecting information under and from shadow in panchromatic ikonos images of the city of Sherbrooke,” IGARSS Transaction, vol. 3, pp. 2000–2004, Sep. 2004.
3. P.M. Dare, “Shadow analysis in high-resolution satellite imagery of urban areas,” International Conference on Photogramm. Engineering Remote Sensing, vol. 71, no. 2, pp. 169–177, 2005.
4. K. Kouchi and F. Yamazaki, “Characteristics of tsunami-affected areas in moderate-resolution satellite images,” IEEE Transaction on Geoscience Remote Sensing, vol. 45, no.6, pp. 1650–1657, Jun. 2007.
5.J. Liu, J. Yang, and T. Fang, “Color property analysis of remote sensing imagery,” International Conference on Acta Photon. Sinica, vol. 38, no. 2, pp. 441–447, 2009.
6. E. Salvador, A. Cavallaro, and T. Ebrahimi, “Shadow identification and classification using invariant color models,” IEEE Int. Conference on Acoust., Speech, Signal Processing, vol. 3, pp. 1545–1548, 2001.
7. V. Tsai, “A comparative study on shadow compensation of color aerial images in invariant color models,” IEEE Transaction on Geoscience Remote Sensing, vol. 44, no. 6, pp. 1661–1671, Jun. 2006.
10. K. L. Chung, Y. R. Lin, and Y. H. Huang, “Efficient shadow detection of color aerial images based on successive thresholding scheme,” IEEE Transaction on Geoscience Remote Sensing., vol. 47, no. 2, pp. 671–682, Feb. 2009.
11. D. Cai, M. Li, Z. Bao, Z. Chen,W.Wei, and H. Zhang, “Study on shadow detection method on high resolution remote sensing image based on HIS space transformation and NDVI index,” 18th International Conference on Geoinformatics, pp. 1–4 ,Jun. 2010.
12. H. Ma, Q. Qin, and X. Shen, “Shadow segmentation and compensation in high resolution satellite images,” in Proc. IEEE IGARSS Transaction, vol. 2, pp. 1036–1039, Jul. 2008.
13. H. Y. Yu, J. G. Sun, L. N. Liu, Y. H. Wang, and Y. D. Wang, “MSER based shadow detection in high resolution remote sensing image,” ICMLC Transaction, pp. 780–783, 2010.
14. P. Sarabandi, F. Yamazaki, M. Matsuoka, and A. Kiremidjian, “Shadow detection and radiometric restoration in satellite high resolution images,”IEEE IGARSS Transaction, vol. 6, pp. 3744–3747, Sep. 2004.
BIOGRAPHY
Sarita A. Ingaleis a PG Student in the Computer Science and IT Department, Department of Computer Science & IT, Dr. BabasahebAmbedkarMarathwada University. She received Master of Technology (M.Tech) degree in 2016 from