University of Windsor University of Windsor
Scholarship at UWindsor
Scholarship at UWindsor
Electronic Theses and Dissertations Theses, Dissertations, and Major Papers
2012
A Meta-analysis of Cognitive Functioning in Non-Demented Adults
A Meta-analysis of Cognitive Functioning in Non-Demented Adults
with Type 2 Diabetes Mellitus
with Type 2 Diabetes Mellitus
Michelle Cécile Émélie Monette University of Windsor
Follow this and additional works at: https://scholar.uwindsor.ca/etd
Recommended Citation Recommended Citation
Monette, Michelle Cécile Émélie, "A Meta-analysis of Cognitive Functioning in Non-Demented Adults with Type 2 Diabetes Mellitus" (2012). Electronic Theses and Dissertations. 5540.
https://scholar.uwindsor.ca/etd/5540
This online database contains the full-text of PhD dissertations and Masters’ theses of University of Windsor students from 1954 forward. These documents are made available for personal study and research purposes only, in accordance with the Canadian Copyright Act and the Creative Commons license—CC BY-NC-ND (Attribution, Non-Commercial, No Derivative Works). Under this license, works must always be attributed to the copyright holder (original author), cannot be used for any commercial purposes, and may not be altered. Any other use would require the permission of the copyright holder. Students may inquire about withdrawing their dissertation and/or thesis from this database. For additional inquiries, please contact the repository administrator via email
A Meta-analysis of Cognitive Functioning in Non-Demented Adults with Type 2 Diabetes
Mellitus
by
Michelle C. E. Monette
A Thesis
Submitted to the Faculty of Graduate Studies through Psychology
in Partial Fulfillment of the Requirements for the Master of Arts at the
University of Windsor
Windsor, Ontario, Canada 2012
A Meta-analysis of Cognitive Functioning in Non-Demented Adults with Type 2 Diabetes
Mellitus
by
Michelle C. E. Monette
APPROVED BY:
______________________________________________ Dr. L. Patrick
Department of Nursing
______________________________________________ Dr. D. Jackson, Co-Advisor
Department of Psychology
______________________________________________ Dr. A. Baird, Co-Advisor
Department of Psychology
______________________________________________ Dr. J. Casey, Chair of Defense
Department of Psychology
iii
DECLARATION OF ORIGINALITY
I hereby certify that I am the sole author of this thesis and that no part of this
thesis has been published or submitted for publication.
I certify that, to the best of my knowledge, my thesis does not infringe upon
anyone’s copyright nor violate any proprietary rights and that any ideas, techniques,
quotations, or any other material from the work of other people included in my thesis,
published or otherwise, are fully acknowledged in accordance with the standard
referencing practices. Furthermore, to the extent that I have included copyrighted material
that surpasses the bounds of fair dealing within the meaning of the Canada Copyright
Act, I certify that I have obtained a written permission from the copyright owner(s) to
include such material(s) in my thesis and have included copies of such copyright
clearances to my appendix.
I declare that this is a true copy of my thesis, including any final revisions, as
approved by my thesis committee and the Graduate Studies office, and that this thesis has
iv ABSTRACT
There is a large body of literature confirming the presence of cognitive
functioning deficits in individuals with Type 2 Diabetes Mellitus (T2DM) who have not
been diagnosed with dementia, but a clear pattern has yet to emerge. The main goal of the
present study was to determine the pattern and magnitude of cognitive functioning
deficits in individuals with T2DM without dementia using meta-analysis. Differences in
cognitive functioning were evaluated between those with T2DM and non-diabetic
controls on specified cognitive abilities as well as on individual neuropsychological tests.
Individuals with T2DM performed significantly lower than non-diabetic controls (p <
0.05) on all cognitive abilities and on all neuropsychological tests evaluated. The
majority of effect sizes were in the small range. The findings from this study will help to
inform clinical work with individuals with T2DM and will be a first step towards
v
ACKNOWLEDGEMENTS
I wish to sincerely thank the people who supported and encouraged me to see this
thesis through to completion. First and foremost, Dr. Anne Baird for her support and
expertise, and for allowing me to pursue a project that was important to me even though
this meant some extra work on her part, Dr. Dennis Jackson for his knowledge and help
with the methodological aspects of the project, Dr. Linda Patrick for her indispensible
comments and support throughout the proposal and defense process, and Katie Chauvin
for her contributions to study coding.
I would like to thank Dr. Guy Proulx for being the first person to teach me about
neuropsychology and how neuropsychology can be tied to diabetes research as well as the
late Dr. Evelyne Corcos for first teaching me most of everything else I know about
psychology. I want to thank my mom for her unwavering belief in me and continued
support through my academic career. Lastly, I want to thank my sister for always giving
vi
TABLE OF CONTENTS
DECLARATION OF ORIGINALITY...iii
ABSTRACT...iv
ACKNOWLEDGEMENTS...v
LIST OF TABLES...viii
LIST OF FIGURES...ix
CHAPTER I. INTRODUCTION AND REVIEW OF THE LITERATURE Type 2 Diabetes Mellitus...2
The Importance of T2DM, Cognitive Impairment, and Dementia...4
The Cognitive Impairments Present in T2DM...5
Moderator Variables: Disease and Demographic Variables...8
Chronic hyperglycemia...9
Age...11
Duration of illness...12
Treatment modality...12
Complications...13
Depression...14
Hypertension...15
Moderator Variables: Methodological Variables...15
Present Study...16
II. METHOD Selection of Studies... 18
Search engines and search strategy... 18
Key words to be used... 18
Inclusion and exclusion criteria... 18
Measures and Coding...20
Cognitive ability classification...20
Coding for moderator variables...21
Statistical Analyses...22
Effect size calculation...22
vii
III. RESULTS
Article Inclusion in the Meta-Analysis...26
Heterogeneity and Publication Bias...29
Diabetic Versus Non-Diabetic Controls: Comparison by Cognitive Abilities...31
Diabetic Versus Non-Diabetic Controls: Test-By-Test Meta-Analysis...33
Moderator Variables Analyses...34
IV. DISCUSSION Cognitive Ability Analyses...39
Test-By-Test Analyses...42
Moderator Variables Analyses...43
Limitations...45
Future Research...46
Conclusion...48
APPENDICES Appendix A Glossary of Cognitive Abilities with Classification...50
Appendix B Meta-analysis Code Book...63
REFERENCES... ...70
viii
LIST OF TABLES
ix
LIST OF FIGURES
Figure 1 Flow Chart of Article Inclusion...26 Figure 2 Average Cohen’s d and 95% confidence intervals for cognitive abilities for diabetics versus non-diabetic controls comparison...32 Figure 3 Average Cohen’s d and 95% confidence intervals for selected
1
CHAPTER I
INTRODUCTION AND REVIEW OF THE LITERATURE
Many studies have reported modest deficits in multiple cognitive abilities in
individuals with type 2 diabetes mellitus (T2DM) compared to nondiabetic controls
(Awad, Gagnon & Messier, 2004). However, there are differences between studies in the
cognitive abilities found to be affected and the severity of cognitive deficits reported. The
differences in study results are likely related to variability in demographic measures,
T2DM characteristics, neuropsychological tests used to measure cognitive impairments,
and study methodologies (Biessels, Deary & Ryan, 2008; Brands et al., 2007).
Inconsistencies from one study to another in terms of the cognitive deficits
associated with T2DM may arise from variations in what domains were assessed and how
(Ryan & Geckle, 2000b). There is also a selection bias towards healthy participants as
many researchers are interested in preventing cognitive impairments in T2DM, with the
consequence of excluding poorly controlled diabetics, diabetics with co-morbid
conditions, and diabetics who are already cognitively impaired prior to the beginning of a
study (Cukierman, Gerstein & Williamson, 2005; Ryan, 2006). Consequently, the
cognitive abilities affected in T2DM and the severity of cognitive deficits present are still
unclear.
This review of the literature will encompass four sections. First, a brief overview
of the etiology, complications, and treatments of T2DM will be given. Second, a review
of the importance of T2DM to cognitive impairment and dementia will be elaborated.
Third, a brief overview of the cognitive deficits most often present in T2DM, as well as
2
of the findings linking the various disease and demographic variables to cognitive
impairment in T2DM will be presented.
Type 2 Diabetes Mellitus
T2DM is the end result of a process that makes the body incapable of absorbing
glucose because body tissues have become insulin resistant and can no longer produce
enough insulin to keep glucose levels in the optimal range for proper metabolic
functioning. Hyperglycemia (elevated blood glucose levels) is the indication of the
presence of T2DM. Treatments for T2DM aim to keep blood glucose levels within the
optimal range in order to prevent the complications of diabetes that result from
chronically elevated blood glucose levels.
T2DM develops in stages that overlap (Defronzo, Bonadonna & Ferrannini,
1997). First there is insulin resistance, a stage in which the tissues of the body become
progressively more resistant to insulin. Age and obesity contribute to the development of
insulin resistance and together account for 35% of the variance (Defronzo et al.). In the
second stage, insulin resistance is followed by hyperinsulinemia (increased insulin
production and secretion), which occurs to compensate for the insulin resistance and to
maintain normal glucose levels. In the third and final stage, the body is no longer able to
compensate as the cells of the body become so insulin resistant that the insulin producing
beta-cells in the pancreas are no longer able to produce enough insulin to maintain
glucose homeostasis.
When optimal fasting glucose levels can no longer be maintained (4.0 to 6.0
mmol/l), glucose intolerance (pre-diabetes) develops. This is a condition in which fasting
3
the levels found in overt T2DM (equal or greater than 7.9mmol/l). Finally, overt T2DM
develops (Kumari, Brunner & Fuhrer, 2000). The development of T2DM is related to
increasing age, genetics, poor diet, physical inactivity, and obesity (Pradhan, 2007).
Treatment for T2DM is aimed at maintaining normal glucose levels in order to
prevent the secondary complications of diabetes, including cardio- and cerebrovascular
disease (atherosclerosis, heart attack, and stroke), nephropathy (kidney damage),
retinopathy (damage of the small blood vessels of the retina which can lead to blindness),
and neuropathy (peripheral nerve damage, that usually affects the legs and feet and can
lead to infection and amputation; Brands et al., 2007). These complications result from
chronically elevated blood glucose levels.
Initially, T2DM can be treated with lifestyle modifications including changes in
diet, increased level of physical activity, and cessation of unhealthy behaviours such as
smoking. In the beginning stages of the disease these changes can be sufficient to
maintain target blood glucose levels. As the disease progresses, treatment with oral
hypoglycemic drugs is first required, and as the disease progresses further the vast
majority of type 2 diabetics need insulin injections to continue to achieve the target blood
glucose levels needed to prevent complications related to the disease (Brands et al.,
2007).
Whereas T2DM usually develops in middle to late adulthood, Type 1 Diabetes
Mellitus (T1DM) typically develops in childhood or early adulthood. T1DM is caused by
an autoimmune-mediated destruction of pancreatic β-cells. T1DM has a stronger genetic
component than T2DM. The onset of T1DM is sudden, not gradual as in T2DM, and
4
injections are the only treatment option currently available to those with T1DM (Biessels
et al., 2008).
The Importance of T2DM, Cognitive Impairment, and Dementia
Throughout the world, approximately 285 million people have been diagnosed
with diabetes and seven million people receive a diagnosis of diabetes each year (CDA,
2011). This will raise the world prevalence to 438 million by 2030 (CDA). In Canada,
more than 9 million people have diabetes or pre-diabetes (CDA). The proportion of
individuals with T2DM is 90% as compared to 10% in T1DM (CDA).
The relative percentage of diabetics who are older than 65 is growing. In 2000,
individuals 65 years of age and older made up 40% of all cases of diabetes in the United
States; this percentage is expected to rise to 50% by 2025, and 60% by 2050 (Boyle et al.,
2001). Munshi et al. (2006) reported that cognitive dysfunction (defined by poor
performance on neuropsychological measures) is present in 30-40% of diabetics 70 years
of age and older.
Individuals with T2DM are almost two times more likely to develop dementia,
and those with insulin-treated diabetes are four times more likely, when compared to
non-diabetic controls (Ott et al., 1999). This difference in relative risk for dementia likely
reflects the fact that the need for insulin injections is an indicator of more severe diabetes.
It has been estimated that 7 to 13% of all cases of dementia can be attributed to diabetes
(Biessels et al., 2008). Individuals with diabetes have a 1.2 to 2.3 times greater risk for
Alzheimer’s disease and a 2.2 to 3.4 times greater risk for vascular dementia than
5
These trends need not exist; the development of T2DM can be prevented
(Hussain, Claussen, Ramachandran & Williams, 2007), and therefore the cognitive
deficits present in the disease are also preventable. T2DM is a modifiable risk factor for
dementia: prevention and proper management of T2DM could lower the number of cases
of dementia that develop in the population.
Because T2DM is a modifiable risk factor for dementia, it is imperative that we
improve our understanding of the mechanisms that increase the risk of cognitive deficits
in diabetes. This is necessary to enable the identification of the individuals with diabetes
who are at the greatest risk of developing cognitive deficits to improve the management
and prevention of cognitive deficits and dementia in these individuals.
The Cognitive Impairments Present in T2DM
The most common and severe cognitive impairments in T2DM are found in
verbal delayed memory (Awad et al., 2004; Arvanitakis, Wilson, Bienias, Evans &
Bennett, 2004; Biessels et al., 2008) and processing speed (Awad et al.; Biessels et al.;
Brands et al., 2007; Saczynski et al., 2008;). Awad and colleagues (2004) found that 35%
of studies reported delayed verbal memory impairments and 45% of studies reported
processing speed impairments.
Findings on cognitive impairment in T2DM have been inconsistent for immediate
memory (Awad et al., 2004; Biessels, van der Heide, Kamal, Bleys & Gispen, 2002),
nonverbal memory (Awad et al.; Cosway, Strachan, Dougall, Frier, & Dreary, 2001),
arithmetic (Awad et al.), verbal fluency (Awad et al.), and executive function (Awad et
6
memory, auditory and visual attention, and language abilities are usually found to be
intact (Awad et al.).
A recent longitudinal study found significant differences between individuals with
T2DM and controls on measures of information processing speed, attention, and
executive functions at baseline and at follow-up four years later, but no differences on a
composite score of memory measured using verbal and nonverbal memory tests (van den
Berg et al., 2010). This study and many others (see Awad et al., 2004) have found
inconsistent results in the cognitive domains and abilities that show deficits in T2DM. A
meta-analysis of recent methodologically sound studies is needed to aid in determining
which cognitive abilities are most often impaired in T2DM and to what magnitude.
A meta-analysis of adults with T1DM found significant differences in overall
cognition, intelligence, processing speed, psychomotor efficiency, visual and sustained
attention, cognitive flexibility, and visual perception between diabetics and non-diabetic
controls (Brands, Biessels, De Hann, Kappelle, & Kessels, 2005). Learning and memory,
divided and selective attention, and language did not differ significantly between
diabetics and controls. The authors looked at the effects of three disease variables
(microvascular complications, poor metabolic control, and severe hypoglycemic
episodes) on cognitive abilities. Only microvascular complications were found to
contribute to cognitive dysfunction (Brands et al.). A meta-analysis of children with
T1DM reported a similar pattern of differences in cognitive functions between diabetics
and non-diabetic controls, in that children with T1DM showed impairments in overall
cognition, intelligence, processing speed, psychomotor efficiency, attention and executive
7
not show any significant differences between children with T1DM and non-diabetic
controls (Gaudieri, Chen, Greer, & Holmes, 2008).
The cognitive functions affected in T1DM are not all the same as those affected in
T2DM (Awad et al., 2004, Biessels et al., 2008) due to differing etiologies, pathogenesis,
and demographic factors in individuals with T1DM and in individuals with T2DM.
Therefore, the results from meta-analyses of cognitive dysfunction present in T1DM do
not generalize to T2DM and a meta-analysis of studies of the cognitive dysfunction in
T2DM is needed to discern the pattern and magnitude of this dysfunction in T2DM as has
been done with the meta-analyses of T1DM.
Two reviews in the last decade have looked at cognitive impairments in T2DM.
Awad and colleagues (2004) reviewed studies examining the cognitive impairments in
T2DM in research published in 2002 and earlier. Their conclusions are very important for
our understanding of the impairments found in T2DM. However, their study was a
review, not a meta-analysis. Meta-analysis will quantify differences in cognitive
functioning between type 2 diabetics and non-diabetic controls. This information is
needed to understand better the magnitude of cognitive dysfunction in T2DM.
A second review was conducted that looked at studies published before March
2008 (van den Berg, Kloppenborg, Kessels, Kappelle & Biessels, 2009). This review
looked at the individual effects of T2DM, hypertension, dyslipidemia, and obesity on
cognition. Median effect sizes were calculated where possible for a small portion of the
studies included in the review. T2DM was found to affect processing speed (Cohen’s d =
-.40), attention (Cohen’s d = -.50), and memory (Cohen’s d = -.30) as broad cognitive
8
Van den Berg and colleagues (2009) classified studies according to very broad
cognitive domains based on those specified by Lezak, Howieson, & Loring (2004).
Because of the classification method used, many studies with valuable information on
cognitive functioning in T2DM were excluded from the review and from the effect size
calculations because the data could not be classified into one of the specified cognitive
domains.
The classification of cognitive abilities in the present study as opposed to
cognitive domains, described below, allowed for a larger number of studies to be
included in the meta-analysis and for more detailed information about the cognitive
functioning in T2DM to be measured. In addition, many more studies have been
published since March 2008 and the present study incorporated these new findings.
Moderator Variables: Disease and Demographic Variables
The presence of diabetes alone may not be sufficient to cause cognitive
dysfunction, as not all Type 2 diabetics have clinically significant levels of cognitive
dysfunction (Munshi et al., 2006). Many demographic and disease variables are
associated with increased risk for cognitive impairment in type 2 diabetics. The specific
contributions of these variables to cognitive dysfunction in T2DM are also unresolved.
Within meta-analysis, these disease and demographic variables are among a larger group
of variables known as moderator variables (Hunter & Schmidt, 2004). In meta-analysis,
analysis of moderator variables is intended to explain the heterogeneity found in
individual studies to clarify why individual studies that focus on the same subject with
the same research question often find different results. Moderator variables can be
9
The theory driven moderator variables hypothesized to contribute to the heterogeneity of
results in studies of cognitive dysfunction in T2DM include chronic hyperglycemia
(elevated HbA1c), age, duration of illness, treatment modality, presence of diabetes
complications, diagnosis of depression, and/or hypertension. Each will be discussed in
turn.
Chronic hyperglycemia. Hyperglycemia (high blood glucose levels) is a cardinal
feature of diabetes that has been shown to cause cognitive impairments (Saczynski et al.,
2008; Kumari et al., 2000). Acute hyperglycemia has been demonstrated to have some
important effects on cognitive function, although they are transient and normal cognitive
function returns within 90 minutes of re-establishing normal blood sugar levels
(Sommerfield, Dreary & Frier, 2004). Acute hyperglycemia is a common occurrence in
those with T2DM; it can affect information processing speed, working memory, and
attention. Individuals with T2DM may experience transient cognitive deficits that can
impact their daily functioning (Sommerfield et al.). The present study excluded studies
that have looked at the effects of acute hyperglycemia on cognitive functioning because
the goal of the current study was to establish the level of persistent cognitive impairment
in T2DM, not the transient impairment that is caused by acute hyperglycemia.
Chronic hyperglycemia, which is measured with Hemoglobin A1c (HbA1c), has a
negative impact on cognitive functioning that is not reversible. HbA1c is a
straightforward blood test that measures blood glucose levels over a three month period.
It measures the glucose levels in the oxygenated hemoglobin of red blood cells, which are
replenished in the body, every three months (Manschot et al., 2006). The severity of
10
al., 2006). Ryan and colleagues (2006) demonstrated a moderate improvement in
day-to-day cognitive functioning in those with T2DM without significant cognitive impairment
when better control of glucose levels was achieved. However, alleviating chronic
hyperglycemia did not reverse already present cognitive impairment (Awad et al., 2004;
Kumari et al., 2000; Ryan et al.).
Chronic hyperglycemia has been shown to have many neurodegenerative effects
on the brain. First, hyperglycemia accelerates the development of advanced glycation
end-products (AGEs) in the brain above the levels seen in normal aging by exacerbating
oxidative stress (Biessels et al., 2002). AGEs are considered to be markers of protein
aging and occur normally through metabolism and aging (Whitmer, 2007). However,
excessive levels of AGEs are associated with neuropathology. AGEs are thought to be
one of the pathways through which chronic hyperglycemia leads to diabetic
complications (Singh, Barden, Mori & Beilin, 2001). AGEs are found in beta-amyloid
plaques, a hallmark of Alzheimer’s disease (AD), and have been shown to increase
plaque deposition in AD brains (Kumari et al., 2000). AGEs impair neuronal functioning
by causing apoptosis, calcium influx, and inhibition of oxidative phosphorylation (Munch
et al., 1998). AGEs are also found in the hippocampus and in neurofibrillary tangles
(NFT), another hallmark of AD (Vitek et al., 1994).
Chronic hyperglycemia reduces hippocampal synaptic plasticity and causes
decreases in regional cerebral blood flow, abnormalities in brain uptake and metabolism
of glucose, abnormalities in aminergic neurotransmitter pathways, depressed transport of
11
Geckle, 2000b). The reduction in hippocampal synaptic plasticity is reversible with
proper glycemic control (Whitmer, 2007).
Age. Most type 2 diabetics do not begin to show cognitive decline until later in
life. Those who show cognitive decline early on tend to have comorbid conditions and
poorly controlled diabetes (Awad et al., 2004; Biessels et al., 2008; Bruce et al., 2008;
Ryan &Geckle, 2000b). For this reason, only studies focusing on participants with an
average age of 50 years or greater, or those studies focusing on individuals above 40
years of age when the average age of participants was under 50 years, were included in
the present study. This was done to reach conclusions about cognitive dysfunction in
T2DM that reflect the levels likely to be seen in the type 2 diabetic population.
There could be a synergistic relationship between the effects of T2DM and the
effects of aging on cognition and the central nervous system (Ryan &Geckle, 2000b).
Pirttila, Jarvenpaa, Laippala, and Frey (1992) found that 36% of those who were less than
65 years of age with T2DM and hypertension had brain atrophy, compared to only 12%
of those of the same age who did not have diagnoses of either T2DM or hypertension.
Showing the effects of age, 71% of those with T2DM and hypertension who were 65 and
older had brain atrophy compared to only 42% of those who did not have diagnoses of
either T2DM or hypertension. Similarly, greater proportions of older individuals with
T2DM alone, when compared to younger individuals with T2DM alone, would be
expected to show brain atrophy (Ryan & Geckle, 2000b). The brain’s capacity to function
optimally declines with age and declines further in the presence of T2DM (Ryan &
12
The cognitive decline in T2DM has been characterized as accelerated aging. That
is, the patterns of decline observed in T2DM are similar to those seen in the normal aging
process, but they occur earlier than expected (Keefover, 1998; Tisserand & Jolles, 2003).
It has been estimated that the effect of T2DM on the brain is equivalent to 3 years of
aging (Okereke et al., 2008). Arvanitakis, Wilson, & Bennett (2006) found that deficits in
semantic memory in diabetics were equivalent to the effects of 14 years of aging, and
impairments in processing speed were equivalent to 6 years of aging.
Duration of illness. The length of time an individual has had T2DM impacts
cognitive functioning. Generally, when there is a longer duration of the disease there is a
higher risk of cognitive impairment (Ebady, Arami, & Shafigh, 2008; Sastre & Grimley,
2003; Saczynski et al., 2008; van Harten et al., 2007). Studies that look at newly
diagnosed T2DM versus T2DM with a longer duration have found T2DM duration to be
strongly associated with worse cognitive performance and greater decline in general
cognition, verbal memory and category fluency (Okereke et al., 2008). Compared to
those with normal blood sugar levels, those with T2DM had poorer processing speed, and
those with T2DM for greater than 15 years had poorer processing speed and executive
functioning (Saczynski et al.). Lastly, T2DM duration has been related to atrophy and
white matter lesion severity, after adjusting for age (Manschot et al., 2006). In addition to
this main effect of duration of illness on cognitive impairment in T2DM, illness duration
interacts with age and diabetic control, that is, whether or not the individual has
experienced chronic hyperglycemia.
Treatment modality. Much more research is needed to properly evaluate the
13
and insulin injections) on cognition. When studies examine the differences between
treated (with any of the three treatment modalities) and untreated diabetes, individuals
with treated diabetes outperform individuals with untreated diabetes because treated
diabetes allows for better control of blood glucose levels (Bruce et al., 2008). When
studies examine the cognitive functioning of individuals with diabetes based on the
treatment modality they use to control their diabetes, those taking insulin injections have
the greatest risk for cognitive impairment (Saczynski et al., 2008). Ott and colleagues
(1999) found that individuals with insulin treated diabetes had a 4.7 times greater risk of
cognitive impairment than non-diabetics, whereas individuals with newly diagnosed
diabetes had only a 1.3 times greater risk. At the time the study by Ott and colleagues was
done, those with newly diagnosed diabetes would typically have been treated with diet
and exercise or with hypoglycemic medications, but not with insulin injections. Therefore
the comparison between insulin-treated and newly diagnosed diabetics in this study (Ott
et al., 1999) very likely is also a comparison between insulin-treated and
non-insulin-treated diabetes.
Complications. The presence of diabetic complications greatly increases the
probability that cognitive impairments will be present (Saczynski et al., 2008). For
example, Ryan (2006) found that diabetics with retinopathy showed cognitive decline
over the course of the study, whereas diabetics without retinopathy showed no change.
Retinopathy has also been linked to cortical atrophy (Manshot et al., 2007). It has been
argued that cognitive impairments should be classified as a complication of T2DM
(Cukierman, et al., 2005). Those with T2DM are at higher risk for macrovascular and
14
al.). Diabetics are at greater risk for macro- and microvascular damage because of the
pathological effects of hyperglycemia on the body. Macrovascular damage leads to
cardio- and cerebrovascular disease, which can directly cause cognitive impairment in
T2DM, and microvascular damage is indexed by neuropathy, nephropathy, and
retinopathy in T2DM (Saczynski et al.). The present study had the goal of including
studies where retinopathy and atherosclerosis were the diabetes complications evaluated.
Depression. Individuals with diabetes are two times more likely than
non-diabetics to develop depression severe enough to warrant clinical intervention (Anderson,
Freedland, Clouse & Lustman, 2001; Kolt & Seaquist, 2008). As many as one in three
individuals with diabetes may have depression symptoms severe enough to affect quality
of life, impair functioning, affect adherence to medical treatments, affect glycemic
control, and increase the risk of complications (Anderson et al.). Having both T2DM and
depression increases the number of depressive episodes, worsens glucose control, and
increases diabetic complications (Blazer, Moody-Ayers, Craft-Morgan & Bunchett,
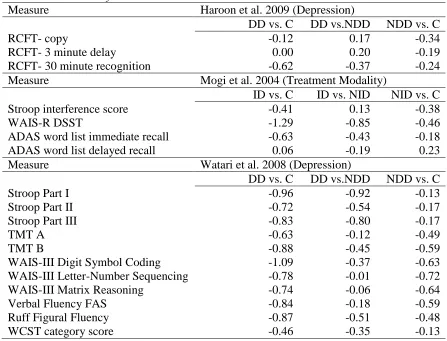
2002). Watari and colleagues (2006) measured cognitive deficits in those with T2DM and
diagnosed major depression, in those with T2DM alone, and in normal controls. They
found that those with both depression and T2DM had poorer attention, executive
function, and information processing speed than normal controls. Although there were no
statistically significant differences between those with both depression and T2DM and
those with diabetes alone, the scores of those with diabetes alone on the measures of
cognitive functioning were better than those of individuals with both depression and
15
differences in HbA1c between the diabetics with or without depression, suggesting some
independent effects of depression.
Hypertension. Hypertension has been associated with changes in cognitive
functioning on measures of attention, learning and memory, executive functions,
visuospatial skills, psychomotor abilities, and perceptual skills (Waldstein, 2003). Most
studies of the cognitive effects of T2DM statistically control for the presence of
hypertension by including hypertension as a covariate, which sometimes alters the results
(van Harten et al., 2007) and other times does not (Manschot et al., 2006). An important
finding is that diabetics with hypertension have greater brain atrophy than hypertensives
or diabetics alone (Parttila et al, 1992). Diabetics with hypertension have a greater chance
of cognitive decline than diabetics without hypertension (Bruce et al., 2008; Hassing et
al., 2004). Systolic blood pressure levels have been shown to mediate the relationship
between T2DM and impairments in episodic memory and processing speed (McFall,
Geall, Fischer, Dolcos & Dixon, 2010).
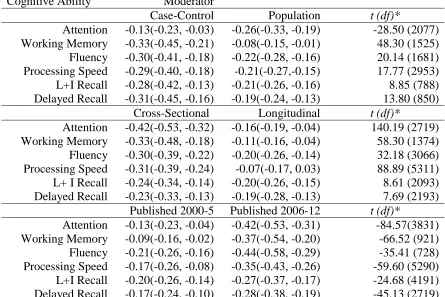
Moderator Variables: Methodological Variables
In addition to the theory driven disease and demographic moderator variables, in
the present study, separate meta-analyses were completed for three methodological
variables. First, sampling method was evaluated by contrasting population studies to
case-control studies. Second, study design was evaluated by contrasting longitudinal
studies to cross-sectional studies. Lastly, study publication year was evaluated by
contrasting studies according to the year in which data were published, or, in the case of
longitudinal studies, the years in which baseline data were collected. Studies were
16
functioning in T2DM have found these variables to have differing effects across studies
(Awad et al., 2004; van den Berg, et al., 2009).
Present Study
The first goal of the current meta-analysis was to determine the level of overall
deficits in cognitive abilities in individuals with T2DM compared to non-diabetic controls
and to identify the abilities in which those with T2DM showed the greatest deficits
relative to non-diabetic controls to clarify the findings in the literature. Only studies in
which diabetics had an average age of greater than 50 years were included. It was
hypothesized that individuals with T2DM have specific impairments in some cognitive
abilities but not others when compared to non-diabetic controls and that the abilities
likely to show the greatest deficits were delayed verbal memory and processing speed
(Awad et al., 2004).
The second goal was to identify the neuropsychological tests with the largest
differences in effect sizes between diabetics and non-diabetic controls in order to inform
clinicians about which tests to use to measure cognitive deficits in T2DM. The addition
of routine screenings of cognitive functioning to T2DM treatment regimens has been
advocated by several authors (Cukierman, et al., 2005; Ebady et al., 2008; Murthy,
Jawaid & Schulz, 2008; Sastre & Grimley, 2003). In order to make routine screenings
feasible, the tests that best measure cognitive dysfunction in T2DM need to be identified.
The identification of these tests will be an important first step in improving diabetes
patient care in order to reduce the risk for the development of cognitive impairment and
17
A third goal was, insofar as the data permitted, to evaluate the possible effects of
single moderator variables including age, diabetes duration, HbA1c levels,
insulin-dependent or non insulin-insulin-dependent status, presence of complications (atherosclerosis or
retinopathy), presence of depression, presence of hypertension, sampling method, study
design, and publication year. Those with diabetes who are older (Ryan & Geckle, 2000b),
have had diabetes longer (Ebady et al., 2008), have higher HbA1c levels (Munshi et al.,
2006), are insulin-dependent (Saczynski et al., 2008), have complications (Manshot et al.,
2007), have diagnoses of clinically important depression (Watari et al., 2006), and have
diagnoses of hypertension (Bruce et al., 2008) were hypothesized to have greater deficits in
cognitive functioning than those who do not have these factors. Participants recruited to
studies with a case-control sampling method, with cross-sectional designs, and with a
publication year of 2000 to 2005 were expected to have greater deficits in cognitive
functioning than participants recruited to studies with a population sampling method,
with longitudinal designs, and with a publication year of 2006 to 2012 (Awad et al.,
2004; van den Berg, et al., 2009).
In conclusion, the overall purpose of the present study was to clarify and quantify
the nature and pattern of cognitive deficits present in T2DM by comparing cognitive
functioning in demented individuals with T2DM to that of demented and
18
CHAPTER II
METHOD Selection of Studies
Search engines and search strategy. The MedLine Ovid search engine was used
to identify studies of cognitive functioning in individuals with T2DM versus non-diabetic
control participants or studies comparing different type 2 diabetic patient groups. The
PsycInfo search engine then was used to locate any studies not found using the MedLine
Ovid engine. Medline and PsycInfo were search for articles published from January 1st
2000 up to May 3rd 2012. Reference lists from reviews found in the initial search and from published studies included in the meta-analysis were then searched to identify
additional studies.
Key words to be used. The following key words were used to search for relevant
articles: cognition, attention, learning, memory, executive functioning, information
processing, spatial, intelligence, neuropsychological, and neurocognitive in order to find
studies that have measured cognitive functioning in some manner. These key words were
combined with diabetes, type 2 diabetes, type 2 diabetics, age, depression, duration,
complications, retinopathy, atherosclerosis, treatment modality, hypertension, and
hyperglycemia. These words identified relevant studies on T2DM for the diabetic and
non-diabetic control comparison and for the analyses of the moderator variables.
Inclusion and exclusion criteria. Article titles, abstracts, and full-text where
necessary, were examined to establish whether studies fulfilled the following inclusion
criteria: (a) human participants were used, (b) the study was published or available in
English after 2000 inclusive, or was a longitudinal study in which baseline data was
19
years or who were over the age of 40 years and diagnosed with T2DM, (d) the study had
defined diabetes and control groups, (e) the study assessed cognitive abilities with
standard neuropsychological tests, (f) the study assessed cognitive abilities when blood
glucose levels were in the normal range, (g) the study reported original research in which
test scores were presented for the experimental and control groups (means and standard
deviations) or statistics such as the exact t or F values were given in order for effect sizes
to be calculated, (h) participants from individual studies did not overlap with any other
study included in the meta-analysis, and (i) the study excluded individuals with diagnosed
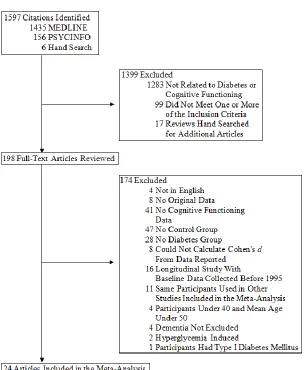
dementia (see Figure 1).
Likewise, article titles, abstracts, and full-text where necessary, were examined to
exclude studies based on the following criteria: (a) non-human subjects were used, (b) the
study was published before 2000 in languages other than English or was a longitudinal
study in which baseline data were collected prior to 1995, (c) the study included children
or adults with a mean age under 50 years or participants under the age of 40 years or who
had diagnoses of T1DM or gestational diabetes, (d) the study did not assess cognitive
abilities using standard neuropsychological tests or assessed functioning with measures
other than standard neuropsychological tests of cognitive ability (eg., measures of sensory
functioning, socioemotional adjustment, quality of life, and activities of daily living
performance), (e) studies that assessed cognitive abilities when hypoglycemia or
hyperglycemia were induced, (f) studies that were reviews and not original studies or that
were original studies but did not report the necessary statistics to allow for calculation of
20
included in the meta-analysis, and (i) the study did not exclude individuals with
diagnosed dementia.
Measures and Coding
Cognitive ability classification. Cognitive abilities were classified and measured
in three ways. First an overall measure of the difference in performance between diabetic
and non-diabetic groups across all cognitive abilities (general cognitive functioning) was
calculated. The general cognitive functioning effect size is the average difference in
scores between relevant groups across all cognitive abilities assessed across all studies.
Second, differences between diabetic and non-diabetic groups on each cognitive ability
were calculated (refer to Figure 2 for a list of all cognitive ability effect sizes calculated).
Third, effect sizes for the differences between the diabetic and non-diabetic groups on
neuropsychological measures that were used frequently enough across studies were
calculated (refer to Figure 3 for a list of these tests).
To establish the classification of tests by the cognitive abilities measured, scores
from each test were classified as belonging primarily to a specified cognitive ability. This
was done according to Strauss, Sherman, and Spreen (2006) or Lezak and colleagues
(2004) if the particular test score was not described in Strauss and colleagues. If a test
was not found in Strauss et al. or Lezak et al. the classification from the study that used
the measure was recorded and used to assign a cognitive ability to those measures. All
measures used across studies included in the meta-analysis were assigned a cognitive
ability with the reference page number supporting each choice documented. These
classifications were then reviewed with a second subject matter expert (Dr. Anne Baird).
21
ability involved was reached, and all measures in the studies used in the meta-analysis
ultimately were added to the master list shown in Appendix A. This approach was
undertaken because there is not always an agreed upon or clear cut classification of a
score from a given test.
Scores on the neuropsychological tests were classified as belonging to one the
following cognitive abilities: focused attention, divided attention, selective attention,
motor speed, processing speed/psychomotor efficiency, visuospatial/visuoconstructional,
working memory, non-verbal reasoning, shifting, inhibition, semantic memory, verbal
and visual learning and immediate recall, verbal and visual delayed recall, story learning
and immediate recall, story delayed recall, verbal phonemic fluency, verbal semantic
fluency, and design fluency (see Appendix A for a description of how these cognitive
abilities were used to calculate effect sizes and which measures were included within
each of them).
Coding for moderator variables. Study methodology was coded for sampling
method used (population or case-control) and for design type (longitudinal or
cross-sectional). Publication year of each study or the year data was collected for longitudinal
studies was recorded. Type of control group (non-diabetic or subset of diabetes patient
group corresponding to one of the moderator variables) was coded along with inclusion
and exclusion criteria. Age of the study participants was coded in years based on the
mean (or median when available) age reported in individual studies. Sample size was
recorded and used as a weight in the meta-analyses.
HbA1c level was coded based on the mean levels reported in each study. Fasting
22
duration was coded as the number of years since diagnosis based on the mean number of
years reported in each study. Insulin-dependent or non insulin-dependent diabetic status,
presence of complications, diagnosis of depression or hypertension and publication year
were coded as dichotomous variables (present or not present). Treatment modality for the
insulin dependent/non-dependent variable, nature of complications (only studies that have
measured complications with retinopathy or atherosclerosis were included), criteria or
method for diagnosis of depression and hypertension and treatment status (i.e., whether
treated or untreated for depression and hypertension), were recorded.
For the continuous theory driven moderator variables (age, HbA1c level, diabetes
duration), in addition to studies that looked specifically at these variables, individual
studies were coded based on the range of values of each of these variables in an
individual study for their inclusion in the moderator variable meta-analyses.
Unfortunately, few studies reported the range of values or the range of values overlapped
so that most studies could not be coded in this manner, as discussed in the results. See
Appendix B for detailed coding criteria.
Statistical Analyses
Effect size calculation. Effect sizes (Cohen's d), representing the difference
between the diabetic group and non-diabetic control group or the difference between
subsets of diabetes patient groups in standard deviation units, were calculated for every
score on the neuropsychological tests in individual studies. For the diabetic group and
non-diabetic control group this was done for the scores that were classified by cognitive
ability and on a test by test basis. For the moderator variable analyses this was done only
23
To accomplish the first goal of the present study, average d values were calculated
for general cognitive functioning and each cognitive ability to determine the differences
on these measures between the diabetic and the non-diabetic control groups. To
accomplish the second goal of the present study, identifying the tests that are best able to
measure cognitive deficits in T2DM, in instances where enough studies used the same
neuropsychological test, the effect sizes for each of these tests were analysed to
determine their ability to measure cognitive deficits in individuals with T2DM. These
calculations were only done for the diabetes and non-diabetic control comparisons.
To accomplish the third goal, separate meta-analyses for cognitive deficits
according to the hypothesized methodological moderator variables (sampling method,
design, and publication year) were completed to compare subgroups of diabetic
individuals on scores of classified cognitive abilities according to Hunter and Schmidt
(2004, p.293). The calculations for these comparisons were the same as those completed
for the diabetic and non-diabetic comparison (pp. 287-88). All other hypothesized
moderator variable meta-analyses (diabetes duration, HbA1c levels, insulin-dependent or
non insulin-dependent, presence of complications, and presence of depression or
hypertension) could not be done due to lack of published studies looking at these
moderator variables.
The individual effect size calculations were based on equations from Holmes
(1984, equations 1, 18, and 21). Holmes uses the control group standard deviation for
Cohen’s d calculation. The use of control group standard deviations is recommended
when population data are used to calculate effect sizes (Hunter & Schmidt, 2004). The
24
deviations to calculate effect sizes. When sample standard deviations are used, it is
recommend that a pooled standard deviation be calculated from the experimental and
control group standard deviations, as this reduces error (Hunter & Schmidt). Therefore in
the present study, a pooled standard deviation weighted for sample size was calculated
from the diabetes group and control group standard deviations, and this pooled standard
deviation was used in all individual Cohen’s d calculations. The average effect size
calculations weighted for sample size were based on equations from Hunter and Schmidt
(pp. 287-88). Ninety-five percent confidence intervals were also reported. The number of
studies and number of participants for each test score or cognitive ability classified was
reported as not every study contained all tests or all cognitive abilities.
In meta-analyses comparing the diabetic group to non-diabetic controls, the
diabetic group was the target group and negative effect sizes indicate that the diabetic
group performed worse that the non-diabetic control group. For the moderator variable
meta-analyses, the diabetes group of interest based on the moderator variable coded was
the target group. Negative effect sizes indicate that the diabetic group of interest for a
given coded moderator variable performed worse than the diabetic control group for that
variable. A p value equal or less than 0.05 indicated a significant difference between
groups. Coding and calculations were done by the primary investigator (M.M.). Twelve
of the twenty-four studies included in the meta-analysis were independently coded by a
research assistant (R.A.). There were 16 initial differences between the coding of M.M.
and the R.A. (13 omissions and three errors) out of 2220 units of information coded from
the 12 studies. All differences in coding were resolved by consensus between M.M. and
25
Statistic Q and fail-safe N. The statistic Q was calculated to determine the
heterogeneity of the effect sizes in the sample of studies used in this meta-analysis
(Hedges & Olkin, 1985; formula in Hunter & Schmidt, 2004, p. 416). This statistic has
been criticized for its low power (National Research Council, 1992); therefore a less
conservative p value of 0.10 was used. To rule out the possibility of publication bias
influencing study results the fail-safe N was calculated to estimate the number of
unpublished studies with null results needed to falsify any significant results that were
found (Hunter & Schmidt, pp. 500-1). Publication bias should not be a problem in this
study as null findings are published in this area of research (Cosway et al., 2001). All
analyses were calculated in Excel by M.M. according to equations in Hunter & Schmidt
26
CHAPTER III
RESULTS
Article Inclusion in the Meta-Analysis
Twenty-four articles were included in the meta-analysis comparing individuals
with T2DM to non-diabetic controls. Figure 1 summarizes the search and exclusion
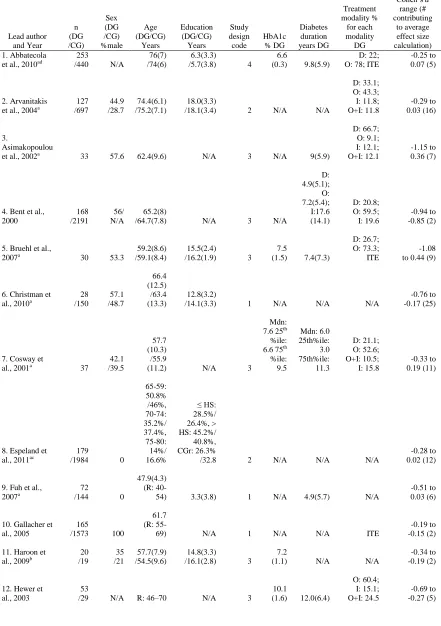
process and Table 1 summarizes the characteristics of the twenty-four included studies,
identified with an asterisk in the References. Two studies required the standard error of
the mean to be converted to standard deviations to enable inclusion in the meta-analysis
(Asimakopoulou, Hampson, & Morrish, 2002; van Elderen et al., 2010).
27 Table 1.
Characteristics of the Twenty-Four Studies Included in the Meta-Analysis
Lead author and Year n (DG /CG) Sex (DG /CG) %male Age (DG/CG) Years Education (DG/CG) Years Study design code HbA1c % DG Diabetes duration years DG Treatment modality % for each modality DG
Cohen’s d
range (# contributing to average effect size calculation) 1. Abbatecola
et al., 2010ad
253
/440 N/A
76(7) /74(6)
6.3(3.3)
/5.7(3.8) 4
6.6
(0.3) 9.8(5.9)
D: 22; O: 78; ITE
-0.25 to 0.07 (5)
2. Arvanitakis et al., 2004a
127 /697 44.9 /28.7 74.4(6.1) /75.2(7.1) 18.0(3.3)
/18.1(3.4) 2 N/A N/A
D: 33.1; O: 43.3; I: 11.8; O+I: 11.8 -0.29 to 0.03 (16) 3. Asimakopoulou
et al., 2002a 33 57.6 62.4(9.6) N/A 3 N/A 9(5.9)
D: 66.7; O: 9.1; I: 12.1; O+I: 12.1 -1.15 to 0.36 (7)
4. Bent et al., 2000 168 /2191 56/ N/A 65.2(8)
/64.7(7.8) N/A 3 N/A
D: 4.9(5.1); O: 7.2(5.4); I:17.6 (14.1) D: 20.8; O: 59.5; I: 19.6 -0.94 to -0.85 (2)
5. Bruehl et al.,
2007a 30 53.3
59.2(8.6) /59.1(8.4)
15.5(2.4)
/16.2(1.9) 3
7.5
(1.5) 7.4(7.3)
D: 26.7; O: 73.3;
ITE
-1.08 to 0.44 (9)
6. Christman et
al., 2010a /150 28 /48.7 57.1
66.4 (12.5) /63.4 (13.3)
12.8(3.2)
/14.1(3.3) 1 N/A N/A N/A
-0.76 to -0.17 (25)
7. Cosway et
al., 2001a 37
42.1 /39.5
57.7 (10.3) /55.9
(11.2) N/A 3
Mdn: 7.6 25th
%ile: 6.6 75th
%ile: 9.5 Mdn: 6.0 25th%ile: 3.0 75th%ile: 11.3 D: 21.1; O: 52.6; O+I: 10.5; I: 15.8 -0.33 to 0.19 (11)
8. Espeland et al., 2011ac
179
/1984 0
65-59: 50.8% /46%, 70-74: 35.2%/ 37.4%, 75-80: 14%/ 16.6% ≤ HS: 28.5%/ 26.4%, > HS: 45.2%/ 40.8%, CGr: 26.3%
/32.8 2 N/A N/A N/A
-0.28 to 0.02 (12) 9. Fuh et al.,
2007a
72
/144 0
47.9(4.3) (R:
40-54) 3.3(3.8) 1 N/A 4.9(5.7) N/A
-0.51 to 0.03 (6)
10. Gallacher et al., 2005
165
/1573 100
61.7 (R:
55-69) N/A 1 N/A N/A ITE
-0.19 to -0.15 (2) 11. Haroon et
al., 2009b
20 /19 35 /21 57.7(7.9) /54.5(9.6) 14.8(3.3)
/16.1(2.8) 3
7.2
(1.1) N/A N/A
-0.34 to -0.19 (2) 12. Hewer et
al., 2003
53
/29 N/A R: 46–70 N/A 3
10.1
(1.6) 12.0(6.4)
O: 60.4; I: 15.1; O+I: 24.5
28 13. Kumar et
al., 2008a /428 39 /51.2 59 /62.6(1.5) 62.6(1.2) /14.2(2.6) 13.5(2.3) 1 N/A N/A D: 20; O: 49;
I: 19; N/A: 12
-0.67 to 0.0 (8)
14. McFall et al., 2010a
41 /458 43.9 /29.3 68.6(7.2) /67.5(8.5) 15.1(3.4)
/15.3(2.9) 1 N/A 8.3(7.3)
O: 68.3; other modalities not known -0.57 to -0.02 (10)
15. Mogi et al., 2004ab 69 /27 29.6 /47.8 71.6(5.6) /73.4(6.6) 10.4(2.7)
/11.4(3.0) 3
8.0 (1.0)
N-ID : 13.7 (11.2); ID : 19.2 (12.6) N-ID: 81.2; ID: 18.8 -0.60 to 0.19 (4) 16. Ryan &Geckle
2000aa 50
30 /24
50.8(7.7) /50.5(7.4)
14.4(3.1)
/14.0(2.2) 3
10.2
(2.4) 8.1(5.9)
D: 18; O: 56; I: 26
-0.83 to 0.36 (16) 17. Toro et al.,
2009a /132 27 50.9 74.2(1.1) /13.5(3.1) 13.7(2.5) 2 (1.1) 6.9 N/A N/A -0.43 to 0.10 (4)
18. van den Berg et al., 2010ac 68 /38 47 /50 65.6(5.6)
/64.8(4.8) N/A 4
6.9
(1.1) 9.1(6.3)
D: 9; O: 62; I: 29
-0.61 to 0.02 (19)
19. van Elderen et al., 2010a
89 /438 60 /56 74.7(3.1) /75.0(3.2) 15.3(2.8)
/15.5(2.9) 2 N/A N/A
D: 27; O: 62.8; I: 12.4; O+I: 2.2 -0.32 to -0.20 (4)
20. van Harten et al., 2007a
92 /44 43.5 /45.5 73.2(5.7) /72.9(5.3) Mdn: 4(1.6) /Mdn: 4.5(1.5) Scale 1: Incomplete primary school, 7: University
degree 3 7.7(1)
13.8 (10.8) D: 1.1; O: 26; I: 71.7 -0.65 to -0.24 (15) 21. Wahlin et
al., 2002 31 /307 7 /20 85(4.2) /84.3(5.5) 8.4(2.0)
/8.7(2.7) 2 N/A N/A
D: 54.8; O: 38.7; I: 6.5
-0.54 to 0.04 (4) 22. Watari et
al., 2008ab /22 23 /18 35 /52.6(8.3) 58.7(8.1) /15.5(2.4) 15.0(3.2) 3 (1.2) 7.1 10.1(8.0) N/A -0.13 (11) -0.72 to
23. Yau et al., 2009a 24 /17 54.2 /47.1 57.2(8.1) /56.4(6.9) 15.3(2.8)
/16.1(1.8) 3
7.8
(1.9) 7.9(5.6) ITE
-0.73 to 0.08 (12) 24. Zhou et al.,
2010a 21 /19 47.6 /52.6 68(4.7) /69.2(4.7) 12.5(2.5)
/13.8(2.8) 3
8.6
(1.4) 4.7( 0.8) ITE
-1.01 to -0.28 (7)
Note. All data are mean(SD) or % unless otherwise specified. Data that are the same for the diabetes and control groups are only reported once. Mdn: median; R: range; %ile: percentile; HS: high school; CGr: college graduate; DG: diabetes group; CG: control group; Study design code 1: population, cross-sectional; 2: population, longitudinal; 3: case-control, cross-sectional; 4: case-control, longitudinal; Treatment modality D: diet; O: oral hypoglycemic; I: insulin; O+I: oral hypoglycemic and insulin; ITE insulin treatment excluded; ID: insulin dependent; N-ID: non-insulin dependent.
a studies that contributed scores to the test-by-test comparison b studies that contained theoretical moderator variable analyses
29
Heterogeneity and Publication Bias
The general cognitive functioning effect size was calculated in two ways, one in
which individual Cohen’s ds were averaged within studies before the average general
cognitive functioning effect size was calculated, and the other where individual Cohen’s
ds were not averaged within studies before calculating the average general cognitive
functioning effect size, to determine if there were differences between the two methods.
The Q statistic was significant for the diabetic versus non-diabetic comparison for general
cognitive functioning when individual Cohen’s ds were averaged within studies so that
each study in the meta-analysis only contributed one Cohen’s d to the general cognitive
functioning effect size, Q (23) = 232.91, p< .10. When the effect size for general
cognitive functioning was calculated without averaging the Cohen’s ds within studies so
that each study in the meta-analysis contributed more than one Cohen’s d to the general
cognitive functioning effect size, the Q statistic was reduced considerably but still
remained significant, Q (23) = 119.14, p< .10. The reduction in Q indicates that there is
less unexplained variance (or heterogeneity) in effect sizes across studies when individual
Cohen’s ds are not averaged within studies compared to when they are averaged.
Therefore, all subsequent effect sizes were calculated without averaging individual
Cohen’s ds within studies.
The chosen method of effect-size calculation is not ideal as it has the potential to
result in problems with independence of observations. It was chosen because of the
reduction in Q this method produced and it was also chosen to allow for the maximum number of effect sizes to be calculated. Had individual Cohen’s ds been averaged within
30
information on these four cognitive abilities would be lost. These four cognitive ability
effect sizes could not have been calculated because there would not have been at least
five individual Cohen’s ds making up these effect sizes and five is the minimum required
number of individual Cohen’s ds for a reliable average effect size to be calculated.
The theory driven moderator variables analyses could not be completed due to a
lack of published studies evaluating them. As a result, the Q statistic remained
significant. Had it been possible to complete the theory driven moderator variable
analyses further heterogeneity in effect sizes from the studies included in the
meta-analysis might have been accounted for and this could have rendered the Q statistic
non-significant.
The publication bias analysis (fail-safe N) determined that 38 unpublished studies
with null results would need to exist for the small general cognitive functioning effect
size of -.26 to be reduced to a marginal value of -.10. It is not likely that 38 unpublished
studies with null results exist in this area of research, as null results are often published in
studies of cognitive functioning in T2DM. Furthermore, 14 of the 24 studies included in
the meta-analysis had at least one null finding on measures of cognitive functioning
(Asimakopoulou et al., 2002; Bruehl et al., 2007; Christman et al., 2010; Espeland et al.,
2011; Fuh et al., 2007; Gallacher et al., 2005; Hewer et al., 2003; Kumar et al., 2008;
McFall et al., 2010; Mogi et al., 2004; Toro et al., 2009; van Harten et al., 2007; Yau et
al., 2009; Zhou et al., 2010) and four studies had only null findings (Abbatecola et al.,
31
Diabetic Versus Non-Diabetic Controls: Comparison by Cognitive Abilities
Average effect sizes with 95% confidence intervals by cognitive ability for the
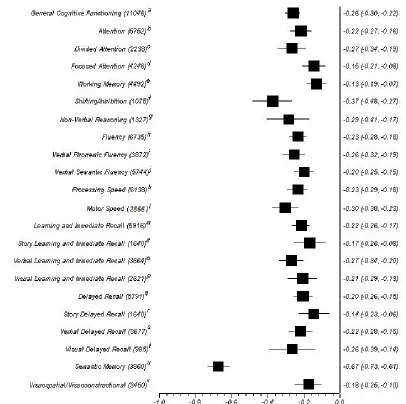
diabetic versus non diabetic comparison can be found in Figure 2. Every cognitive ability
effect size was significant (p<0.05) in the hypothesized direction, with those with T2DM
performing worse on measures of all cognitive abilities than non-diabetic controls. The
general cognitive functioning effect size was in the small range, M = .26, 95% CI [.30,
-.22]. Most cognitive ability effect sizes were in the small range. The focused attention,
working memory, story learning and immediate recall, story delayed recall, and
visuospatial/visuoconstructional ability effect sizes were in the marginal range. The
cognitive abilities with the largest effect sizes were shifting/inhibition, M = -.37, 95% CI
[-.48, -.27], which was in the moderate range and semantic memory, M = -.67, 95% CI
[-.73, -.61], which was in the moderate to large range.
The shifting/inhibition average effect size was significantly larger than the motor
speed average affect size [t(1956) = 12.99 p < 0.001], which was the next highest effect
size after the shifting/inhibition effect size. These two effect sizes differed by 0.07
standard deviation units. However, there was also a statistically significant difference
between the motor speed and non-verbal reasoning average effect sizes [t(4002) = 2.68 p
< 0.01], the next highest effect size after motor speed. These two effect sizes only differ
by .01 standard deviation units.
32
Figure 2.Average Cohen’s d and 95% confidence intervals for cognitive abilities for diabetics versus non-diabetic controls comparison.
Note. Number of participants included in the comparison is listed in brackets after each cognitive ability label. References see Table 1 for numbering: a: (1-24); b: (1-3, 6, 8, 9, 14, 16-20, 22, 24); c: (1, 3, 6, 9, 14, 16-18, 20, 22, 24); d: (1-3, 6, 8, 9, 18); e: (1-3, 5, 6, 8, 9, 16, 18, 22); f: (5,6, 14, 15, 18, 20); g: (2, 6, 7, 16, 18, 22); h: (1, 2, 5-10, 12, 18, 20-24); i: (1, 5-8, 12, 18, 20, 21, 23); j: (2, 6, 8-10, 18, 20-22); k: (1-3, 5-7, 9, 10, 12-20, 22-24); l: (8, 13, 16, 20); m: (2, 3, 5-8, 12-21, 23, 24); n: (2, 3, 5-7, 16, 17, 20, 23); o: (2, 6-8, 12,16, 18, 20, 23); p: (6-8, 16, 18); q: (2, 3, 5-9, 11, 13-20, 23, 24); r: (2, 3, 5-7, 16, 17, 20, 23); s: (5-9, 13, 15, 16, 18, 20, 23, 24); t: (6, 7, 16, 18, 19); u: (2, 4, 6, 14); v: (2, 6, 8, 11, 16, 18, 24).
33
Diabetic Versus Non-Diabetic Controls: Test-By-Test Meta-Analysis
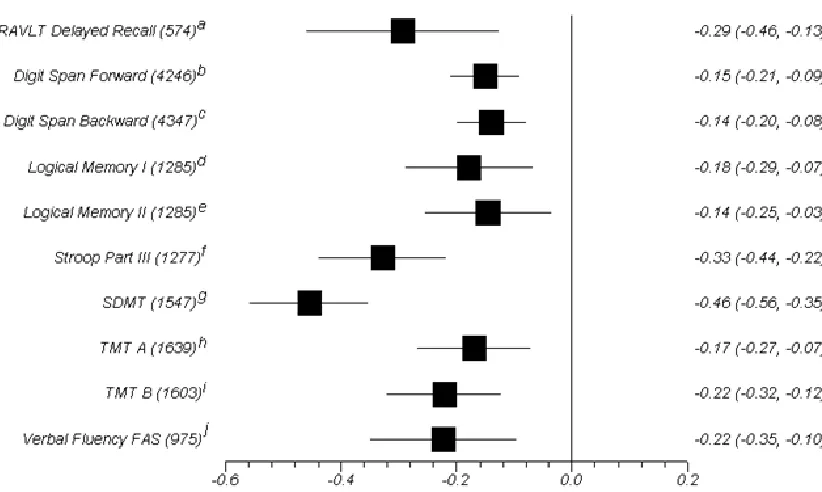
Average effect sizes with 95% confidence intervals by test for the diabetic versus
non diabetic comparison can be found in Figure 3. Average effect sizes were calculated
for every measure that was used in at least five studies. Every test effect size was
significant (p< 0.5) in the hypothesized direction, with those with T2DM performing
worse on all selected measures than non-diabetic controls. Most test effect sizes were in
the marginal to small range. The tests with the largest effect sizes, which were all in the
small to moderate range, were the Rey Auditory Verbal Learning Test (RAVLT) delayed
recall M = -.29, 95% CI [-.46, -.13], Part III of the Stroop Colour-Word test, M = -.33,
95% CI [-.44, -.22], and the Symbol Digit Modalities Test/WAIS-R Digit Symbol
Substitution Test (SDMT), M = -.46, 95% CI [-.56, -.35]. There were significant
differences between the RVALT delayed recall and Trail Making Test part B (TMT B)
t(1273) = 7.61 p < 0.001 and the RVALT delayed recall and verbal fluency FAS t(1119)
= 7.82 p < 0.001, the two tests with the next largest effect sizes after the RAVLT delayed
recall. The RAVLT delayed recall average effect size differed from the TMT B and FAS
34
Figure 3.Average Cohen’s d and 95% confidence intervals for selected neuropsychological measures for diabetics versus non-diabetic controls comparison.
Note. Number of participants included in the comparison is listed in brackets after each test label. RAVLT: Rey Auditory Verbal Learning Test; TMT: Trail Making Test; SDMT: Symbol Digit Modalities Test or the Digit Symbol Substitution Test from the WAIS-R; Digit Span Forward and Backward are from the WAIS-R, WAIS-III, or WMS-R; Logical Memory I&II are from the WMS-R; References see Table 1 for numbering: a: (7, 9, 18, 20, 24); b: (1-3, 6, 8, 9, 18); c: (1-3, 5, 6, 8, 9, 18, 23); d: (2, 3, 6, 7, 16, 23); e: (2, 3, 6, 7, 16, 23); f: (14, 16, 18, 19, 22); g: (3, 5, 6, 13-16, 23, 24); h: (1, 3, 6, 9, 17, 18, 20, 22, 24); i: (1, 3, 6, 9, 16-18, 22, 24); j: (1, 5, 20, 22, 23). *all effect sizes are significant (p< 0.05)
Moderator Variables Analyses
There were not enough studies that met inclusion criteria looking at the proposed
theoretical moderator variables for subgroup meta-analyses to be done. Table 2 shows
individual Cohen’s ds for the three studies that looked at theoretical moderator variables.
The first study looked at depression, the second study looked at insulin dependent versus
non-insulin dependent status, and the third study also looked at depression. The only
significant difference from all three studies was a lower score on the WAIS-R Digit
Symbol Substitution Test for those with insulin dependent T2DM when compared to
35
(Mogi et al. 2004). This significant difference is shown by two large range Cohen’s ds for
the difference between those with insulin dependent T2DM and non-diabetic controls
(-1.29) and those with insulin dependent T2DM and those with non-insulin dependent
T2DM (-.85). This study also found a moderate range effect size for the difference
between those with non-insulin dependent T2DM and non-diabetic controls (-.46).
Only the Watari and colleagues (2008) study showed performance consistent with
the hypotheses of the present study. In the Watari and colleagues study those with
depression and T2DM performed worse than non-diabetic controls and worse than those
with only T2DM on all measures. This finding supported the hypothesis that those with
depression and T2DM would perform lower than those with only T2DM and also lower
than controls. In addition, those with only T2DM performed worse than non-diabetic