ABSTRACT
YANG, CHUNXUE. Energy Management in Smarter Buildings. (Under the direction of Dr. Michael Devetsikiotis).
Energy consumption has been increasing remarkably during the past half century. As
buildings have become one of the major energy consumers, Smarter Buildings are gaining
an increasing attention for its great potential for global energy saving. A Smarter Building is
a building that takes advantage of the integration of improved technology and materials in
terms of structure, appliances, electrical systems, plumbing, and HVACR. To fulfill the
requirement of reducing and ultimately eliminating the impacts of buildings on the
environment and human health, renewable energy resources are widely introduced to Smarter
Buildings. However, the nature of renewable energy resources brings significant uncertainty
to the building energy system. Combined with energy storage, a variety of energy appliances
and the fluctuating energy price, smarter buildings have the nature of great randomness. To
remedy this critical issue, we conduct the research on Building Energy Management(BEM).
BEM is a computer network based on control system that monitors and manages the energy
consumption in a building. In our research, we firstly built energy consumption models for
different energy appliances in a typical commercial building, including data centers, HVAC,
random plug loads and energy storage units. We also built models for a variety of energy
resources including the general power grid and a renewable energy resource. Secondly, by
studying the above energy consumption models, we designed an algorithm for optimizing the
energy allocation to different energy appliances to achieve the objective of minimizing the
different appliances. We integrated all the models into a system and implemented the
optimization algorithm in the control units. We showed that our algorithm could help to save
© Copyright 2014 Chunxue Yang
Energy Management in Smarter Buildings
by Chunxue Yang
A thesis submitted to the Graduate Faculty of North Carolina State University
in partial fulfillment of the requirements for the degree of
Master of Science
Computer Engineering
Raleigh, North Carolina
2014
APPROVED BY:
_______________________________ ______________________________
Dr. George Michailidis Dr. David Thuente
BIOGRAPHY
Chunxue Yang was born on March 1, 1989 in Taiyuan, China. She holds a Bachelor’s degree
in Electrical Engineering, awarded in 2012, by Beijing Institute of Technology, Beijing,
China. She has been a Master’s student at North Carolina State University, in Department of
ACKNOWLEDGMENTS
I thank my parents for their love and support. They have been encouraging and helping me
when I was struggling for my study and living here in a totally new environment. I could
never have done so much without their support and faith.
I am deeply grateful to my adviser Dr. Michael Devetsikiotis for his supervision. He has
always been patient and supporting during my study. He can always come up with very
inspiring ideas during meetings and keeps giving my very useful suggestions. I cherish the
opportunity he gave me for the internship I did during my second year in ABB. I could never
have such important experience without this internship. I would like to thank Dr. Laurie
Williams and Dr. David L. Roberts for graciously agreeing to be in the thesis committee and
providing guidance from time to time.
I would like to thank my friends for life - Lulu Li, Xiao Zhang, Xun Wu, Xiaoqing Song
Haolan Fan, Yuanshu Liu, Lin Cao and Yuting Wang . Thanks for being with me through all
the ups and downs and twists and turns.
Thanks to Rui Wang for being the constant source of help, motivation, guidance and
company throughout my stay at Raleigh. I truly enjoyed working on coursework and research
with you. Thanks to Zhuowei Wang for being an important mentor for my work and life. You
great ideas on my research and my programming skills. I would miss working on coursework
and studying in the library all night with you.
I realize that this work would not have completed without all your contributions, and I am
TABLE OF CONTENTS
LIST OF TABLES ... vii
LIST OF FIGURES ... viii
CHAPTER 1 INTRODUCTION TO BUILDING ENERGY MANAGEMENT ... 1
1.1 Smarter Buildings and Energy Management ... 1
1.2 Technical Challenge and Motivation ... 5
1.3 Our Proposition ... 9
1.4 Thesis Structure ... 10
CHAPTER 2 RELATED WORK IN BUILDING ENERGY MANAGEMENT ... 12
2.1 Building Energy Management ... 12
2.2 Research on HVAC System ... 14
2.3 Research on Energy Storage ... 16
2.4 Research on Energy Optimization Algorithms ... 18
CHAPTER 3 DESCRIPTIVE INTRODUCTION TO BEM SIMULATION MODEL ... 20
3.1 Description of the BEM System Structure ... 20
3.2 BEM System Components Description ... 22
3.3 Energy Optimization Algorithm Introduction ... 27
CHAPTER 4 BEM SYSTEM IMPLEMENTATION AND SIMULATION ... 30
4.1 BEM System Components Implementation ... 30
4.2 BEM System Integral Simulation ... 52
4.3 Energy Optimization Algorithm Implementation ... 56
4.4 Energy Optimization Algorithm Simulation ... 65
CHAPTER 5 DATA COLLECTION AND ANALYSIS ... 67
5.1 Results and Analysis of Integral Simulation with Simple Control Algorithm ... 67
5.2 Results and Analysis of Simulation for Distributed Optimization Algorithm ... 75
CHAPTER 6 SUMMARY AND FUTURE WORK ... 84
6.1 Summary... 84
6.2 Future Work... 85
REFERENCES ... 87
LIST OF TABLES
Table 1 Energy ratings break down for data center ... 54
Table 2 Room type configuration for the HVAC block ... 54
LIST OF FIGURES
Figure 1.1 Components of Smarter Buildings ... 2
Figure 1.2 Network Structure of Building Energy Management System ... 4
Figure 1.3 Global Energy Consumption Growth Trend ... 6
Figure 1.4 Global Energy Consumption by Sectors ... 7
Figure 2.1 Network Structure of TAC Vista ... 13
Figure 2.2 Nucleus Connection Diagram ... 15
Figure 2.3 SVC Light semiconductor switching valves with series-connected IGBTs ... 17
Figure 2.4 General Architecture of the BEM system in [14] ... 19
Figure 3.1 Power Flow in a Smarter Building ... 21
Figure 3.2 Data Flow of the BEM System ... 21
Figure 3.3 Interaction between Energy Market and Controller ... 23
Figure 3.4 Interaction between Renewable Energy Resource and Controller ... 23
Figure 3.5 Interaction between Battery and Controller ... 24
Figure 3.6 Interaction between Weather Agent and Controller ... 25
Figure 3.7 Interaction between Data Center and Controller ... 25
Figure 3.8 Interaction between HVAC and Controller ... 26
Figure 3.9 Interaction between Plug Load and Controller ... 27
Figure 3.10 Architecture of the BEM Optimization System ... 28
Figure 4.1 Data Center Architecture ... 32
Figure 4.2 Architecture of the BEM Optimization System ... 33
Figure 4.3 Probability of occupancy by hour for all regular weekdays, blue dots indicate the average values and error bars indicate the corresponding standard deviations ... 37
Figure 4.4 Energy by the data center as a function of time ... 40
Figure 4.5 Energy by the HVAC as a function of time ... 40
Figure 4.6 Average power generated by PV array as a function of time for one day ... 41
Figure 4.7 (a)Histogram of price (b) log-normal distribution of price ... 44
Figure 4.8 System Layout in Simulink ... 52
Figure 4.9 Thermodynamics and Heat Transfer Model ... 58
Figure 5.1 (a) Total cost spent as a function of budget. (b)Total Energy spent as a function of budget. (c)Total migration count as a function of budget. (d) Total SLA violation as a function of budget. (e)Average office work productivity as a function of budget goal. (f)Average state of
the battery as a function of budget goal ... 69
Figure 5.2 (a) Total cost spent as a function of critical load budget. (b)Total Energy spent as a function of critical load budget. (c)Total migration count as a function of critical load budget. (d) Total SLA violation as a function of critical load budget. (e)Average office work productivity as a function of critical load budget. (f)Average state of the battery as a function of critical load budget ... 71
Figure 5.3 (a) Total cost spent as a function of charging rate. (b)Total Energy spent as a function of of charging rate. (c)Total migration count as a function of charging rate. (d) Total SLA violation as a function of charging rate. (e)Average office work productivity as a function of charging rate. (f)Average state of the battery as a function of charging rate ... 72
Figure 5.4 (a) Total cost spent for each scenario (b)Total Energy spent for each scenario. (c)Total migration count for each scenario. (d) Total SLA violation for each scenario. (e)Average office work productivity for each scenario ... 74
Figure 5.5 Convergence of the Objective Function Value ... 76
Figure 5.6 Convergence of the Total Energy Cost for 24 Hours ... 77
Figure 5.7 Comfort Level during Iterations ... 78
Figure 5.8 Energy Allocation to Office A for 24 Hours ... 79
Figure 5.9 Energy Allocation to Data Center A for 24 Hours ... 79
Figure 5.10 Convergence of Total Energy Cost for 24 Hours ... 80
CHAPTER 1
INTRODUCTION TO BUILDING ENERGY
MANAGEMENT
In this thesis we conduct the research on Energy Management in a Smarter Building.
Building energy management (BEM) is a computer network based control system that
monitors and manages the energy consumption in a building. Usually, BEM has components
of a variety of energy consuming appliances, multiple energy supply resources and energy
storage devices. In our study, we design the structure of the BEM system and the energy and
information flows between different components. We build models to simulate the energy
consumption for different components and integrate them all together to run the simulation
for the whole system. We design an algorithm to optimize the energy allocation to different
appliances to achieve a reduce in energy cost while comply to a certain level of human
comfort and building performance.
1.1 Smarter Buildings and Energy Management
The term smart buildings have been used for more than a two decades to introduce the
second half of 1970s it was a building that was built using a concept of energy efficiency and
in 1980s it was a building that could be controlled from a house PC[4].
Today, smart buildings use the 1970s and 1980s concept with additional subsystems for
managing and controlling renewable energy sources, house appliances and energy
consumption using most often a wireless communication technology.
As shown in Figure 1, in general the smart building consists of:
Figure 1.1: Components of Smarter Buildings [4]
• Sensors - monitoring and submitting messages in case of changes;
• Controllers – controlling units and devices based on programmed rules set by user;
• Central unit – enabling programming of units in the system;
• Interface - the user communication with the system;
• Network - allows communication between the units
• Smart meter - offers two-way, near or real-time communication between customer and
utility company
Network, which is the key component of a smarter building, connects all the other
components together and form the building energy management system.
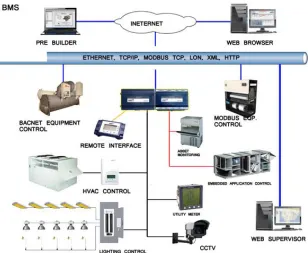
Building energy management (BEM) is a computer networking of electronic devices
designed to monitor and control the mechanical, security, fire and flood safety, lighting
(especially emergency lighting), HVAC and humidity control and ventilation systems in a
building [3].
Figure 1.2: Network Structure of Building Energy Management System
As shown in this figure, all the devices are connected into the cloud and are controlled by a
pre-built controller. All the energy appliance can be monitored and accessed by web
supervisors. This is fulfilled by sensors and meters. Sensors collect data about room
temperature, humidity, lighting and other environmental factors. Smart meters can report the
current energy consumption rate.
Other important information includes the renewable energy generation, the current energy
storage level and energy price from the market. According to these inputs, the central
Renewable energy resources are widely introduced to smart buildings to reduce the green
house gas emission and other solutions. However it also brings increasing uncertainty to
energy management due to its high dependency on environment factors. Therefore, energy
storage system plays an important role in compensating the fluctuation of energy supply.
In summary, the energy resources for a building includes the energy market, renewable
energy resources and building energy storage systems. Dictated by the requirements such as
occupant comfort, and data processing, the typical electrical demands or loads include those
for HVAC, lighting, elevators, plug loads and IT data centers.
1.2 Technical Challenges and Motivation
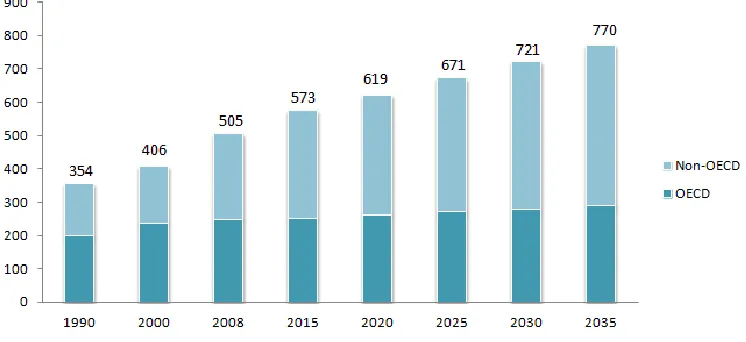
Energy consumption has been increasing remarkably during the past half century. The global
market for energy consumption is forecast to grow almost 55% by 2035, according to the US
Figure 1.3: Global Energy Consumption Growth Trend
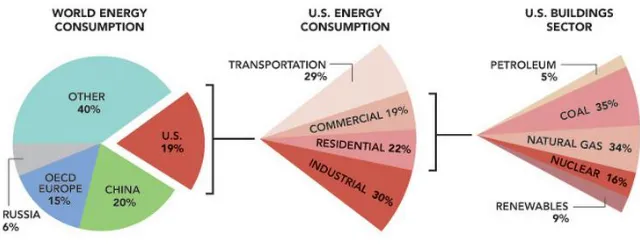
According to the U.S. Department of Energy, about 40% of total energy is consumed in
buildings, among which 68% is electricity [1]. Recent research shows that 20%–30% of
building energy consumption can be saved through optimized operation and management
without changing the structure and hardware configuration of the building energy supply
system [2]. Therefore, building energy management (BEM) is gaining an increasing attention
Figure 1.4: Global Energy Consumption by Sectors
Much effort has been made on energy management in a building. Energy scheduling is one of
the most popular solutions addressed to solve the energy management in a building.
Reference [5] presents a new electricity usage scheduling algorithm for smart buildings that adopts real-time pricing of electricity. Paper [6] introduced a stochastic energy scheduling model for a local-area smart-grid system with a single energy source and multiple energy
consumers. Considering the various features in different zones in a smart building, much
research has been done on energy management in a distributed manner. Reference [7]
utilized a semi-centralized decision-making methodology using multi-agent systems for
BEMS for electrical, heating, and cooling energy zones with combined heat and power
system optimizations aimed at improving energy efficiency and reducing energy costs.
The key to improve operation efficiency of building energy consumption is to coordinate and
consumption usually contributes to the relevant facility performance. Maintaining a higher
level of facility performance always means a higher consumption in the relevant load. For
example, the HVAC load is related to the comfort level of the inside occupant. High-speed
computation of a data center will require higher power demand of the CPU.
To make the optimal decision about the energy allocation for different loads, we need to
analyze loads and their contribution to the building performance. For typical commercial
buildings, which provide IT services like cloud computing and cloud storage, the
performance of IT data centers is usually essential to the profit gaining for this IT company.
Due to the service level agreement (SLA) between the IT service provider and its customers,
any violation of SLA will lead to a penalty which influence the net profit of the company.
Thus in order to comply to SLA, there is little room in the energy saving in data center load
because trying to minimize the energy supply to data center could possibly lead to a greater
penalty then the money we can save from it.
HVAC load, on the other hand, is usually more flexible. HVAC makes a great contribution to
the comfort level for the building occupant in the way of temperature and humidity control
and ventilation. A lot of research shows that the comfort level would make a great impact on
worker's productivity. Thus in a commercial building with offices usually have some
requirement about comfort level. But still, there is considerable room in optimizing HVAC
load according to the functionalities of different zones in a building and the occupancy in this
working inside. Additionally, comfort level requirement will be much lower during night
because a low occupancy level.
In summary, the main technical challenge comes from the variety properties of different
BEM components. By taking into consideration of these properties, we can come up with
better building management algorithms.
1.3 Our Proposition
Due to the nature of different loads, and considering the environmental and functional
features of different zones in a building, we propose a distributed building energy
management (BEM) system which consists of two layers: A central controller and multiple
zone agents.
To build up the whole system, firstly we build models for energy consumption appliances,
energy resources and energy storage units. We design the models according to their
properties so that we can get a more insightful analysis for the system components thus
achieve more accurate simulation of the system behavior.
An optimization algorithm is designed to optimize the energy allocation based on the
allocation to different zones, an HVAC model is designed to simulate the energy
consumption according to various environment factors.
In such way we divide the optimization task to the two layers: the central controller is
responsible for minimizing the total energy consumption from market and the zone agents
are aimed at maximizing the comfort level of each zone.
In summary, we proposed a model for building energy management system applying the
following methodology: the central controller makes decisions based on multiple factors
including the hourly energy price from the energy market, renewable energy generation and
the charging level of the storage system. The zone agents will try to compute the optimal
HVAC load based on the HVAC model and the occupancy of the room. The central
controller and zone agents collecting data exchange information in an iterative manner to
gradually agree on a final optimal power allocation decision.
1.4 Thesis Structure
This thesis is organized as follows. Chapter 2 presents an overview of related work,
discussing previous works done in the area of Energy Management in Smarter Buildings.
Chapter 3 details our design of the system and its components. A distributed algorithm for
building energy management is presented. Chapter 4 presents the simulations of individual
verified by Matlab Simulations. Chapter 5 discusses the analysis of collected data. Finally,
CHAPTER 2
RELATED WORK IN BUILDING ENERGY
MANAGEMENT
There has been much research done in the area of Smarter Buildings. Companies like IBM
and Schneider have developed various solutions and products for smarter buildings. Much
academic research has been done for optimization algorithm in BEM systems. As the most
important BEM components, HVAC system and energy storage have great potential in
improving the performance of smarter buildings. Thus we also conduct research about the
previous work in these two topics
2.1 Building Energy Management
As an increasingly hot topic in the industrial world, Building Energy Management(BEM) has
become a major study area for big energy solution companies like IBM and Schneider.
Research about the latest BEM solutions from industrial world helps us keep up with the
IBM’s solution for workplace data integration is IBM®TRIRIGA®. IBMTRIRIGA delivers
an integrated workplace management system (IWMS) that integrates functional models
across real estate, capital projects, facilities space management, facility maintenance, and
environmental and energy management within a single technology platform[8].
Schneider's solution for building management is TAC Vista. TAC Vista is an integration,
intelligence and TCP/IP deliver a smarter Building Energy Management System. It is a
Building Energy Management System that allows you to monitor and control HVAC,
lighting control, access control and other security features across one or more
facilities. Based on the open protocol LonWorks, it is among the most scalable and
IT-friendly systems in the industry. This scalable solution can accommodate any size building
management application. Open architecture allows seamless integration with third-party
products and provides complete interoperability. [9].
Besides, companies like Siemens, GE and Honeywell also provide various of hardware and
software solutions for BEM system. By studying the world's leading energy solution
companies, we have a better understanding about how the building management is conducted
in real world.
2.2 Research on Renewable Energy Generation
HVAC (heating, ventilation and air conditioning) is the technology of indoor and vehicular
environmental comfort. HVAC is important in the design of medium to large industrial and
office buildings such as skyscrapers and in marine environments such as aquariums, where
safe and healthy building conditions are regulated with respect to temperature and humidity,
using fresh air from outdoors.
Some research has been done about the HVAC system in a smarter building. [10] compares 3
different control schemes to regulate temperature and humidity in facilities and compares the
energy consumption in each of the cases. The first method is a traditional ON/OFF controller
with a dead band region. The second scheme is an intelligent ON/OFF controller where the
control system for the heater and humidifier predicts the time the system takes to reach the
set point value of temperature and humidity and the energy is supplied to the heater and
humidifier based on these predictions. The last controller scheme is an optimal controller
where thermal comfort in a building is maintained by tracking a PMV (predicted mean value),
[11] presents a real-time algorithm to predict the energy consumption of the heating, ventilation, and air conditioning (HVAC) system at home. The autoregressive model with
exogenous inputs (ARX model) is used to identify the house thermal model. The ARX model,
with the thermostat controller, is simulated to obtain the future state of the HVAC system
with the knowledge of the weather forecast data obtained from a weather server. The
proposed method is validated by experimentation in a particular home using GE Nucleus
energy management system for data aggregation and algorithm implementation.
Figure 2.2: Nucleus Connection Diagram [11]
2.3 Research on Energy Storage
during the critical parts of the day. This makes providing power more expensive because
extra power plants have to be built to meet this peak demand.
Energy costs could be reduced if the server peak-power demand, and hence the supplied
power, can be lowered. Operational costs can be reduced by decreasing the grid-based power
supply during peak demand by supplementing with batteries and recharging the batteries at
low demand time.
However, a critical issue of energy storage in smarter buildings is their capacity. Some
research has been done for calculating the optimal battery capacity in a smarter building to
achieve better performance while lowering cost at the same time. [12] presents a
methodology to optimal the capacity of flow battery. It builds the optimization model to
determine the sizing capacity of flow battery while the objective function of this model is to
maximize the benefits the power system. discharge characteristics of flow battery as its
constraints. While the capacity of flow battery has been determined, an operating strategy of
flow battery to dispatch power has been presented.
[13] presents the world’s first high voltage utility-scale battery energy storage system in the multi megawatt range. After tests at ABB laboratories, where its performance to specification
was confirmed, a first pilot was installed in the field, in EDF Energy Networks’ distribution
network in the United Kingdom during 2010 to demonstrate its capability under a variety of
Figure 2.3: SVC Light semiconductor switching valves with series-connected IGBTs [13]
2.4 Research on Energy Optimization Algorithms
The distributed management of building energy system proposed in [7] utilizes a
heating, and cooling energy zones with combined heat and power system optimizations
aimed at improving energy efficiency and reducing energy costs.
[14] propose a novel first stage of optimization in the smart grid which reduces external on/off command flow for demand response between the controller and the smart appliances.
A phase management scheme is developed that defines optimal time shifts (delays) on the
periodic loads in order to provide peak power reduction over a limited time horizon. A
centralized control scheme is explored, applied from the controller of the smart grid to smart
devices that fall within its administrative domain. It is found that respectable peak power
reduction can be achieved by the centralized scheme with a drawback the redundant data
transfer in the network.
Research on the related work helps us to have a better understanding of all the components in
a BEM system and how they work together. Utilizing the knowledge from these works, we
CHAPTER 3
DESCRIPTIVE INTRODUCTION TO BEM
SIMULATION MODEL
3.1 Description of the BEM System Structure
In this work we try to create a model which encompasses major energy consuming
subsystems in a commercial building, and we implement a simple price aware energy
optimization control system. In our model we also assume the use of battery to amortize the
price variation and peak load demands.
We consider a building with multiple rooms (offices), a data center, and a battery module.
Power in our building comes from the utility (“power grid” block) and a locally installed
renewable energy installation (“renewable energy” block). Figure 3.1 shows the power flow
Figure 3.1: Power Flow in a Smarter Building
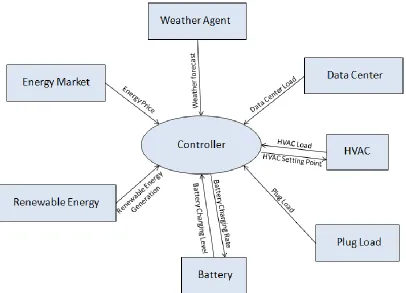
Figure 2 depicts the control flow of our BEM system. It works as follows:
A controller collects:
- price information from the Energy Market,
- the amount of energy generated from the Renewable Source,
- the outdoor temperature prediction form weather forecast
- prediction of future energy usage from Data Center
- prediction of future energy usage from HVAC
- the energy consumption measurements from Plug Loads,
- the charging level from the Battery units
A controller sends control signal as follow:
- setting point of HVAC,
- charging/discharging rate of Battery
In summary, the controller collects data from all the blocks and makes the final decision
about how much energy to allocate to each appliance. The controller coordinate the whole
system by sending control signals to related appliance(HVAC, Battery) which set their
3.2 BEM System Components Description
I. Energy Market
Figure 3.3: Interaction between Energy Market and Controller
Input:
- Null
Output:
- Energy Price for the following hours
Approach:
- Historical data of energy price from PJM.
II. Renewable Energy Source
Input:
- Null
Output:
- Power generated by the locally installed PV panels
Approach:
- We specify a location and a type of PV panel in PVWATT and get hourly values
of the renewable energy.
III. Battery
Figure 3.5: Interaction between Battery and Controller
Input:
- Battery charging/discharging rate
Output:
- Battery charging level
Approach:
- Accurately model the battery’s operation in MATLAB, while satisfying the
IV. Weather Agent
Figure 3.6: Interaction between Weather Agent and Controller
Input:
- Null
Output:
- Outdoor temperature prediction
Approach:
- We specify a location and use the historical data for a typical summer day.
V. Data Center
Input:
- Null
Output:
- Data Center load
Approach:
- We assume that the performance of the data center depends on the available
power (e.g. CPUs with Dynamic Frequency and Voltage). We model that
relationship via a utility function (performance versus power) which estimates
how efficiently our data center performs with respect to its load.
VI. HVAC
Figure 3.8: Interaction between HVAC and Controller
Input:
- HVAC setting point
Output:
- Current indoor temperature
Approach:
- Model the relationship between temperature and comfort/productivity via a utility
function, and
- Use the thermal model of the room using MATLAB.
VII. Plug Load
Figure 3.9: Interaction between Plug Load and Controller
Input:
- Null
Output:
- Plug load
Approach:
- We analyze the energy usage for random plug load in a commercial building
combined with the occupancy of the building to generate the function for plug
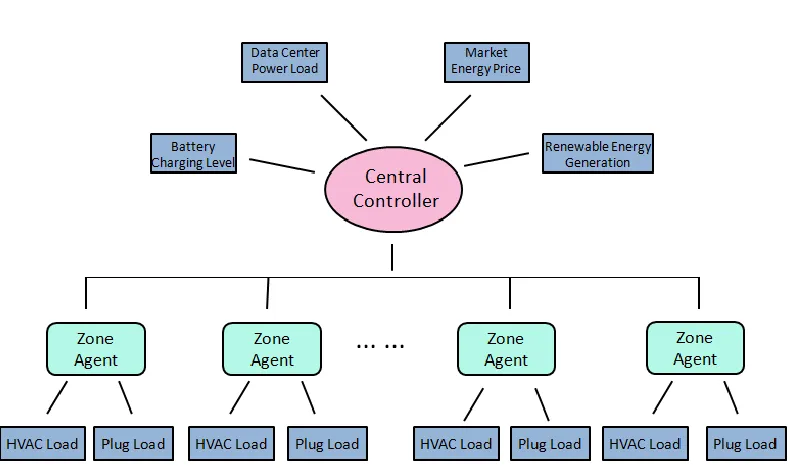
3.3 Energy Optimization Algorithm Introduction
Agent technology is widely used in BEM system [7], [15], [16]Different agents are designed to accomplish complex tasks in a collaborative fashion. In this paper, we built the
architecture of the BEM system as shown in Figure. 1, which fully accounts for the various
zone features of the building and the energy supply-demand relationships between different
entities in a building.
Figure 3.10: Architecture of the BEM Optimization System
The proposed BEM system consists of two layers. The first layer is a Central Controller,
which is the core part of the BEM system. The second layer includes all the Zone Agents.
The Central Controller is a central agent, which collects information from different energy
appliances in the whole building. It integrates the demand and supply requirements to make
the final allocation decision and send commands to energy appliance. Information integrated
into Central Controller includes Data Center load, battery charging level, renewable energy
generation, price information from the market and the energy consumption information from
each Zone Agent.
Zone Agents are distributed in different zones in a building. Each agent is responsible for
monitoring and collecting data from energy consumption in the zone and communicates the
information to the central controller. The energy consumption monitored by zone agent
CHAPTER 4
BEM SYSTEM IMPLEMENTATION AND
SIMULATION
In this work, we first designed models for different energy consuming appliance in a BEM
system, including Data Center, HAVC and Battery. Then we designed a simple control
strategy which allocates energy according to a weekly budget. We built the BEM system by
integrating all the models and ran the simulation using Simulink for the whole system
applying the budget control strategy and prove the strategy's capability of saving money.
To improve this BEM system, we designed an agent based distributed energy optimization
algorithm. To verify the algorithm's feasibility, we implement this algorithm in Matlab and
ran the simulation with relevant data. We finally proved that this algorithm can help to save
4.1 BEM System Components Implementation
In this section, we will give a detailed description of different models in our BEM system.
Data Center
Reducing data center power consumption is an important challenge with the increase in the
demand for their services. Low utilization is common to data center operation, in a typical
data centers average utilization is only 20-30% [17, 18]. The reason behind this is strict service-level agreements force operators to provision for redundant operation under peak
load. Idle-energy waste is compounded by losses in the power delivery and cooling
infrastructure, which increase power consumption requirements by as much as 50-100% [19].
The modeling of data center has been done considering modern state of the art architecture
where virtual machines (VM) are employed for the purpose of consolidation, environment
isolation and multi-service support [20]. Assumption about the architecture is taken from
Figure 4.1: Data Center Architecture
The five distinct units which accounts for a data center’s power draw are
- Servers and storage systems,
- Power conditioning equipment,
- Cooling and humidification systems,
- Networking equipment, and
- lighting/physical security.
Servers, power conditioning and cooling systems consume a significant portion of power.
The three contribute about 94% of overall power consumption and their power draw vary
power draw, PTotal, is described as a function of total utilization, U. Figure.2 illustrates the
power consumption share of the five sub-units in the data center.
Figure 4.2: Architecture of the BEM Optimization System
1) Server Power & Energy Model
Power consumption by computing nodes in data centers is mostly determined by the CPU,
memory, disk storage and network interfaces. In comparison to other system resources, the
CPU consumes the greater portion of power consumed by the whole system. Moreover, the
CPU utilization is typically proportional to the overall system load. Recent studies have
shown that the application of DVFS on the CPU results in almost linear power-to-frequency
relationship for a server. Moreover, these studies have shown that on average an idle server
consumes approximately 70% of the power consumed by the server running at the full CPU
The above equation express the power as a function of CPU utilization Where Pmax is the
maximum power rating of the CPU; K is the fraction of the maximum power which is
consumed when the server is ideal.
The utilization of the CPU change over time due to the workload variability, thus, the CPU
utilization is a function of time and is represented as U (t). Therefore, the total energy
consumption by a physical node can be defined as an integral of the power consumption
function over a period of time.
2) Power Conditioning Systems
Data centers require considerable infrastructure to distribute uninterrupted, stable electrical
power. Power conditioning system usually includes power distribution units (PDUs) and
uninterruptible power supplies (UPSs). PDUs transform the high voltage power distributed
throughout the data center to voltage levels appropriate for servers. They incur a constant
power proportional to the square of the load [22].UPSs provide temporary power during
We model the power consumption of this system as Ppcu, an increasing and convex function
of the aggregate server power consumption. One possible general model is a quadratic
function adopted in the study on the data center power consumption [23]:
3) Computer Room Air Handling (CRAH) Systems Power
CRAH power is dominated by fan power, which grows with the cube of mass flow rate, f,
which is directly proportional to the utilization of server. Additionally, there is some fixed
power cost for sensors and control systems, PCRAHIdle.
f is directly proportional to the utilization of server.
4) Chiller Plant and Cooling Tower Power
It is majority of the overall cooling cost in most data centers. Its power draw depends on the
amount of heat extracted from the chilled water return, the selected temperature of the chilled
temperature and chilled water supply temperature will require power that grows quadratically
with the quantity of heat removed (and thus with utilization).
HVAC System
HVAC systems are the major energy consumers in buildings. Operation and control of
HVAC systems have significant impacts on the energy or cost efficiency of buildings besides
their designs. Energy efficient control of HVAC systems will provide the desired indoor
comfort and healthy environment under the dynamic working conditions while minimizing
the energy usage.
1) Thermal Model
In order to study the energy consumption of a building due to the HVAC one has to properly
model the thermal characteristic of typical room space. This modeling was done based on
Matlab Simulink thermal model of a house.[24] This system models the outdoor environment,
the thermal characteristics of the house, and the house heating system, it then calculates
heating energy for a generic room. Basing our model on this we modify the room size
parameters to simulate different kind of rooms in a building.
Occupancy profiles allow one to determine, for example, the probability that an office is
occupied at any given hour of a workday. We integrate occupancy pattern of a typical office
building so that we can have an HVAC model with advanced control system, i.e. the HVAC
is operated based on the input from occupancy sensors.
The occupancy data from [25] study showed that there are several occasions throughout a
typical workday when HVAC ON hours can be reduced through the use of occupancy
sensors. The figure below demonstrates their finding.
Figure 4.3: Probability of occupancy by hour for all regular weekdays, blue dots indicate the
average values and error bars indicate the corresponding standard deviations
As performance matrices for the HVAC system we calculate productivity in office work as a
function of room temperature. Increased evidence shows that indoor environmental
conditions substantially influence health and productivity [26]. The productivity in office is given as a function of indoor temperature using the equation below.
Battery
The electric grid experiences the daily peak demand issues by seeing pronounced surges
during the critical parts of the day. This makes providing power more expensive because
extra power plants have to be built to meet this peak demand. Data centers are also at their
busiest during this peak power period. Energy costs could be reduced if the server
peak-power demand, and hence the supplied peak-power, can be lowered. Operational costs can be
reduced by decreasing the grid-based power supply during peak demand by supplementing
with batteries and recharging the batteries at low demand time.
The basic strategy of the battery is to charge from the grid when price is fairly low and we
have light load and discharge to provide extra energy for the whole system in peak hours.
The two key parameters for the battery are the charging/discharging rate and the total
1) Determine the Charging Rate
For the whole system, we have that for the ithhour, the energy charged to the battery in one
hour is
Where,
: energy charged to the battery within one hour;
: Energy discharged from the battery within one hour.
T : 1 hour
: power rate of the power grid.
: power rate of the total load of the system
: power load of Data Center.
: power load of HVAC
To determine the proper charging/discharging rate of the battery, we need to find all the
values in the above equation.
Finding and :
By running in a separate simulation the Data Center, we get the output of Data Center’s
energy as shown in the figure 4.4 below. From this we can see the energy demand is almost
centered at some constant mean value, so we calculate the average power for the data center
from this.
Figure 4.4: Energy by the data center as a function of time
In the same way running separate simulation for the HVAC, we find the energy of HVAC for
Figure 4.5: Energy by the HVAC as a function of time
Because of the occupancy of the building, the HVAC has periodic property where it
consumes more energy during day time and less during night. In order to have a more
intuitive presentation of this property, we calculate the average power consumption for each
hour during a day. We can see from the table below that HVAC is consuming more 8:00 to
17:00.
Finding :
From the renewable generated energy we found the periodic property in the power generation
of PV array that it can only generate power from 8:00 to 18:00 only, where it reaches its peak
Figure 4.6: Average power generated by PV array as a function of time for one day
According to our simulation, we compare the hourly target and the real cost for every hour
and found that in most conditions, the difference between the real cost and the hourly target
is within 15%. This could be represented as:
In terms of Power, we have:
To compensate this difference between and , we can charge or discharge the
battery so that the real load is getting more close to the target load(or plan load). So we
choose 15% of the real load to be the charging/discharging rate of the battery.
According to the analysis of the price information from PJM [27], we found the condition that price is high continuously for 10 hours is rare, thus we determine the whole capacity of
the battery is:
This guarantee that the battery can be discharged continuously for 10 hours, in extreme
conditions.
Budget Controller
Setting a weekly cost target and controlling our energy usage to meet that goal will bring a
significant energy and money saving. In this section, we will introduce the design and
parameter settings for the budget controller.
The task of the budget controller is to collect energy consuming information for every block
in the whole system and thus determine the cost target for next hour.
1) Strategy
We can categorize our system in loads in to two categories, which are critical and noncritical.
for the customers. It can never be cut down even in some extreme condition such as energy
shortage or budget shortage. Thus we divide the total weekly budget into two parts.
A. Critical load (e.g. Data Center has to work at least at the lowest performance level.)
This part of power consumption is not controllable. The amount of this part of power load is
fixed.
B. Non Critical load (Load in HVAC, Battery and Data Center for extra performance
needs). This part of power consumption is controllable, which means, when we suffer a high
risk of exceeding the monthly budget, we can somehow reduce this consumption in a certain
amount so that we can be within our monthly budget.
2) Determine Critical Load ( )
Since the critical load in our system is the minimal power consumption of Data Center, we
run separate simulation of Data Center and get the output of Data Center as shown in figure
4.4. is the minimal power consumption.
3) Determine cost target for critical load ( )
According to our definition of critical load, the amount of the critical load is fixed . So the
information from PJM [27], we take the hourly price for 774 hours(around one month) and we analyze the prices and plot the histogram of the price. From this we can see that the
probability distribution of the price can be fit into a log-normal distribution.
Figure 4.7: (a)Histogram of price (b) log-normal distribution of price
Equation for log normal distribution
–
where =3.5433
=0.3991. Thus we can represent the PDF of price as a log normal distribution. Since the
critical load is fixed as , so the hourly cost for critical load for one hour would
have the same distribution scaled with 280. Then we can find out the hourly cost for critical
load for 168 hours. Since we are calculating the sum of random variables which are all of the
same distribution, we can use convolution to get the sum.
...
Where Pn represent the PDF of total cost for critical load for n hours. Thus we can have the
PDF of total cost for critical load from 1hour to 168 hours.
Next, we can use the PDF to determine the proper cost target for critical load. take the PDF
for one hour (P1) as an example which is shown in figure 4.5. (b) . From the x-axis, we can
find a value a1 to satisfy the following equation:
From the above equation, we have that with a probability of 0.95, the cost for critical load for
one hour would be lower or equal to a1 dollars. Thus if we choose a1 as the hourly cost target
for the critical load, the probability that finally the real cost will be within this cost target is
95%. The risk of exceeding this target is only 5% which is really small. So we determine to
use this value a1 as our cost target for critical load for one hour. Finally we can find the cost
target ai where i is from 1 to 168.
So the next question will be how do we use these values to determine the hourly cost target
the budget left for the rest of this week is bi dollars, thus we have (169-i) hours left in this
week. Before we determine the money for the ith hour, we have to make sure that we save
enough money for the rest for the week ((168 - i) hours) to support the critical load for these
(168-i) hours. Since we have already calculated the cost target for critical load for (168-i)
hours which is a(168-i), thus the money that we can control and allocate to the ith hour is:
4) Day-time mode and Night mode and finding hourly cost target for random load ( )
We can see from fig.9 that the cost is higher from 8:00 am to 11:00 pm, and is lower from
11:00 pm to 8:00 am. We define 8:00am - 11:00pm as day-time mode and 11:00pm - 8:00am
as night mode. From historical data we find the relationship between day time energy
consumption and night energy consumption as follow:
Thus we set the weight for day-time hours to be 12 and the weight for night hours to be 1.
If it is during night, the cost target for random load for this hour is
Controller
To simulate the whole system integrally, we implement a simple version of the controller as
follow: By the implementation of information based facility control system one can save
significant amount of energy. Based on the energy consumption history of the subsystems the
future energy demand can be predicted and this information combined with the price for the
next period will let us decide whether to put a break on our energy usage strategy cutting
some performance.
This controller block basically takes in the temperature forecast from HVAC, predicted load
for DC, budget goal for the next period, next hour price, the current state of barriers and
predicted renewable energy. It then decides the operation point for the DC, HVAC and
Battery for the next period. This decision are done in a step by step manner.
charged. K decides how much above the mean value we should set the threshold for the
charging battery and it is always greater than 1. We will then update the predicted cost
accordingly. Some of the decisions made here may be overwritten in the preceding steps.
Pseudo code:
If (price<(mean_price*K))
Charge battery;
Update cost;
Else
Do nothing;
End
Step 2: here we compare the total cost that we predict for the next period, cost, with the budget goal that we set by the budget controller for that hour, budget. If we have cost is
lower we say we are below our goal so we can improve the performance of our subsystems
as long as they are below this goal. We will start maximizing the performance from the most
critical subunit. In our case we will start maximizing performance of the datacenter by one
step and update the cost.
If cost is still below budget we will then increase the performance of the HVAC and update
the cost. Finally if cost is still below the budget goal we will charge our batteries. Pseudo
If(cost< budget)
Maximize DC performance;
Update cost
End
If (cost< budget)
Maximize HVAC performance;
Update cost
End
If (cost< budget)
Charge battery;
Update cost;
End
Step 3: If cost is greater than the budget goal we will first check the battery if they have enough power to supply for the next period, if so we will cover part of the energy demand
with the battery and update the cost.
If the cost is still higher than the budget we will minimize the performance of the HVAC
subsystem and update the cost. Finally the performance of the data center will be adjusted to
If (cost>budget)
Discharge from battery;
Update cost
End
If (cost>budget)
Minimize HVAC performance;
Update cost
End
If (cost> budget)
Minimize DC performance;
Update cost;
end
This step by step optimization process will give us the tool to control the knobs of the
subunits considering their priority. I.e. we will always start cutting the performance of the
less critical load, and on the other hand we always start the performance upgrade from the
4.2 BEM System Integral Simulation
We modeled all of the subunits we explained above on Matlab Simulink in order to carry out
our simulation. In this section we will explain the simulation set up for the general system
and each sub blocks in detail.
Figure 4.8: System Layout in Simulink
The system's dimensioning is as follow:
1) Data Center
We have simulated a data center comprising 100 heterogeneous physical nodes. Each node is
The hosts consume from 175 W with 0% CPU utilization, up to 250Wwith 100% CPU
utilization. Each VM requires on CPU core with 250, 500, 750 or 1000 MIPS with 128 MB
of RAM and 1 GB of storage. The users submit requests for provisioning of 290
heterogeneous VMs that fill the full capacity of the simulated data center. Each VM runs a
web-application or any kind of application with variable workload, which is modeled to
generate the utilization of CPU according to a uniformly distributed random variable. The
energy overhead for migration of 1G VM on a 100 MBps network bandwidth, is around
200watts.
For the simulations, the utilization of the CPU by a VM is generated as a uniformly
distributed random variable. This is appropriate due to unknown types of applications
running on VMs, and as it is not possible to build the exact model of such a mixed workload.
This approach has been justified by Verma et al. [28].
In the paper [29] it is mentioned that a data center with 1000 racks, over 30,000 square feet, will require over 10 MW of power for the computing infrastructure. Basing our dimensioning
on this we have a floor area of 2300m2 for the data center according to the
recommendation[30] a typical per-rack heat densities went from 1 kW to 7 kW, and they are
estimated to exceed 20 kW per rack by 2010. In our model we assume to put 100 racks on
920 m2. The rest of the room space will be used for cooling system, battery, power system
In our simulation, we have three types of rack with the following configuration.
Table 1: Energy ratings break down for data center
type No of racks No of blade per
rack
Power per rack(Kw/rack)
Total power(kw)
Small capacity 30 12 3 90
Medium capacity
40 12 6 240
High capacity 30 12 9 270
Total server power(56% of total DC power) 600 Power consumed by the other DC units(44% of total DC power) 470 Total DC power rating 1070
2) HVAC
We consider the engineering building II as a reference point for our building design. In out
simulation we assume a building as big as the engineering building II west wing which has a
total floor area of around 9200 m2 , with a rough approximation each floor consist of an
average 2,300m2 . For simplicity we only consider that this building is used for office space
and we assume 3 kinds of rooms which will constitute most of the floor areas of the upper 3
floors.
Table 2: Room type configuration for the HVAC block
Room1 (Open Workstations)
Room 2 (Enclosed medium Offices)
Room 3 (Enclosed Small Offices)
Area=300m2
Number of rooms=5
Total area=1500m2
House length = 30 m
Area=100m2
Number of rooms=5
Total area=500m2
House length = 10 m
Area=25m2
Number of rooms=20
Total area=500m2
Table 2 Continued: Room type configuration for the HVAC block
Room1 (Open Workstations)
Room 2 (Enclosed medium Offices)
Room 3 (Enclosed Small Offices)
House height = 4 m
Roof pitch = 0 deg
Number of windows = 10
Height of windows = 1.5 m
Width of windows = 1m
House height = 4 m
Roof pitch = 0 deg
Number of windows = 4
Height of windows = 1.5 m
Width of windows = 1 m
House width = 5 m
House height = 4 m
Roof pitch = 0 deg
Number of windows = 2
Height of windows = 1.5 m
Width of windows = 1 m
The following configuration about the building will be comment to all the three room types:
- Glass wool in the walls, 0.2 m thick
- Glass windows, 0.01 m thick
- Thermal Coefficient c = cp of air (273 K) = 1005.4 J/kgK
- The air exiting the heater has a constant temperature which is a heater property. THeater
= 50 ℃
- Air flow rate Mdot = 1 kg/sec = 3600 kg/hr
- Density of air at sea level = 1.2250 kg/m3
3) Battery
According to the parameter settings for battery, the default charging/discharging rate is
100kW. To find the optimal charging rate, we also test different charging/discharging rate:
60 kW,70 kW,80kW, 90kW,100kW, 110kW, 120kW.
4) Budget Controller
The default critical load is 280kW. To find the optimal critical load, we also test from 210kW
to 350kW. The default total budget is 32000 dollars. We also test from 27000 to 50000 in
step of 1000.
4.3 Energy Optimization Algorithm Implementation
Based on the BEM system we designed as above, we can make an improvement by adding a
more efficient energy optimization algorithm into the controller. As mentioned in previous
chapter, we designed a distributed energy allocation algorithm to achieve energy saving
while complying to a certain building performance level. Thus in this section, we will
The objective of our Building Energy Management system is to minimize the energy cost
from the market and maximize the comfort level in offices at the same time. In this section, a
distributed optimization algorithm will be elaborated.
1) Energy Consumption Models for HVAC Load
HVAC makes a great contribution to the comfort level for the building occupant in the way
of temperature and humidity control and ventilation. HVAC load has a great potential to be
optimized because the energy consumption of HVAC is greatly influenced by many factors
like environment conditions of each zone. For example, rooms face the south are usually
much warmer than those facing the north. Also, the requirement of comfort level for each
zone could vary greatly. An office room always has a higher requirement of comfort level
than Data Center because usually there are no people working in a Data Center. So, instead
of a centralized control of HVAC, we distribute the optimization of HVAC consumption into
each zone.
Thus, we built HVAC energy consumption model as a method to predict the HVAC load
according to some given factors. The HVAC energy consumption is essentially divided into
two main components: the power consumed by the fans to circulate the air and the power
absorbed by the HVAC equipment. The former always contributes to the building's electric
where .
The model for cooling energy is based on the overall thermal resistance theory to simulate
the behavior of a typical air-based HVAC system [36]. Figure 4.7 shows a control volume
analysis based on fundamental principles of thermodynamics and heat transfer.
Figure 4.9: Thermodynamics and Heat Transfer Model
The thermal dynamic evolution of the air is represented by:
The first term on the right side represents the energy contribution of the HVAC system,
namely the energy carried by the supply air leaving the HVAC system and entering the
household at temperature THVAC minus the energy content of the exhaust air leaving the
control volume at Ta. The second term represents the heat transfer between the household, at
Ta, and the environment at temperature .
Thus the cooling power in the summer is then given by:
where COP represents the energy removed from the house per unit of electrical energy used
by the HVAC system. SHR is a term measures the ratio between the sensible heat load and
the total heat load.
2) Other Load Models
As a commercial building run by an IT company, Data Center load takes up a great park of
energy consumption. Paper [33] gives a comprehensive analysis of Data Center energy
consumption model, which we utilized in our simulation. Plug load of each zone usually
consists lighting, desktop computers and some other small electrical appliances. References
3) Real-Time Distributed Optimization
The basic objective of this algorithm is to decide the power consumption from the energy
market for each hour in the remaining day. This can be achieved by deciding the allocation
for each zone at each hour. Suppose the price of real time energy for each hour is p = {p(1) ...,
p(T)}and the BEM system needs to decide the power consumption from market which is P =
{P(1) ..., P(T)}, with the predicted renewable energy generation Pr(t), ∀t∈T, the predicted
Data Center load , ∀ and the predicted Battery load ∀ .
For each hour t, zone Agent i, ∀i reports its demand for plug load and demand for
HVAC load ∀ . can be calculated as the HVAC load of zone i at hour t if
the HVAC has the best performance which maintains the highest comfort level. It is
complicated to predict the specific load request information so we consider the comfort level
in the following way.
where is the actual energy value Central Controller distributes to Zone Agent i at hour t.
So measures how much the actual energy distributed to Zone i differ from the
Because the objective of this optimization is to minimize the energy cost from market and at
the same time, maintain a high comfort level, we design the optimization problem as follows:
∀ ∀ ∀
where is the weighting coefficient for zone i at hour t. It is a function of the occupancy
file.
In order to reduce information interaction, this problem can be solved in a distributed fashion.
Now we define the Lagrangian as follow:
Then the original optimization problem can be written as:
s.t. (23) (24)
We can write the objective function of dual optimization problem as
where
Here we can divide the problem into two parts, and each can be solved by the Central
The optimization problem for Central Controller is with constraint (24). And for each
Zone Agent, the optimization problem is with constraint (25). We solve this problem in
an iterative manner using the gradient projection method, thus we have:
where =1/(m+1) is the step size.
The algorithms for Central Controller and Zone Agents are described respectively as follows:
Initialization:
The start point of Lagrangian: ∀ :
The start point of power consumption from market:
The HVAC load of each zone at the best performance:
The tolerance of Lagrangian :
Algorithm in Central Controller
1. Receives , ∀ from all the Zone Agents;
2. Compute the new "price" ∀ according to (16) in which the parameter
should have been calculated from the previous iteration;
3. Compute the new energy consumption from market as:
with the parameter
4. if( )
Communicate to all the Zone Agents
else
Stop iteration and return as the optimal energy consumption from
market;
Algorithm in Zone Agents
1. Receives ∀ from the Central Controller
2. Updates by solving (14) with constraint (8)
4.4
Energy Optimization Algorithm Simulation
1) Basic Simulation Scenario
In this section, we present a case study of this optimization algorithm and run the simulation
of the optimization algorithm in Matlab. The following are some assumptions for this
simulation:
- We assume this optimization is for 24 hours, namely, T = 24. There are five zones
with different functionalities. Appendix A provides the parameters for the HVAC
model. Appendix B provides the parameters for the five zones.
- We assume that this optimization is for a typical summer day in Raleigh area. We use
the historical weather records for the temperature inputs [31].
- For energy price data, we use the historical price records for the same day chosen for
weather data [27].
- For renewable energy generation, we calculate from historical data in Raleigh Area by
using the PV Watts calculator [32].
2) Scaling up Scenario
In this section, we increase the scale of the building into a two-story building with 25
CHAPTER 5
DATA COLLECTION AND ANALYSIS
5.1 Results and Analysis of Integral Simulation with Simple Control
Algorithm
In our work, we firstly integrate all the models we designed together to form a Building
Energy Management system in Simulink. Parameter settings are listed in the previous section.
In this simulation, we collected data about:
- Total cost of facility for one week in USD.
- Total energy used by the facility in KWH.
- Total number of times we violate SLA (I.e. we are above 95% of server host
utilization, I this case there will be delays handling the extra load which in turn will
be reflected in users experience)
- Total number of migration(there is delay approximately around 60 ms. In addition
there energy cost associated with migration process which is around 200 Ws per
![Figure 1.1: Components of Smarter Buildings [4]](https://thumb-us.123doks.com/thumbv2/123dok_us/1406354.1173259/14.612.114.498.326.553/figure-components-of-smarter-buildings.webp)
![Figure 2.1: Network Structure of TAC Vista [9]](https://thumb-us.123doks.com/thumbv2/123dok_us/1406354.1173259/25.612.148.482.455.643/figure-network-structure-tac-vista.webp)
![Figure 2.2: Nucleus Connection Diagram [11]](https://thumb-us.123doks.com/thumbv2/123dok_us/1406354.1173259/27.612.149.481.302.517/figure-nucleus-connection-diagram.webp)
![Figure 2.3: SVC Light semiconductor switching valves with series-connected IGBTs [13]](https://thumb-us.123doks.com/thumbv2/123dok_us/1406354.1173259/29.612.180.449.69.471/figure-light-semiconductor-switching-valves-series-connected-igbts.webp)
![Figure 2.4: General Architecture of the BEM system in [14]](https://thumb-us.123doks.com/thumbv2/123dok_us/1406354.1173259/30.612.166.471.412.627/figure-general-architecture-bem.webp)