University of Windsor University of Windsor
Scholarship at UWindsor
Scholarship at UWindsor
Electronic Theses and Dissertations Theses, Dissertations, and Major Papers
2011
Dynamic Analysis for Enterprise Strategic Flexibility using System
Dynamic Analysis for Enterprise Strategic Flexibility using System
Engineering Methodology
Engineering Methodology
Amir Taher Abd-Allah Arafa University of Windsor
Follow this and additional works at: https://scholar.uwindsor.ca/etd
Recommended Citation Recommended Citation
Arafa, Amir Taher Abd-Allah, "Dynamic Analysis for Enterprise Strategic Flexibility using System Engineering Methodology" (2011). Electronic Theses and Dissertations. 7944.
https://scholar.uwindsor.ca/etd/7944
Dynamic Analysis for Enterprise Strategic Flexibility using System Engineering Methodology
by
AMIR TAHER ABD-ALLAH ARAFA
A Dissertation
Submitted to the Faculty of Graduate Studies through Industrial and Manufacturing Systems Engineering
in Partial Fulfillment of the Requirements for the Degree of Doctor of Philosophy at the
University of Windsor
Windsor, Ontario, Canada
2011
Library and Archives Canada Published Heritage Branch Bibliotheque et Archives Canada Direction du
Patrimoine de I'edition 395 Wellington Street
Ottawa ON K1A0N4 Canada
395, rue Wellington Ottawa ON K1A 0N4 Canada
Your file Votre reference ISBN: 978-0-494-88922-0 Our file Notre reference ISBN: 978-0-494-88922-0
NOTICE:
The author has granted a non
exclusive license allowing Library and Archives Canada to reproduce, publish, archive, preserve, conserve, communicate to the public by
telecommunication or on the Internet, loan, distrbute and sell theses
worldwide, for commercial or non commercial purposes, in microform, paper, electronic and/or any other formats.
AVIS:
L'auteur a accorde une licence non exclusive permettant a la Bibliotheque et Archives Canada de reproduire, publier, archiver, sauvegarder, conserver, transmettre au public par telecommunication ou par I'lnternet, preter, distribuer et vendre des theses partout dans le monde, a des fins commerciales ou autres, sur support microforme, papier, electronique et/ou autres formats.
The author retains copyright ownership and moral rights in this thesis. Neither the thesis nor substantial extracts from it may be printed or otherwise reproduced without the author's permission.
L'auteur conserve la propriete du droit d'auteur et des droits moraux qui protege cette these. Ni la these ni des extraits substantiels de celle-ci ne doivent etre imprimes ou autrement
reproduits sans son autorisation.
In compliance with the Canadian Privacy Act some supporting forms may have been removed from this thesis.
While these forms may be included in the document page count, their removal does not represent any loss of content from the thesis.
Conformement a la loi canadienne sur la protection de la vie privee, quelques
formulaires secondaires ont ete enleves de cette these.
Bien que ces formulaires aient inclus dans la pagination, il n'y aura aucun contenu manquant.
DECLARATION OF CO-AUTHORSHIP / PREVIOUS PUBLICATION
I. Co-Authorship Declaration
I hereby declare that this thesis incorporates material that is result of joint research of the author and his supervisor Prof. Waguih ElMaraghy. This joint research has been published / submitted to numerous Journals and conferences that are listed below.
I am aware of the University of Windsor Senate Policy on Authorship and I certify that I have properly acknowledged the contribution of other researchers to my thesis, and have obtained written permission from Prof. Waguih ElMaraghy to include that material(s) in my thesis. I certify that, with the above qualification, this thesis, and the research to which it refers, is the product of my own work.
II. Declaration of Previous Publication
This thesis includes [3] original papers that have been previously published/submitted for publication in peer reviewed journals, as follows:
Publication title/full citation Status
1
Arafa, A. and W. ElMaraghy (2011). "Manufacturing strategy and enterprise
dynamic capability." CIRP Annals-Manufacturing Technology, 60, 507-510. Published
2
Arafa, A. and W. ElMaraghy (2011). "Exploring the Dynamics of Volume
Flexibility." 44th CIRP Conference on Manufacturing Systems. Published
3
Arafa, A. and W. ElMaraghy (2011). "Quantifying the Enterprise Strategic
Flexibility." The 4th International Conference on Changeable, Agile,
Reconfigurable and Virtual Production (CARV 2011).
Published
I certify that I have obtained a written permission from the copyright owner(s) to include the above published material(s) in my thesis. I certify that the above material describes work completed during my registration as graduate student at the University of Windsor.
I certify that, to the best of my knowledge, my thesis does not infringe upon anyone's copyright nor violate any proprietary rights and that any ideas, techniques, quotations, or any other material from the work of other people included in my thesis, published or otherwise, are fully acknowledged in accordance with the standard referencing practices. Furthermore, to the extent that I have included copyrighted material that surpasses the bounds of fair dealing within the meaning of the Canada Copyright Act, I certify that I have obtained a written permission from the copyright owners) to include such material(s) in my thesis.
ABSTRACT
From a system thinking perspective, the competition / cooperation boundaries govern the evolution of a firm's adaptive strategic behaviour and drive it towards its desired objectives. Strategic flexibility is considered a sustainability advantage in today's global competitive environment. This study explores the strategic flexibility capability that fits with the market requirement and the degree of competition it faces in its market(s).
After exploring the link between the manufacturing objectives and their effect on the total industry performance in terms of profitability, product availability and capacity utilization, this study quantify the strategic effect of applying five different strategies on the enterprise strategic flexibility capability. By modeling and analyzing different scenarios using a system dynamic simulation approach and considering the market competitive dynamics, this model introduces the volume flexibility as a macro strategic measure that affects the firm's intended production capacity. The effect of enterprise volume flexibility on its market share is studied and reported.
DEDICATION
No words or actions in this world may express my gratitude and love for my Parents.
r
ACKNOWLEDGEMENTS
I like to give my sincere thanks to my dissertation advisor, Prof. Waguih ElMaraghy, for his direction, assistance, encouragement, and guidance. He challenged me to this research topic. In each phase of this research, he provided invaluable support. He was always there to encourage me. Beyond his guidance on the research work, he also showed me how to conduct a research and how to be a good researcher even under very tight deadlines.
I would like to express my gratitude to Prof. Hoda ElMaraghy. I am extremely lucky to have her as a member of my dissertation committee. Her teaching and guidance was critical to my dissertation work. She guided me through the problem identification, model validation and the presentation of results.
I am thankful to Prof. Fritz Rieger for providing valuable suggestions on improving the theoretical perspectives of this research. Also for his comments and support during this research. The classes that I attended with him were a cornerstone to this research.
I am very indebted to Dr. Zbignew Pasek for his teaching, guidance, contributions and challenging questions throughout the work.
There are not enough words to thank my parents for their support, endurance and encouragement during all time of hard work to achieve this degree.
TABLE OF CONTENTS
DECLARATION OF CO-AUTHORSHIP / PREVIOUS PUBLICATION iii
ABSTRACT iv
DEDICATION v
ACKNOWLEDGEMENTS vi
LIST OF TABLES x
LIST OF FIGURES xi
LIST OF NOMENCLATURE xv
I. ENTERPRISE STRATEGIC FLEXIBILITY
1.1. Research Motivation 1
1.2. Research Objective 2
1.3. Thesis Statement 3
1.4. Thesis hypotheses 3
1.5. Novelty of Research 4
1.5.1. Novelty of Scope and Methodology 4
1.5.2. Novelty of Analytical Approach 4
1.5.3. Novelty of Model Parameters 4
1.6. Research Approach 5
1.7. Dissertation Structure 5
II. DYNAMIC COMPETITIVE CAPABILITY
2.1. Manufacturing Strategy Literature Survey 7
2.2. Manufacturing Capability 8
2.3. Manufacturing Capabilities Relationship and Dynamics 10 2.4. Sustainable Competitive Advantage 14 2.5. Dynamic Sustainable Capabilities 17
2.5.1.Path s 18
2.5.2. Processes 18
2.5.3. Position 18
2.6. Dynamic Capability Life Cycle (CLC) 21 2.7. Dynamic Capabilities Value and Cost 22 2.8. Manufacturing Strategy Trade-off 22
2.9. Dynamic Capabilities as a source for Strategic Agility 24 2.10. The Degree of Fit with External Environment 25
2.11. Organization Inertia 26
2.12. Industry Life Cycle and Customer Preferences Rate of Change28 2.13. Manufacturing Fitness and Landscape theory 31
III. COMPLEX DYNAMIC INDUSTRIAL LANDSCAPE
3.1. Complex Adaptive Economics 35
3.2. The Risk and limitation of Neo-classical Models 37
3.3. Dynamic Industrial Landscape 38
3.3.1. Individuals as Agents in Complex Adaptive System 40 3.3.2. Design Space for Business Solutions 43 3.3.3. Landscape Payoff: Performance or Profitability 45
3.4. Industrial Landscape Evolution 47
IV. STRATEGIC FLEXIBILITY FORMULATION AND RESULTS
4.1. Modelling Tool 52
4.2. Model Structure 56
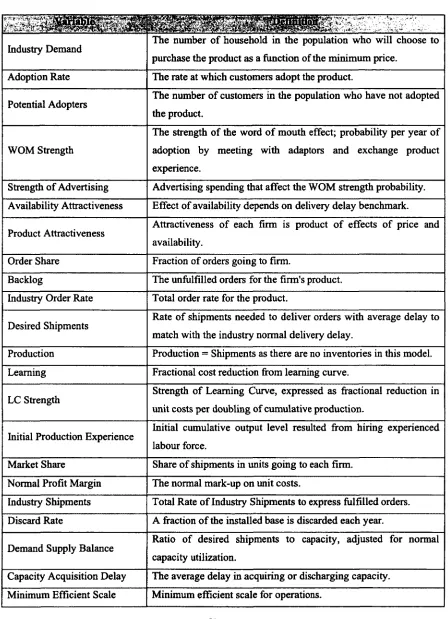
4.2.1. Variables Definitions 60
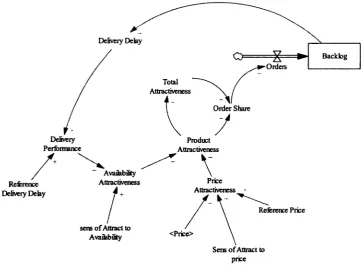
4.2.2. Product Attractiveness Sub-model 62
4.2.3. Order Demand Sub-model 64
4.2.4. Capacity Planning and Control Sub-Model 66 4.2.5. New Product Introduction Sub-Model 69 4.2.6. Manufacturing Flexibility Sub Model 71
4.3. Base Case Simulation Results 74
4.3.1. Lower Initial prices 78
4.3.2. New Product Development 80
4.4. Strategic Flexibility Simulation Results 81
4.4.1. Order Fulfilment Competition 81
4.4.2. Outsourcing Performance Competition 83
4.4.3. Learning Effect Competition 86
4.4.4. Three Scenarios Comparison 88
4.5. External Environment Simulation Results 90
4.5.1. The Learning Effect 93
4.5.2. Order Fulfillment Capability 94
4.5.3. Outsourcing Performance 97
V. STRATEGIC FLEXIBILITY MODEL VALIDATION
5.1. Introduction 100
5.2. Monte Carlo Sensitivity Testing 102
5.3. Extreme Case Analysis 108
VI. CONCLUSION AND FUTURE WORK
6.1. Conclusion 115
6.2. Main Findings 117
6.3. Study limitations 118
6.4. Future Work 118
REFERENCES 120
APPENDICES
Appendix A: Disequilibrium Dynamics Model Formulation 128 Appendix B: Used Vensim Equations for the Base Case 134 Appendix C: Mapping Key Parameters Relationship 140 Appendix D: Detailed Manufacturing Strategy Research Survey 145
LIST OF TABLES
TABLE 1 MANUFACTURING STRATEGY LITERATURE SURVEY 7
TABLE 2 COMPLEXITY AND TRADITIONAL ECONOMICS VIEW COMPARISON 35
TABLE 3 MODEL VARIABLES DEFINITIONS 61
TABLE 4 INITIAL PARAMETERS FOR THE BASE CASE 73
TABLE 5 PARAMETERS INITIAL CONDITIONS AND DEFINITIONS 133
TABLE 6 WORK CONTRIBUTED TO MS FOCUSING ON MANUFACTURING CAPABILITIES... 145
LIST OF FIGURES
FIGURE 1 OPERATION STRATEGY MODEL 9
FIGURE 2 SAND CONE MODEL (FERDOWS AND DE MEYER 1990) 10
FIGURE 3 CONCEPTUAL MODEL OF STRATEGIC RESOURCE HIERARCHY (GROBLER 2005)... 11
FIGURE 4 SYSTEM DYNAMICS MODEL OF STRATEGIC CAPABILITY (GROBLER 2005) 12
FIGURE 5 DYNAMIC RESOURCE / CAPABILITY SYSTEM (GROBLER 2007) 14
FIGURE 6 THE FIVE FORCES THAT SHAPE INDUSTRY COMPETITION (PORTER 1998) 16
FIGURE 7 EXAMPLES OF THE ROLES OF PROCESS IN THE DYNAMIC CAPABILITY 19
FIGURE 8 EXAMPLES OF POSITIONS IN THE DYNAMIC CAPABILITY 20
FIGURE 9 ALIGNMENT BETWEEN MANUFACTURING FUNCTION AND BUSINESS STRATEGY
(GONZALEZ-BENITO AND SUAREZ-GONZALEZ 2009) 23
FIGURE 10 LEAN OR AGILE AS STRATEGIC CHOICES (HALLGREN AND OLHAGER 2009) 24
FIGURE 11 ORGANIZATIONAL INERTIA AND PERFORMANCE (LARSEN AND LOMI 2002) 28
FIGURE 12 RUGGED LANDSCAPE (WRIGHT 1932) 31
FIGURE 13 MANUFACTURING CAPABILITIES HYPERCUBE (MCCARTHY 2004) 32
FIGURE 14 A ROUTE OR ADAPTIVE WALK FROM POINT A TO B (MCCARTHY 2004) 34
FIGURE 15 ROUGHLY CORRELATED FITNESS LANDSCAPE FOR MARKET (N) AT TIME (T) 39
FIGURE 16 MARKET SEGMENTS AS MANUFACTURING PRIORITY (COST & AVAILABILITY). 41
FIGURE 17 MEASURING MANUFACTURING OBJECTIVE (HALLGREN AND OLHAGER 2006). 42
FIGURE 18 DESIGN SPACES AND MARKET LANDSCAPE 45
FIGURE 19 FITNESS LANDSCAPE FOR MARKET (N) AT TIME (T) AND (T+ 1) 49
FIGURE 20 MARKET EVOLUTION MECHANISM 50
FIGURE 22 STRATEGIC DECISIONS BASED ON INDUSTRY BENCHMARK 58
FIGURE 23 MARKET SEGMENTATION 59
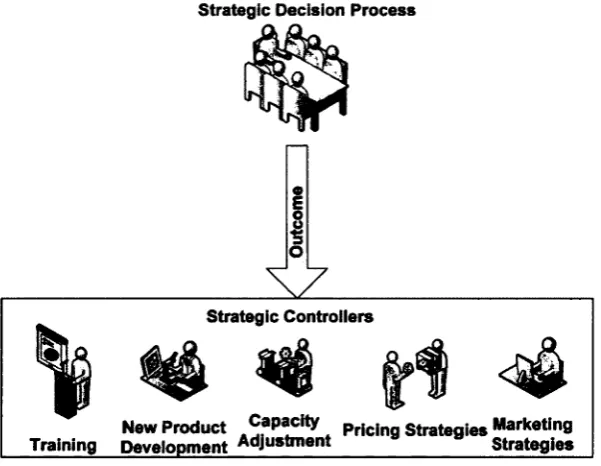
FIGURE 24 STRATEGIC CONTROLLERS AVAILABLE TO THE ENTERPRISE 60
FIGURE 25 PRODUCT ATTRACTIVENESS SUB-MODEL 63
FIGURE 26 ORDER RATE AND PRODUCT ADOPTION SUB-MODEL 64
FIGURE 27 ORDER FULFILLMENT SUB-MODEL 68
FIGURE 28 NEW PRODUCT DEVELOPMENT SUB MODEL 70
FIGURE 29 VOLUME FLEXIBILITY SUB MODEL 73
FIGURE 30 ADOPTION RATE FOR THE 3 SCENARIOS 74
FIGURE 31 TOTAL INDUSTRY DEMAND FOR THE 3 SCENARIOS 75
FIGURE 32 FIRM F1 & F2 DESIRE THE SAME MARKET SHARE 75
FIGURE 33 MARKET SHARE FOR FIRM F1 AND F2 IN THE BASE CASE 76
FIGURE 34 CAPACITY UTILIZATION FOR FIRM F1 AND F2 IN THE BASE CASE 76
FIGURE 35 BACKLOG FOR FIRM F1 AND F2 IN THE BASE CASE 77
FIGURE 36 PRODUCT PRICE FOR FIRM F1 AND F2 IN THE BASE CASE 77
FIGURE 37 VOLUME FLEXIBILITY FOR FIRM F1 AND F2 IN THE BASE CASE 78
FIGURE 38 MARKET SHARE FOR FIRM F1 AND F2 WITH LOWER PRICES SCENARIO 79
FIGURE 39 THE RELATIVE IMPORTANCE OF VOLUME FLEXIBILITY WITH LOWER PRICES .... 79
FIGURE 40 NEW PRODUCT DEVELOPMENT FOR FIRM F1 AND F2 80
FIGURE 41 FIRM F2 OUTPERFORMS F1 IN ORDER FULFILMENT (40 YEARS) 82
FIGURE 42 FIRM F2 OUTPERFORMS F1 IN ORDER FULFILMENT (5 YEARS) 83
FIGURE 43 FIRM F2 OUTPERFORMS F1 IN OUTSOURCING (40 YEARS) 84
FIGURE 45 FIRM F2 OUTPERFORMS F1 IN LEARNING EFFECT (40 YEARS) 86
FIGURE 46 FIRM F2 OUTPERFORMS F1 IN LEARNING EFFECT (5 YEARS) 87
FIGURE 47 THE THREE SCENARIOS COMPARISON (40 YEARS) 88
FIGURE 48 THE THREE SCENARIOS COMPARISON (5 YEARS) 89
FIGURE 49 THE ADOPTION RATE FOR THE BASE CASE 91
FIGURE 50 THE ACCUMULATED ADOPTERS FOR THE BASE CASE 91
FIGURE 51 FIRM F1 AND F2 MARKET SHARE FOR THE BASE CASE 92
FIGURE 52 FIRM F1 AND F2 VOLUME FLEXIBILITY FOR THE BASE CASE 92
FIGURE 53 THE EFFECT OF ORGANIZATION LEARNING CURVE ON VOLUME FLEXIBILITY .... 93
FIGURE 54 MARKET SHARE DUE TO CHANGE IN THE ORGANIZATION LEARNING CURVE .... 94
FIGURE 55 THE EFFECT OF ORDER FULFILLMENT CAPABILITY ON VOLUME FLEXIBILITY .... 95
FIGURE 56 MARKET SHARE DUE TO CHANGE IN ORDER FULFILLMENT CAPABILITY 95
FIGURE 57 THE RELATIVE IMPORTANCE OF PRODUCT AVAILABILITY CAPABILITY 96
FIGURE 58 THE EFFECT OF OUTSOURCING PERFORMANCE ON VOLUME FLEXIBILITY 97
FIGURE 59 MARKET SHARE DUE TO CHANGE IN OUTSOURCING CAPABILITY 97
FIGURE 60 MARKET SHARE FOR FIRM F1 AND F2 (WITH VERTICAL ZOOM) 98
FIGURE 61 OUTSOURCED PRODUCTION FOR FIRM F1 AND F2 98
FIGURE 62 THE MARKET SHARE FOR THE 3 STRATEGIES 99
FIGURE 63 LOGICAL SEQUENCE OF MODEL VALIDATION (BARLAS 1994) 101
FIGURE 64 ADOPTION RATE FOR THE OD AND NDD CASE SCENARIOS 104
FIGURE 65 ADOPTERS FOR THE OD AND NDD CASE SCENARIOS 104
FIGURE 66 CAPACITY AND VOLUME FLEXIBILITY ANALYSIS FOR FIRM F1 AND F2 106
FIGURE 68 STRATEGIC SELECTION FOR FIRM F1 AND F2 108
FIGURE 69 TARGET CAPACITY FOR FIRM FL AND F2 109
FIGURE 70 VOLUME FLEXIBILITY FOR FIRM FL AND F2 110
FIGURE 71 MARKET SHARE FOR FIRM FL AND F2 110
FIGURE 72 TARGET CAPACITY FOR FIRM FL AND F2 ILL
FIGURE 73 VOLUME FLEXIBILITY FOR FIRM FL AND F2 ILL
FIGURE 74 MARKET SHARE FOR FIRM FL AND F2 112
FIGURE 75 TARGET CAPACITY COMPARISON WITH THE BASE CASE 113
FIGURE 76 VOLUME FLEXIBILITY COMPARISON WITH THE BASE CASE 113
LIST OF NOMENCLATURE
Ay Product Total Attractiveness
Ap Attractiveness From Price
Av Attractiveness From Availability
sP Preference For Price
Sv Preference For Availability
DP Delivery Performance
Dd Delivery Delay
RD<j Reference Delivery Delay
B Backlog
S Shipments
P Price
LP Lowest Available Price
0 Orders Received To The Firm
dO/dt Total Industry Order Rate
dAJdt Product Adoption Rate
WOM Word Of Mouth
POP Market Population
£T Number Of Products Per Customer
h Installed Base Of The Product
d D / d t Discard Rate
SA Actual Shipment
sd Desired Shipment
NDD Normal Delivery Delay
C Production Capacity
S„ Outsourced Shipments
0D Outsourcing Performance Delay
Cad Capacity Acquisition Delay
NCU Normal Capacity Utilization
CT Target Capacity
MES Minimum Efficient Scale Of Production
EID Expected Industry Demand
NPD Time Required For The New Product Development
Fc Fixed Cost
UFc Unit Fixed Cost
UVc Unit Variable Cost
a Number Of Capacity Units Required Per Part Produced
b Contribution Margin For The Product
LS Learning Curve Strength
CHAPTER I
ENTERPRISE STRATEGIC FLEXIBILITY
1.1. Research Motivation
For industrial organizations to succeed and survive in volatile fast changing markets, they should build a reliable architecture that allows them to develop a sustainable competitive advantage. Building such reliable architecture automatically reduces their organizational flexibility. As a result, any current successful capability contains risk of rigidity and bureaucratic grid lock in the face of the continuous changing environment and short windows for opportunities. As a consequence, organizations are confronted with a dilemma: on the one side, they have to develop reliable patterns of selecting and linking resources in order to attain superior performance and competitive advantages and on the other side this contains considerable risk of becoming locked into exactly these "successful reliable capabilities".
Industrial researchers developed flexible manufacturing systems to respond to the request for more variety of product styles dictated due to new market challenges and uncertainties. These systems are capable of adapting to changing demand patterns which in turns gave a sort of competitive advantage and production flexibility to the organizations that implemented it. Though, bureaucratic organizations with flexible production systems will suffer both the high cost of such production systems setup and the negative consequences of being rigid in a fast changing competitive environment and may break down and exit the industry very fast. This bring to attention the importance of the capability the enterprise build over time and how dynamic it is to match with the market changing conditions. The strategic decision in this case is irreversible, vital for success and in most cases there is a trade offs in selection.
"Global Strategic Flexibility" for the enterprise which can be considered as a boarder view of flexibility in industrial organizations. In this stream, "Flexible" means giving a "Dynamic Capability" that allows organizations to occupy a favourable market position and to continuously create, define, discover and exploit entrepreneurial opportunities that are valuable in reference to the market benchmark at any point of time and to the process of organizational wealth creation as well.
The study takes into consideration the rigidity developed through the organizational life cycle stages, the forces generated from the industry dynamics through the interactions of firms together fighting over maximizing their market share and profitability, and finally the individual needs, preferences and capabilities as a foundation for the dynamics of the competing market landscape. All these consideration are enveloped with evolutionary mechanisms.
1.2. Research Objective
Structural and operational decisions are strategic and irreversible as they may or may not increase the manufacturing flexibility as competitive capability to the firm. The objective of this study is as follows:
• Explore the dynamics of volume flexibility and the possible avenues that may affect it.
• Evaluate the strategic benefit of gaining volume flexibility capability from direct capacity adjustment, strategic alliances, or changing the targeted market segment and considering both the expected behaviour of competition and the market dynamics. • Develop new macro measures for organizations to evaluate and plan their strategies
by quantifying the relative importance of, and gains from, their long term decisions. • Develop a strategy simulator for industrial enterprises using system dynamics to
enhance their decision making capability based on educated assumption and considering the disequilibrium market dynamics.
1.3. Thesis Statement
Linking volume flexibility, founded in operations management theory, with the dynamic capability theory via system dynamics allows for rational enterprise strategic decision making capability and hence achieves organizational strategic flexibility that may outperform competition.
1.4. Thesis hypotheses
The process of creating dynamic capabilities is built by continuous integration and coordination of all organizational activities. Internal activities are represented in process planning, information process and automation capabilities. While external activities are represented in strategic alliances, virtual cooperation and supplier relation. The hypotheses of this research are as follows:
• Matching between the firm capabilities and its external environment is a critical factor for organizational success.
• Success level is relative to the competitor simultaneous actions and reactions while the effect differs from market to another according to the occurring scenarios.
• The competitive advantage occurs when it is unique to the company and matches with the market variables for limited time.
• A trade-off between flexibility and cost govern the relationship between the manufacturing priorities and controls the strategic direction of any industrial enterprise.
• Customer preferences evolve according to the intensity of the competition. • Competition affects firms' profitability and market share.
• The relative importance of the dynamic capabilities value for organization at any point of time is proportional to the competition performance.
• Any change in the environment conditions may change the weights of the activated capability and accordingly will change the organization market position and the relative importance of its developed capability.
1.5. Novelty of Research
1.5.1. Novelty of Scope and Methodology
• Developing a strategic framework that guide the enterprise strategic decision making process.
• Developing new macro measures for enterprise manufacturing strategy by integrating the traditional volume flexibility into a nonlinear dynamic model.
• Linking enterprise strategic decision making with volume flexibility into a nonlinear system dynamic model.
• Quantifying the dynamic capability of enterprise organization considering the disequilibrium market dynamics in a comparative game theoretic analysis by considering the simultaneous strategic decisions of competition.
1.5.2. Novelty of Analytical Approach
The approach is based on relating the manufacturing objectives and their effect on the total enterprise performance to profitability, product availability and capacity utilization using a system dynamic model that capture the strategic intent of the competing firms. This is an attempt to better manage the strategic decisions faced by managers in different market scenarios.
1.5.3. Novelty of Model Parameters
• Introducing a comparative reference price to the latest available price in the market to support the price competitiveness as effective parameter that changes the market dynamics and hence affect the relative importance of the firms developed capability. • Introducing the firm's outsourcing performance through outsourcing delay in
• Coupling two product life cycles to examine research and development effect by introducing new products on firm's market share and dynamics.
• Linking the learning effect to the enterprise volume flexibility to explore the advantage gained by changing the unit variable and fixed cost of the product and hence studying the effectiveness of adopting intense labour training strategy to advance the firms market position.
• Relating the volume flexibility relationship with the enterprise market share and the firm's strategic intent to analyze the effective strategy in different market speeds.
1.6. Research Approach
Using a system dynamics methodology, the study constructs a formal model for dynamic competitive environment that test the hypothesis of the firm's dynamic capabilities derived from the developed evolutionary perspective of a complex industrial landscape. This is done in a way to verify any findings of which resources, individually or in combination, account for a firm's success and what strategies that firm can use to occupy the favourable market position relative to its competition.
1.7. Dissertation Structure
Chapter 2 first presents a critical literature review for the manufacturing strategy then
for the manufacturing capability by introducing its components, relationships and internal dynamics. To explain the concepts of competitive advantage and what makes it sustainable and dynamic with the external challenging market environment; specific focus is given to the dynamic capability theory, its life cycle, added values and cost. The dilemma of organizational rigidity is tackled by linking the concepts of manufacturing trade-offs, strategic agility, organizational inertia with the degree of fit with external environment and the industry life cycle and customer preferences evolution. To represent the competitive environment, the manufacturing landscape concept is reviewed and presented.
Chapter 3 presents a new representation for a complex industrial landscape, how it is
transformation. First, a comparison between the complex view of economics and the traditional one is presented to highlight the risk and limitation of the assumptions introduced in the Neo-classical models. The factors that affect the industrial landscape such as agents, business solutions, and profitability are introduced and discussed in details to draw a rigid boundary for the theoretical representation of the proposed landscape. Finally, considering all these factors, an evolutionary mechanism for the landscape is introduced.
Chapter 4 presents the used modeling tool to explain why specifically system dynamics
as a concept fits with the scope of this research. After explaining the conceptual model structure, a detailed discussion for the model variables and sub-models are introduced one by one. Starting from the product attractiveness, order demand, capacity planning and control, new product development, following to the volume flexibility sub-model, a detailed set of differential equations are presented. The base case simulation results are first presented before introducing the first case study with 3 scenarios that highlight the quantitative approach of the enterprise strategic flexibility. This allows for a comparative analysis between two competing firms to explore the effectiveness of using different set of strategies and also to evaluate the relative importance of the organization capability in facing its competition. To show the difference in strategic performance due to different market speeds and industry setup, another case study that represents a fast market is represented to examine the same set of strategies used in the first case. A conclusion from both cases is driven to prove the thesis hypothesis.
Chapter 5 focuses on validating the presented model and results. A sensitivity analysis is
first conducted before introducing another two case studies. These two case studies represent the extreme case analysis to show the importance and significance of the new developed macro measure; namely volume flexibility. After each case a comparative analysis is conducted to conclude the results.
Chapter 6 presents the conclusion, the main findings and finally a recommendation for
CHAPTER II
DYNAMIC COMPETITIVE CAPABILITY 2.1. Manufacturing Strategy Literature Survey
Classification of research direction on the manufacturing strategy can be classified in six different categories. Manufacturing capabilities includes literature on competitive priorities, i.e. cost, quality, delivery, flexibility, etc. Strategic choices include literature on specific structural and infrastructural criteria like human resource, technology, information technology, organization and management and environmental aspects. Best practices include literature on advanced manufacturing technologies and better management practices like JIT, TQM, OPT, etc. Trans-national comparison includes literature on cross-country wide studies comparing various nations' manufacturing strategy practices. Performance measurement includes research on performance measurement system design, development and assessment methodologies (such as survey, scale development, empirical research methods, etc.). And literature survey includes articles which reviewed the manufacturing strategy literature. A detailed analysis for literature survey done on manufacturing strategy considering all the above categories is shown in Table 1.
Table 1 Manufacturing Strategy literature Survey
Method Best Literature Manuf. Performance Process Strategic Transn. Grand
Practices Survey Capab. Measurement choices Comp. Total
Conceptual 3 3
Descriptive 3 20 6 2 5 36
Empirical 4 4 10 4 5 1 28
Exploratory
1 1 A
longitudinal 1 1
Exploratory
cross-sectional 10 16 3 2 6 1 38
Grand Total 17 4 49 14 10 14 1 109
categories is presented in appendix D. A more comprehensive presentation can be found in (Dangayach and Deshmukh 2001).
The methodologies used in research are classified in five categories as follows:
• Conceptual. Used to present basic/fundamental concepts on manufacturing strategy.
• Descriptive: Explain manufacturing strategy content, processes or performance
measurement issues.
• Empirical: Using data for study from existing database, review, case study, taxonomy
or typology approaches.
• Exploratory cross-sectional: Survey where information is collected at one point in
time.
• Exploratory longitudinal: Survey where data collection is done at two or more points
over time in the same organizations.
2.2. Manufacturing Capability
Skinner introduced manufacturing strategy as to exploit certain properties of the manufacturing function to achieve competitive advantages (Skinner 1969b). Since his work, scholars contributed in defining the manufacturing strategy under the umbrella he proposed. Manufacturing strategy was described as a consistent pattern of decision making in the manufacturing function linked to the business strategy (Hayes and Wheelwright 1984a). Also it was defined as a tool for effective use of manufacturing strengths as a competitive weapon for achievement of business and corporate goals (Swamidass and Newell 1987). The more accepted one and commonly used is "a pattern of decisions, both structural and infrastructural, which determine the capability of a manufacturing system and specify how it will operate, in order to meet a set of manufacturing objectives which are consistent with the overall business objectives" (Platts et al. 1998).
customer orders to deliver fast or as promised; and Flexibility: react to changes in product, product mix, modification to design, fluctuations in material, and changes in sequence (Wright 1984).
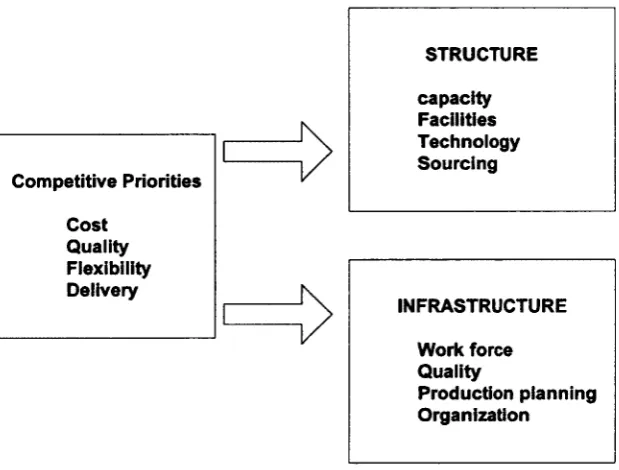
Based on the operation strategy models, to develop manufacturing capabilities, the manager will have decisions in two categories: structural and infrastructural. Structural decisions are concerned with the capacity, technology, facilities, and sourcing. Infrastructural decisions are concerned with the workforce, quality, production planning and organization, as shown in Figure 1.
Competitive Priorities
Cost Quality Flexibility Delivery
STRUCTURE
capacity Facilities Technology Sourcing
INFRASTRUCTURE
Work force Quality
Production planning Organization
Figure 1 Operation strategy model
2.3. Manufacturing Capabilities Relationship and Dynamics
Scholars in the strategy field debated over the relationship between manufacturing competitive priorities. The debate involved three perspectives: the trade off, cumulative and integrative models. Some researchers called for plants to focus on a single manufacturing capability and devote their limited resources accordingly (Wright 1984), while others claim that advanced manufacturing technology enables concurrent improvements in quality, cost, flexibility, and delivery (Mapes et al. 1997). In spite of these two extreme perspectives, the integrative perspectives seek to settle differences between trade off and cumulative model. The "sand cone model" presented by (Ferdows and De Meyer 1990) advocating that plants should build capabilities sequentially, first seeking high quality, then dependable delivery, followed by speed and cost as show in Figure 2. Each successive capability becomes the primary focus once minimum levels of the preceding capabilities have been achieved.
Cost efficiency
Speed
Dependability
Quality
Figure 2 Sand cone model (Ferdows and De Meyer 1990)
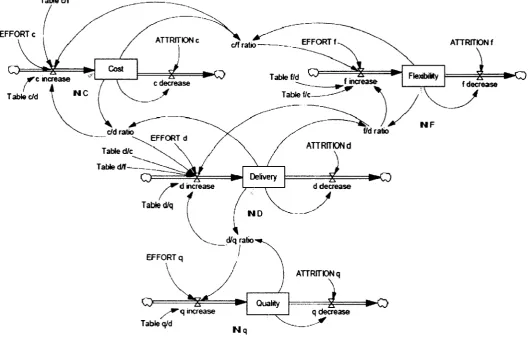
Also cumulative manufacturing capabilities can be viewed as flow and stocks due to its natural of bath dependency and irreversibility. Assuming that there are supportive relationships and inhibiting relationships between capabilities, (GroBler 2005) investigated the dynamics of accumulation processes of strategic capabilities in manufacturing, i.e. cost, quality, delivery and flexibility. The Y-form of strategic capabilities, shown in Figure 3, was derived from an empirical examination of capabilities within manufacturing plants. In that study, 465 manufacturing plants from 14 countries were investigated with the help of the IMSS questionnaire (International Manufacturing Strategy Survey). The proposed sequence of capabilities identified the lower levels 'quality' then 'delivery' as the base for an accumulation of capabilities. 'Flexibility' and 'Cost' were put on one level and it was assumed a trade-off relationship rather than a supportive relationship exists between the two.
i - Cost « • Flexibility -1
i i i i i • Delivery "
i
• > supportive
J — — — inhibiting
Quality*
-Figure 3 Conceptual model of strategic resource hierarchy (GroBler 2005)
Table c/f
EFFORTc
ATTRfTION c EFFORT f ATTRITION f
c/f ratio
Cost
Table f/d increase c decrease
f decrease
NC Table f/c
Table c/d
NF f7d ratio
c/d ratio
EFFORT d Table d/c
Table d/f
Delivery
d decrease
Table d/q
ND
d/q ratio
EFFORTq
ATTRITION q
*o
Quality
q decrease increase
Table q/d
Nq
The model reflected the mechanism of capability accumulation and trade-off. However, little did it add to the question of what exactly causes supportive relationships between capabilities and how they can be oppressed or linked to the enterprise external environment? Also the effect of competitor's strategies and its effect on the total industry performance and market dynamics were ignored in most of these studies.
The relationship between the choice of strategic resources that built a dynamic capability and the effect of these capabilities over the organization performance using a system dynamic perspective was the focus of many scholarly researches. (Heene and Sanchez 1997) identified that the strategic resources and capabilities of a firm build a system. The system components depend on each other and affect each other. These dependencies establish feedback loops, so that resources and capabilities influence themselves. Also the study identified that the systems of resources and capabilities are not stable over time. Capabilities develop and decay dynamically and their relationships change over time. Thus, the dynamics of each resource and each capability as well as the dynamic and complex interaction between them can be influenced and must be managed.
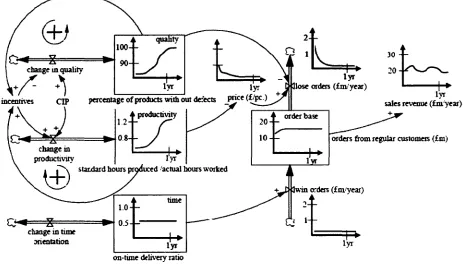
To include the external environment, (GroBler 2007) introduced another dynamic view on strategic resources and capabilities applied to an example from the manufacturing strategy literature. The study argued that industrial company's performance is substantially determined by the strategic resources it possesses and by the capabilities that can be derived from them. The application of these internal resources and capabilities to an external context of markets and competition is a critical factor contributing to the success of a company. The illustrated approach was built based on Warren's strategy dynamics (Warren 2002) using a system dynamics methodology as shown in Figure 5. The finding concluded that the resources and capabilities can be interpreted as stocks in dynamic simulation models following ideas from system dynamics.
in reference to certain set of targets and performance indicators but not to the whole system performance. In short the success measure is relative to the degree of fit with the external environment as will be discussed and elaborated later in more detail.
0
X change in qualityincentives CIP percentage of protects with out detects P"cf
0 8 -change in
productivity
lyr lose orders (fin1 year)
30
20
standard hours produced 'actual hours worked
C~ » X change in time
mentation
1.0-
0.5-> time
1.0-
0.5i -ly*
i 1 order base
20-
10"
-lvr
lyr sales revenue (tm year)
+«
orders from regular customeis (£m)
win orders (imyear)
on-time delivery ratio
Figure 5 Dynamic resource / capability system (Grofiler 2007)
2.4. Sustainable Competitive Advantage
selection process and constrained by the fact that the relative value of capabilities and resources varies over time and cost money and effort to develop.
The typical strategic planning process for indusial enterprise starts by defining the firm's business strategy that it will possess. Firms have to generate a portfolio of capabilities that will determine the contribution of the manufacturing function to business performance. Following different market scenarios, aggressive strategy may cause unutilized capacity due to the lags in reducing capacity while conservative strategy with lags in capacity expansion and unfulfilled backlog may lose portion of the market share to its competitor allowing a chance of locking the market to their competitor's favour (Arthur 1989). But finally, industrial enterprise should seek to develop competitive advantage and mange its market position to compete in dynamic markets with respect to their competition. These increases the level of complexity mangers faces in their long term decisions.
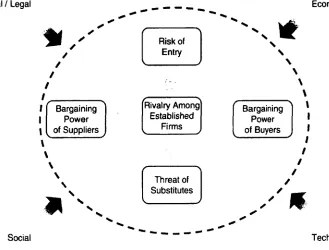
One of the most familiar frameworks for strategic analysis is known as porter's five forces framework (Porter 1998). The five competitive forces that directly affect the organization market positions are the threat of new entrants, threat of substitute products or services, bargaining power of suppliers, bargaining power of buyers, and rivalry as shown in Figure 6. Other factors such as political, economic, social and technological affect the set of forces that shape any market structure and organization position as well. Each organization has its own capabilities, strengths and weaknesses through each stage of its life cycle.
around constraints on profitability or even reshape the forces in its favour. By understanding these forces, firm may be able to manage its market position.
Political / Legal Economic
*
Risk ofBargaining Power of Suppliers
/
Rivalry Among Established
Firms
^ J
f \
Bargaining Power of Buyers
*
Threat of Substitutes
Social "" Technological
Figure 6 the five forces that shape industry competition (Porter 1998)
current and expected available market space. Also it is important to mention that this approach did not include the firm's internal resources and its effect on performance.
Another approach known as the Resource-Based View (RBV) argues that resources that are simultaneously valuable, rare, imperfectly imitable and imperfectly substitutable are a source of competitive advantage (Barney 1991). The underlying assumption of the RBV of the firm is that resources are heterogeneous across organizations and that this heterogeneity can sustain over time (Peteraf 1993). The RBV was considered as static approach and did not specifically address how future valuable resources could be created or how the current stock of valuable resources can be refreshed in changing environments (Barney 2001). The dynamic capability perspective proposed a solution for this static view of the RBV.
The following sections will elaborate on the source of competitive advantages by focusing on the available avenues for creating dynamic sustainable competitive advantage and highlighting the link between the competitive strategic behaviour of the firm and how it affects customer preferences and industry life cycle.
2.5. Dynamic Sustainable Capabilities
For organization to succeed and survive in a dynamic competitive landscape, they should build a reliable architecture that allows them developing sustainable competitive advantage. The original definition for the dynamic capability is 'the firm's ability to integrate, build, and reconfigure internal and external competences to address rapidly changing environments' (Teece et al. 1997). In return, this will help the organization to maintain their favourable position in the market landscape and allow them to evolve with the changeable environment by adapting with its conditions. And finally, the competitive advantage of firms lies with its managerial and organizational processes, shaped by its (specific) asset position, and is limited by the available paths only.
are critical, the rate of technological change is rapid, and the nature of future competition and markets difficult to determine. The term 'capabilities' emphasizes the key role of strategic management in appropriately adapting, integrating, and reconfiguring internal and external organizational skills, resources, and functional competences to match the requirements of a changing environment. In conclusion, the competitive advantage of firms lies with its managerial and organizational processes, shaped by its (specific) asset position, and the paths available to it (time dependant). The factors that will help in determining a firm's distinctive competence and dynamic capabilities are organized in three categories: processes, positions, and paths. Each will be discussed as follow:
2.5.1. Paths
Paths were referred to the strategic alternatives available to the firm, and the presence or absence of increasing returns and attendant path dependencies. Where a firm can go is a function of its current position and the paths ahead. Its current position is often shaped by the path it has traveled. Thus a firm's previous investments and its 'history' constrain its future behaviour. This highlights the importance of the initial conditions for the enterprise.
2.5.2. Processes
A managerial and organizational process refers to the way things are done in the firm, or what might be referred to as its routines, or patterns of current practice and learning. Organizational processes have three roles: coordination/integration (a static concept); learning (a dynamic concept); and reconfiguration (a transformational concept). Examples of each of those roles are described in Figure 7.
2.5.3. Position
Internal Activities Process —Planning Information —Process Automation —Capabilities Culture related —activies Coordination I Integration External Activities Strategic Alliances Virtual —Corporation Buyer -relations Supplier -relation Dynamic Capabilities
Learning Reconfiguration
Skills Knowledge Integration of all
activities with technologies
Direct mpact on quality performance, development cost, development lead time Individual I—Skills Organizational -Skills Individual —Knowledge Organizational —Knowledge Sense changes In industry benchmarking Accomplish internal & external transformation
Dynamic Capabilities Positions Technological assets Complementary assets Financial assets
Know-How Prior commercializ
ation activities
cash position and degree of
leverage Reputational assets shape the responses of customers, suppliers, and competitors Structural degree of —hierarchy formal and informal structure _ of organizations
and their external linkages
level of vertical and - lateral integration
Institutional
Regulatory systems, intellectual property regimes, tort laws, antitrust laws, and the system of higher education and national culture due to its geographic location. Market (structure) assets
nr
position of the enterprise in its external environment1 Organizational
boundaries
locath in of a firm's boundaries or
its degree of integration
(vertical, lateral, and horizontal)
(Bowman and Ambrosini 2003) building on (Teece et al. 1997) explained that dynamic capabilities comprise four main processes: reconfiguration, leveraging, learning and creative integration.
• Reconfiguration refers to the transformation and recombination of assets and
resources.
• Leveraging involves replicating a process or system that is operating in one business
unit into another, or extending a resource by deploying it into a new domain, for instance by applying an existing brand to a new set of products.
• Learning allows tasks to be performed more effectively and efficiently as an outcome
of experimentation, reflecting on failure and success.
• Finally, creative integration relates to the ability of the firm to integrate its assets and resources, resulting in a new resource configuration.
2.6. Dynamic Capability Life Cycle CCLCl
2.7. Dynamic Capabilities Value and Cost
(Lavie 2006) and (Pablo et al. 2007) studied the cost of dynamic capabilities. They concluded that dynamic capabilities involve substantial cognitive, managerial and operational costs and that deploying dynamic capabilities requires high levels of time and energy from committed managers. As a result, the implementation of certain capability that will help the organization to achieve the favourable market position is costly and organizations can't implement all the capabilities together because of the cost factor and also because some of these capabilities may contradict with each other as well. So the selection of which capability to be implemented is a very important decision. If managers misperceive the situation of the firm, they may trigger inappropriate dynamic capabilities relative to the external environment that do not enhance or maintain performance. As a result the firm will then experience both the costs of the dynamic capabilities as well as the negative consequences of their deployment (Zahra et al. 2006).
It can be concluded at this point that this view can be linked with the "trade off" concept introduced by strategy scholars (Porter 1998). At certain point, firms will have to irreversibly trade off some of their available options and choose between them. The end results will not be known until selection is done and processed in the market. Although the information technology revolution decreased the time delays and provided more information and in return enhanced the decision making process (Sterman 2000) and firms become capable of making educated assumption yet the time delay between choices and results constrains manager's learning ability to select effectively among different available options.
2.8. Manufacturing Strategy Trade-off
and capabilities focused on flexibility are necessary for an effective business strategy based on differentiation as show in Figure 9 .
BUSINESS STRATEGY
MANUFACTURING STRATEGIC << OBJECTIVES
MANUFACTURING CAPABILITIES 1
BUSINESS
j
PERFORMANCE1
t
-0.73'
0.17 0.33
0.40 0.57'
0.26' 0.09
0.00 0.42
0.61
Cost Cost
Flexibility
0.33'
Cost
Flexibility
Financial Commercial
Differentiation
Figure 9 Alignment between manufacturing function and business strategy
(Gonzalez-Benito and Suarez-Gonzalez 2009)
Cost
Lean Quality
Delivery «peed
Competitive intensity
of industry
Dcliveiy reliability
Differentiation Agile Mix flexibility
Volume flexibility
Figure 10 Lean or Agile as strategic choices (Hallgren and Olhager 2009)
2.9. Dynamic Capabilities as a source for Strategic Aeilitv
The trade off in selection in the structural and infrastructural decisions starts from the beginning of the business cycle and evolve to expand as much as possible according to the available market space missed by competition. As the competition advances in the market, the technological complexity increases as well due to the flow of forced investments that seeks competitive advantage. So, the industry strategic portfolio, which represents the competition interaction between firms, will affect the overall market growth dynamics. And the capability of instantaneous capacity adjustment and perfect forecasting for future demands and industry capacity become the major performance variables that affect the market winner (Porter 1985). In short, it can be said that successful dynamic capabilities are those who lead to organization strategic agility.
The logic of the 'strategic agility capability' framework is that operations strategy which is a combination of structural (development of weak ties) and infra-structural (identifying new opportunities and, organizing effectively and efficiently) choices a firm makes to establish co-alignment with the market requirements results in the development of competencies that are combined to create capabilities desired by the customer. These strategies lead to the development of competencies, which in turn create the strategic agility capability. The findings can be summed in three main points:
• First, the ability for organizations to sense changes in the market place is a critical
determinant of strategic agility.
• Second, strategic agility does not have any direct impact on financial performance
except the fact that the strategically agile organizations have the capability to initiate changes to their manufacturing activities earlier than those who do not, and, thus gain first mover advantages. One can argue with this finding as the first mover advantage has a direct impact on the organization market share, market position and as a result can affect the enterprise financial performance.
• Finally, strategic agility is useful in moderate levels of environmental turbulence but
not when turbulence is low or extremely high.
As stated in the study: "on the one hand when turbulence is low, changes are minimal and thus investments in achieving strategic agility do not pay off and cause financial loss. On the other hand, when change is rapid, investments made in advance modifying operations competitive capabilities may not have the necessary time to payoff and break even thus creating financial losses". This highlights the importance of the external environment.
2.10. The Degree of Fit with External Environment
certain time. Thus the effect of dynamic capabilities on advantage and performance may be negative. This in turns gives four different outcomes that may result from the deployment of dynamic capabilities discussed as follows:
• First, organizational capability may lead to sustainable competitive advantage if the
resulting resource base is not imitated for a long time.
• Second, they may lead to temporary advantage. (Rindova and Kotha 2001) argued
that in 'hypercompetitive environments, competitive advantage is transient rather than sustainable'; competitive advantage can only be enjoyed for a short period of time. • Third, they may only give competitive parity if their effect on the resource base
simply allows the firm to operate in the industry rather than to outperform rival firms, i.e. catching up with the benchmark.
• OR Finally, the deployment of dynamic capabilities may lead to failure if the
resulting resource stock is irrelevant to the market.
Therefore, indusial enterprises will have to adapt their manufacturing capabilities to outperform the evolving industry benchmark to keep their sustainable competitive position within the current market standards. Before explaining how competition affects the product life cycle and hence the industry life cycle and therefore the customer performances, the next section will zoom on the negative side of the dynamic capability change which is known as organizational inertia.
2.11. Organization Inertia
In short, "Network growth creates interdependences, interdependences create conflicting constraints, and conflicting constraints creates slow decision making and ultimately, bureaucratic grid lock" (Beinhocker 2006). The two opposing forces at work in organizations: the informational economy of scale from node growth, and the diseconomies of scale from build-up of conflicting constraints, may explain why big is both beautiful and bad. As organization grows, their degrees of possibility increase exponentially while its degrees of freedom collapse exponentially.
Organizational Inertia
Organizational Capabilities
. Change Attempts Change
Attempts
Variation
Size-'' ^ Inertia
Routines Learning
Age Actual ~
Threshold Base Threshold
Capabilities Inertia
Performance and Change
. Change Attempts Reliability
\ ^ge Variability
Capabilities
Figure 11 Organizational inertia and performance (Larsen and Lomi 2002)
The study concluded that on the one hand, as organizations grow old and large, they accumulate competencies, resources and knowledge that can be deployed to sustain and improve their competitive advantage. On the other hand, as organizations grow old and large, they become progressively more vulnerable to processes of self-reproduction that dissipate resources and decrease their ability to respond sufficiently to the challenges of innovation and change introduced by new rivals.
2.12. Industry Life Cvcle and Customer Preferences Rate of Change
unspecialized machinery to manufacture the product. Following this stage, firms compete by different means over market share and profitability to explore the market potential and setup the industry benchmarking in the "growth stage". This stage is characterized by high growth, stable product design, and production process becomes more advanced as specialized machinery substitute labours seeking higher productivity standards. In the "mature stage" entry slows and industry shakeout occurs causing all successful, non-efficient firms to exit. As market growth slowdown, entry declines further due to higher barriers, market shares stabilize, innovations become less significant, and management, marketing, and manufacturing techniques become more developed. And finally during the last stage, firms exit if they didn't adapt with the next cycle of innovation derived by customer preferences needs that evolved to higher levels during this cycle.
Product strategies become driven by forecasting changes in technologies and market preferences to start new industry life cycle. The product creation processes became driven by marketing researchers who control the customer preferences for new products and educate them to realize its value. The economic power has been handed over by the producer to the consumer, hence enjoying 'more quality, more for the money, more choice, more service' (Hammer and Champy 1993) and becoming more powerful and have the final decision on deciding their right "market priorities" whether it is cost, flexibility, delivery or quality. As a result, on the one hand, the market development speed become directly related to the individual firm's expected return on investment, the realized strategies it achieves in product development and the risk level it takes. All of these factors suggest the need for competitive market to generate the dynamic of growth or in other words the "continuous improvement". While on the other hand, the consumer's preferences shape the final setup for the landscape. The more hyper-competitive interaction between firms, the shorter and faster industry life cycles are.
industry evolution speed. As manufacturing systems evolved through different paradigms from dedicated manufacturing all the way to changeable manufacturing, so did the capacity planning challenge in these systems. Examples of that evolution include not only considering the economy of scale but also the economy of scope in the capacity expansion/reduction decisions and reducing the reaction time to scale the capacity from years and months to weeks and even days (Deif and ElMaraghy 2009). Also the design of manufacturing systems based on competitive priorities by linking it decisions to business performance in terms of cost, quality, delivery and flexibility has been presented by (Miltenburg 2009). This evolutionary perspective explains the pressure of market competition on the technology development norms. The more competition and the more technology advancement are required.
2.13. Manufacturing Fitness and Landscape theory
The origin of the fitness landscape theory is attributed to (Wright 1932). The study proposed a metaphor in which a population of organisms would evolve by moving towards a higher fitness peak as a sign for their evolution and continuity "survival for the fittest". The fitness landscape contains ranges of mountains, local peaks and valleys. A fitness landscape with many local peaks surrounded by deep valleys is called rugged landscape as shown in Figure 12. Apart from the field of evolutionary biology, the concept of a fitness landscape was used in evolutionary optimization methods such as genetic algorithms or evolutionary strategies.
Figure 12 Rugged landscape (Wright 1932)
From a strategy context, many scholars proposed that the ultimate solution for any organization to be successful is by finding the global peak in the business landscape. As recommended and proposed from this stream of research, organizations should adapt their strategies and resources with the external environment (i.e. Landscape) and search (i.e. take adaptive walk) for the global peak of the landscape to achieve success (i.e. payoff).
and strategy by proposing a definition and model of manufacturing fitness. In accordance with fitness landscape theory, a complex systems perspective was adopted to the manufacturing firms. It was argued that manufacturing firms are a complex adaptive system and that by developing and applying fitness landscape theory it is possible to create models to better understand and visualize how to search and select various combinations of capabilities that will help organizations to reach global optima.
As shown in Figure 13, each strategy has a fitness value assigned "randomly". The strategic change the firm may have is assumed to be a process of moving from one strategy to another in search of an improved fitness (i.e. taking adaptive walk) to reach the highest manufacturing fitness value. Manufacturing strategy was analyzed and coded as a string of elements (N) where each element is a capability. For any element i, there exist a number of possible states which can be coded using integers 0,1,2, 3, etc.
CXXX) (0.35) 0100 (0.43) 0010 (0,43) 0001 (044) 1000 (0.49) 1001 (0.52) 0110 (0.63) 0101 (0.53) 0011 (0.44) 1100 (0.54) 1010 (0.57) 1101 (0.67) 1110 (0.62) 1011 (0.58) 0111 (0 53) 1111
(0.67) Cost Quality Flexibility Delivery
1111 (0.67)
Manufacturing Fitness
The total number of states for a capability is described as At. Each system (strategy) 5 is described by the chosen states SXS2 Sn And is part of an N-dimensional landscape or design space (5). The K parameter in the NK model indicates the degree of connectivity between the system elements (capabilities). It suggests that the presence of one capability may have an influence on one or more of the other capabilities in a firms' manufacturing strategy. Similar to Kauffman's model, the fitness function / (x), is the average of the fitness contributions, fa (x) from each element i, and is written as:
f ( x ) = (2.1)
(McCarthy 2004) concluded that by understanding the topology of a fitness landscape the manufacturing firms will know its current position on the landscape (Strategic analysis), decide where it should be (Strategic choice) and how they will get there (Implementation). Also it was claimed that the organization will take adaptive walk to move from strategy (A) to strategy (B) as shown in Figure 14. The route from (A) to (B) may be accompanied by a reduction in firm performance. The bad performance was related to the learning curve challenge and organizational disruption that normally associated with any change. This view aligned with porter's five competitive forces model (Porter 1985).
the firm achieves through resource accumulation causes performance difference among rivals if it matched the market variables at any point of time.
Figure 14 A route or adaptive walk from point A to B (McCarthy 2004)
So it can be said that, in the continuous competition for wealth creation and market share (objective functions for the organizational system, subsystems and driver for the firm's strategic behaviour), all firms will compete to develop sustainable competitive advantages to occupy the favourable market positions (Porter 1985) by creating valuable, rare, imperfectly imitable, and non substitutable resources idiosyncratic to the firm (Barney 1991) that cope with the external environment at any point of time (Teece et al. 1997) and create value with reference to competitors performance. This conclusion draws the theoretical foundation for this research.
Strategy B
Strategy A