University of Windsor University of Windsor
Scholarship at UWindsor
Scholarship at UWindsor
Electronic Theses and Dissertations Theses, Dissertations, and Major Papers
2018
An Exploration of Drivers of Behavioural and Morphological
An Exploration of Drivers of Behavioural and Morphological
Laterality and Expensive Tissues in Chinook Salmon
Laterality and Expensive Tissues in Chinook Salmon
(Oncorhynchus tshawytscha)
(Oncorhynchus tshawytscha)
Mallory L. Wiper
University of Windsor
Follow this and additional works at: https://scholar.uwindsor.ca/etd
Recommended Citation Recommended Citation
Wiper, Mallory L., "An Exploration of Drivers of Behavioural and Morphological Laterality and Expensive Tissues in Chinook Salmon (Oncorhynchus tshawytscha)" (2018). Electronic Theses and Dissertations. 7407.
https://scholar.uwindsor.ca/etd/7407
This online database contains the full-text of PhD dissertations and Masters’ theses of University of Windsor students from 1954 forward. These documents are made available for personal study and research purposes only, in accordance with the Canadian Copyright Act and the Creative Commons license—CC BY-NC-ND (Attribution, Non-Commercial, No Derivative Works). Under this license, works must always be attributed to the copyright holder (original author), cannot be used for any commercial purposes, and may not be altered. Any other use would require the permission of the copyright holder. Students may inquire about withdrawing their dissertation and/or thesis from this database. For additional inquiries, please contact the repository administrator via email
AN EXPLORATION OF DRIVERS OF BEHAVIOURAL AND MORPHOLOGICAL LATERALITY AND EXPENSIVE TISSUES IN CHINOOK SALMON
(ONCORHYNCHUS TSHAWYTSCHA)
by Mallory L. Wiper
A Dissertation
Submitted to the Faculty of Graduate Studies through the
Department of Biological Sciences in Partial Fulfillment of the Requirements for
the Degree of Doctor of Philosophy at the University of Windsor
Windsor, Ontario, Canada
2018
AN EXPLORATION OF DRIVERS OF BEHAVIOURAL AND MORPHOLOGICAL LATERALITY AND EXPENSIVE TISSUES IN CHINOOK SALMON
(ONCORHYNCHUS TSHAWYTSCHA)
By
Mallory L. Wiper
APPROVED BY:
__________________________________________________ G. Nevitt, External Examiner
University of California, Davis
__________________________________________________ D. Heath
Great Lakes Institute for Environmental Research
__________________________________________________ C. Semeniuk
Department of Biological Sciences
__________________________________________________ B. Zielinski
Department of Biological Sciences
__________________________________________________ D. Higgs, Advisor
Department of Biological Sciences
iii
DECLARATION OF CO-AUTHORSHIP / PREVIOUS PUBLICATION
I. Co-Authorship
I hereby declare that this dissertation incorporates material thatis the result of joint
research, as follows:
Outside of the introductory and conclusions chapters, this dissertation incorporates
the result of several joint research collaborations. Chapter 2 of the dissertation was
co-authored with Dr. Sarah Lehnert, and Dr. Daniel Heath; all work was carried out under
the supervision of Dr. Dennis Higgs. The primary contributions, data analysis,
interpretation, and writing were performed by the author. The main contribution of Dr.
Sarah Lehnert was through genetic analyses to obtain heterozygosity estimates for groups
of fish, as well as providing helpful feedback on drafts of the manuscript. Dr. Daniel
Heath also provided feedback on early versions of the second data chapter prior to
submission for publication. Chapter 3 was designed, analyzed and written by the author
under the supervision of and in collaboration with Dr. Dennis Higgs. Chapter 4 was a
collaboration between the author, Ms. Shawna L. Semple and Dr. Dennis Higgs. All
collaborators worked on processing of the fish used for analysis in this chapter. Ms.
Semple’s primary contribution was through running genetic analyses on fin clips to
determine heterozygosity estimates for each fish population. Analysis and interpretation
of data on laterality and expensive tissue output, as well as writing of the manuscript were
done by the author. Finally, chapter 5 was a joint collaboration of Ms. Jessica Mayrand,
Dr. Christina Semeniuk, and Dr. Dennis Higgs. Ms. Mayrand and Dr. Semeniuk provided
some of the fish from the 2014 and all fish from the 2015 year, including on site
iv
dissections and weighing. All writing, analysis and interpretation of results were carried
out by the author.
I am aware of the University of Windsor Senate Policy on Authorship and I certify
that I have properly acknowledged the contribution of other researchers to my
dissertation, and have obtained written permission from each of the co-author(s) to
include the above material(s) in my dissertation.
I certify that, with the above qualification, this dissertation, and the research to
which it refers, is the product of my own work.
II.
Previous Publication
This dissertation includes two original papers that have been previously
published/submitted for publication in peer reviewed journals, as follows:
Dissertation Chapter
Publication title/full citation Publication status*
Chapter 1 Wiper, M. (2017). Evolutionary and mechanistic drivers of laterality: A review and new synthesis. Laterality, 22 (6), 740-770. doi: 10.1080/1357650X.2017.1291658
Published
Chapter 2 Neutral genetic variation in adult Chinook salmon (Oncorhynchus tshawytscha) effects brain-to-body trade-off and brain laterality. Royal Society Open Science, 4 (12), 170989.
Published
I certify that I have obtained written permission from the copyright owner(s) to
include the above published material(s) in my dissertation. I certify that the above
material describes work completed during my registration as a graduate student at the
v
III.
General
I declare that, to the best of my knowledge, my dissertation does not infringe upon
anyone’s copyright nor violate any proprietary rights and that any ideas, techniques,
quotations, or any other material from the work of other people included in my
dissertation, published or otherwise, are fully acknowledged in accordance with the
standard referencing practices. Furthermore, to the extent that I have included
copyrighted material that surpasses the bounds of fair dealing within the meaning of the
Canada Copyright Act, I certify that I have obtained a written permission from the
copyright owner(s) to include such material(s) in my dissertation.
I declare that this is a true copy of my dissertation, including any final revisions,
as approved by my dissertation committee and the Graduate Studies office, and that this
dissertation has not been submitted for a higher degree to any other University or
vi
ABSTRACT
Specific hypotheses have been put forth to help explain and guide further studies
of patterns of brain or body growth, as well as lateralized outcomes in fishes. In terms of
laterality, what I refer to as the genetic variation and laterality hypothesis has been
proposed, stating that there is an inverse relationship between the genetic variation of an
organism and measured laterality. The expensive tissue hypothesis, on the other hand, has
been proposed as an explanation of differences in brain size, stating that for increased
brain growth there must be a compensatory trade-off with other ‘expensive’ tissues. In the
present dissertation I have used a salmonid species, Chinook salmon (Oncorhynchus
tshawytscha), to explore both the differential investment into brain and body growth, and
drivers behind morphological and behavioural laterality. In the first data chapter, as an
examination of the genetic variation and laterality hypothesis, I investigate how four
different ‘inbreeding levels’ affect morphological laterality of the hemispheres of two
main brain regions, the optic tectum and cerebellum. As well, I examine how fish in the
‘inbreeding levels’ differ on a brain-to-body ratio measure as a test of how genetic
background might affect expensive tissue investment. In the second data chapter, I use
juvenile salmon of six different genetic backgrounds, three domestic and three outcrosses,
as well as a manipulation of flow direction (clockwise or counter-clockwise) in the
rearing barrels of the fish, to investigate the genetic background, environmental, and
gene-by-environment (GxE) interaction effects on both behavioural (C-start; mirror
inspection) and morphological (brain; whole eye) laterality. The third chapter examines
the effect of population differentiation of seven Chinook populations on morphological
vii
In this chapter I also looked at the differences between populations on the expensive
tissue trade-offs of the brain and the body, the brain and the gut and the gut and the body.
Finally, in the fourth data chapter I examine the brain-to-body trade-off on six
populations of Chinook salmon over three years: 2014, 2015 and 2016. As a whole, the
laterality results demonstrate that there is some genetic effect on morphological laterality
of the brain hemispheres, but not following the pattern suggested by the genetic variation
and laterality hypothesis. From behavioural examinations I note that the manipulation of
flow direction and the GxE interaction show the most significant effects on laterality.
Results of expensive tissue trade-offs show that there is differential investment into the
brain versus the body in Chinook salmon, and this investment also shows differences
between populations examined, indicating that there are drivers to expensive tissue
trade-offs which require more exploration. Investigating these areas may hold important
information for aquaculture facilities, especially with regards to differential tissue
investment, where often times a larger body is the end goal. However, investment into the
brain may be a reflection of cognitive ability which would be of greater importance for
those hatcheries rearing fish for conservation purposes: higher cognitive ability may very
likely equate to higher overall survival. In regard to lateralization, the further exploration
of laterality, both morphological and behavioural, can help us to better understand how
and why laterality developed, its advantages, and how, and perhaps why, it has been
viii
DEDICATION
Dedicated to my mom.
ix
ACKNOWLEDGEMENTS
First and foremost I owe a BIG thank you to my advisor, Dr. Dennis Higgs.
Dennis, you were the best advisor I could have asked for! You helped me to believe in my
own knowledge and to be more comfortable with not always knowing the answer. The
support and guidance that you gave was truly unique, but I wouldn’t have it any other
way. I appreciate you trying to teach me to “go with the flow” and learn more about
“teachable moments”, but some lessons just don’t stick. Most of all, though, I appreciate
you being willing to take a chance on someone you didn’t know who wanted to work on a
topic you weren’t familiar with. You provided me an opportunity for which I am forever
grateful.
A huge thanks also goes to the members of the Higgs lab: Dr. Kirsten Poling, Ms.
Megan Mickle, Ms. Melissa Macksoud, and Mr. Christian Ieraci. First, Kirsten, thank you
for understanding many of my particular neuroses! I’ve appreciated your advice and
friendship, and will always be concerned that one day you will drop one of your thousand
coffee cups you carry with you. Megan, we’ve known each other for quite a while during
our respective time in the Higgs lab and I’m so happy we’ve been able to grow together
as science-y friends! You’ve always been a wonderful sounding board to bounce ideas off
of and you were always, always willing to help, no matter what, if I needed it. You are
one of the most supportive and encouraging friends I’ve ever had the pleasure to meet and
have in my life. You are a force to be reckoned with and I hope the world is ready for
you! Melissa, you and I have a lot in common with respect to our introverted personalities
and it’s been wonderful to have someone who just “gets” the introverted thing. You, too,
x
know you over the past couple of years. You are so clever and capable that there’s no
doubt in my mind that you will end up exactly where you want to be. There’s a fire inside
of you that is waiting to burst; don’t be afraid to let it shine bright! Finally, Christian. You
have been integral to much of the research in this dissertation. As an undergrad you spent
time analyzing videos and measuring brains for which I am eternally grateful; without
your help as one of my volunteers I never would have completed any of this. Now, as a
grad student, I’ve been able to get to know you more and it’s been fun! You’re
lighthearted and don’t take yourself too seriously, and those are such wonderful qualities
to have. You’re a talented, intelligent guy and I know that you will be successful in
whatever you do! To all four of you, I feel honoured that I’ve been able to count you as
colleagues during my academic career. It wouldn’t have been the same without you!
Thanks also goes out to all of the volunteers I’ve had over the years that have
helped me in some way with brain measuring or video analysis: Jessica Garabon, Nina
Milidrag, Natalie Kindiak, Lisa Truong, Jessica Montaleone, Allana Belsito, Angela
Teoderescu, Daniel Dubovan and Vivian Vegh. Without these people this project never
would have come together.
To my committee members, Dr. Barbara Zielinski, Dr. Christina Semeniuk, and
Dr. Daniel Heath, I owe gratitude for your insightful comments, suggestions and guidance
throughout my academic career. You have been very important to bringing this
dissertation together and getting it to its final point. In addition, I’d like to extend a huge
thank you to my external examiner, Dr. Gabrielle Nevitt, for being a part of the defence
committee and being so supportive and just a wonderful person in general. Thank you!
As always, I extend my thanks to the people who run the Biology Building. To the
xi
of you have been so kind and helpful whenever I’ve been in need of an answer. Thank
you for keeping things running smoothly! To the Stockroom staff, especially Ingrid
Churchill and Rodica Leu, thank you for helping me any time I needed it, advising me on
protocols, and helping me get any items I needed, especially when they were for my
salmon brains! To Bob Hodge, let’s be real: you keep this building afloat. Without you,
Bob, this building would 110% fall apart. And also, thanks for bringing the mint Girl
Guide cookies! Finally, to the custodial staff, Jane and Dan: Thank you for keeping the
building clean for everyone who comes through every day. Your efforts are really
appreciated!
Now to those who have been with me the longest, my family. Thank you, thank
you, thank you for always being supportive of my academic path. You may not have
always been totally clear on what I was studying or why it was important but you’ve all
been so supportive and made me feel like I was in the right place, and I’ve really, truly
appreciated that!
My final and biggest thanks goes to my husband, Frazier Fathers. I feel like
“thank you” isn’t quite enough to say for all that you’ve done for me. You’ve supported
me from the start and believed I was capable of anything—even when I didn’t believe in
myself. You’ve helped me to become the woman I am today. You’ve made me stronger,
happier, and a better person than I ever thought I could be. You’ve made a world of
difference to me and I feel so privileged and grateful to have you by my side. Thank you
xii
TABLE OF CONTENTS
DECLARATION OF CO-AUTHORSHIP / PREVIOUS PUBLICATION…………...…iii
ABSTRACT………....vi
DEDICATION………..viii
ACKNOWLEDGEMENTS………ix
LIST OF TABLES……….xv
LIST OF FIGURES………...xvi
CHAPTER 1: EVOLUTIONARY AND MECHANISTIC DRIVERS OF LATERALITY: A REVIEW AND NEW SYNTHESIS Laterality as a field of study……….1
Laterality defined and measured………..1
Laterality in history………..7
Asymmetrical neural structures in non-human animals………...7
Lateralized behaviour in non-human animals………14
Laterality and evolution……….16
Hemispheric specialization………16
Costs and benefits of laterality………..18
Laterality and population ecology……….19
Mechanistic drivers or laterality………..…...21
Genetic mechanisms…...21
Parental effects…...23
The effects of rearing environment…...24
Species differences…...26
Within species differences………..26
Individual vs. population differences…...27
Future directions…...29
Phylogenetic approach…...29
Genetics and heritability…...30
Staying the course and beyond…...31
Conclusions………...33
References……….36
CHAPTER 2: NEUTRAL GENETIC VARIATION IN ADULT CHINOOK SALMON (ONCORHYNCHUS TSHAWYTSCHA) AFFECTS A BRAIN-TO-BODY TRADE-OFF AND BRAIN LATERALITY Introduction………49
Methods……….……….52
Study species………..52
xiii
Genetic analyses of heterozygosity………55
Statistical analyses……….57
Somatic and brain measure………..…….57
Heterozygosity…..………..………..…….60 Results………...……….60 Heterozygosity estimates………...60 Somatic trade-offs……….……….62 Laterality measures………62 Discussion………..65 Somatic trade-offs………..65
Genetic effects on laterality………66
Conclusion………..68
References………..70
CHAPTER 3: GENETIC, ENVIRONMENTAL AND INTERACTION EFFECTS ON BEHAVIOURAL AND MORPHOLOGICAL LATERALITY IN JUVENILE CHINOOK SALMON (ONCORHYNCHUS TSHAWYTSCHA) Introduction………...……….76 Methods………..79 Subjects………..79 Housing………..80 Behaviour trials……….……….81 C-start behaviour………81 Inspection behaviour………..83 Morphology………85 Statistical analysis……….87
Tests for normality……….………...87
Behaviour………...88
C-start……….88
Inspection behaviour………..88
Morphological analysis..………89
Behaviour and morphology correlations………89
Results………90
Behaviour………...90
C-start (Startle behaviour)….……….90
Inspection behaviour………..90
Brain and whole eye morphology, and behaviour and morphology correlation……….…..97
Discussion………..…..104
Effect of flow………106
Effect of genetic cross……….………..108
Gene-by-environment interaction……….……….112
xiv
Conclusions………..114
References………116
CHAPTER 4: AN INVESTIGATION OF THE EFFECTS OF POPULATION DIFFERENTIATION ON EXPENSIVE TISSUE TRADE-OFFS AND BRAIN LATERALITY Introduction………...………...124
Methods………127
Subjects………127
Genetic analyses………...128
Tissue processing and measurement………129
Statistical analysis………...131
Heterozygosity……….131
Measure of morphology………...133
Results………..134
Heterozygosity………..134
Absolute measures and energy trade-offs……...……….135
Brain lateralization………..135 Discussion………138 Somatic trade-offs……..………..138 Laterality………..141 Conclusions………..…142 References………145
CHAPTER 5: MIND OVER MATTER: DIFFERENTIAL INVESTMENT INTO BRAIN VS. BODY GROWTH IN CHINOOK SALMON (ONCORHYNCHUS TSHAWYTSCHA) ACROSS LIFE STAGES Introduction………..152 Methods………154 Subjects………154 Somatic measurements……….155 Statistical analyses…….………...156 Results………..157 Discussion………165 References………170
CHAPTER 6: CONCLUSIONS AND FUTURE WORK The importance of expensive tissue trade-offs and laterality in current research………....177
Bringing it all together…...………..181
References………183
xv
LIST OF TABLES
Table 1.1: Examples of lateralized morphology and behaviour in major classes of
vertebrates………...7
Table 2.1: Heterozygosity for six groups of captive Chinook salmon…….…….………55
Table 2.2: Mean, standard error and confidence intervals for the effect of inbreeding level on four measures of morphology………61
Table 3.1: Mean, standard error and confidence intervals for the interaction effect of flow-by-cross on C-start escapes……….….90
Table 3.2: Mean, standard error and confidence intervals for the interaction effect of flow-by-cross on the laterality index..………..93
Table 3.3: Mean, standard error and confidence intervals for the effect of cross on the absolute index………...95
Table 3.4: Mean, standard error and confidence intervals for the interaction effect of flow-by-cross on the absolute index………...97
Table 3.5: Mean, standard error and confidence intervals for the effect of cross on
morphology...99
Table 4.1: Heterozygosity for seven groups of Chinook salmon………126
Table 5.1: Mean, standard error and confidence intervals for the effect of year on brain mass, body mass and the brain-to-body ratio………152
xvi
LIST OF FIGURES
Figure 1.1: Graphical representation of three types of population level asymmetry……..3
Figure 2.1: Salmonid brain regions of interest……….….53
Figure 2.2: Mean brain-to-body ratio values across inbreeding levels……….58
Figure 2.3: Laterality index (LI) of the cerebellum………..60
Figure 3.1: Schematic of the ball drop mechanism used during the C-start trials………79
Figure 3.2: Fish body positions used for eye use during mirror inspection………..81
Figure 3.3: Four major brain regions of the juvenile Chinook salmon brain…………....83
Figure 3.4: The effect of flow direction on rightward escapes..……….……..87
Figure 3.5: Gene-by-environment interaction effect on absolute index of C-starts……..89
Figure 3.6: The effect of flow direction on right eye use during mirror inspection……..91
Figure 3.7: Gene-by-environment interaction effect on laterality index of eye use…….92
Figure 3.8: The effect of flow direction on the absolute index of eye use………....94
Figure 3.9: Gene-by-environment interaction on the absolute index of eye use………...96
Figure 3.10: Significant effects of cross on brain and whole eye laterality………100
Figure 3.11: Correlation of optic tectum and contralateral eye size………...102
Figure 4.1: Major brain regions of theChinook salmon brain………124
Figure 4.2: Mean brain-to-body mass ratio between crosses………..130
Figure 4.3: Mean gut-to-body mass ratio between crosses………..…………...131
Figure 5.1: Mean absolute body and brain masses………..151
Figure 5.2: Mean brain-to-body ratio between three years of 2014, 2015 and 2016…..153
Figure 5.3: Mean absolute body and brain masses between crosses within 2014……..155
1
CHAPTER 1: EVOLUTIONARY AND MECHANISTIC DRIVERS OF LATERALITY: A REVIEW AND NEW SYNTHESIS
Laterality as a field of study
Laterality as a field of study has advanced greatly since its broadening into
non-human organisms, with several reviews laying out the progress of this field and how it has
evolved. Bisazza et al. (1998) and Vallortigara and Rogers (2005) have done an excellent
service outlining the now well-accepted origins of cerebral asymmetry and addressed, in
detail, the rise of individual and population level laterality as well as the connection
between the two. A missing feature of these reviews, though, is a detailed explanation of
the formulas used to calculate measures of laterality and the mechanistic and evolutionary
drivers behind laterality. In the current review I endeavour to address these missing pieces
in an effort to synthesize what we know about mechanisms and to call for a
standardization of laterality calculations. We must continue to study behavioural laterality
but begin to incorporate further questions and research that help determine what genetic,
environmental, and gene-by-environment interaction effects there may be on the
development and maintenance of laterality to help us better understand this biological
characteristic that has been widely found among vertebrate species.
Laterality defined and measured
The argument for lateralized differences of brain hemispheres was historically
held as applicable only to humans, beginning largely with the landmark discovery of
Broca’s area in 1861 (Keller et al., 2009; Rogers et al., 2013). This uncovering of what
was deemed the speech and language control centre in the left hemisphere of the brain,
2
some to hold to the belief of functional and structural “human only” hemisphere
differences (MacNeilage et al., 2009). Evidence from Finch’s (1941) work with
chimpanzees, however, began to move the idea of functional laterality beyond the
confines of the human brain, and from that time forward, confirmation of laterality in
nonhuman species continued. Evidence was put forth that hemispheric specialization of
vocal control existed in canaries (Serinus canarius; Nottebohm, 1977) that lateralization
of function for visually guided behaviours was present in domestic chickens (Gallus
gallus domesticus; Rogers & Anson, 1979); that differential hemispheric control of
behaviour in rats was evident (Denenberg, 1981); and that asymmetry of hand use could
be identified in non-human primates (MacNeilage et al., 1987).
Asymmetrical differences in morphological characteristics have been identified in
a variety of features (Sheridan & Pomiankowski, 1997; Bryden & Heath, 2000;
Gutiérrez-Ibáñez et al., 2011; Takeuchi & Hori, 2013) and fall into one of three categories
of asymmetry: fluctuating asymmetry, antisymmetry or directional asymmetry.
Fluctuating asymmetry, a maladaptive form of asymmetry, has been defined as the
“inability [of an organism] to undergo identical development of a bilateral trait on both
sides of the body” (Swaddle et al., 1994), and is assessed based on measurements of both
halves of the trait. The suggestion with fluctuating asymmetry is that there has been
random deviation from identical bilateral symmetry since the expected developmental
path of perfect symmetry has been perturbed (van Valen, 1962; Møller & Swaddle, 1997).
Antisymmetry is a form of physical development of an organism wherein asymmetry is
the norm, but whether the larger character is on the right or left side varies and can
happen with equal frequency (Leary & Allendorf, 1989; Møller & Swaddle, 1997; Van
3
Figure 1.1: Graphical depictions of the three types of asymmetry at the
population level. (A) indicates
Fluctuating Asymmetry, where there is an equal number of individuals who are left or right biased, resulting in a normal distribution, centered around perfect symmetry of development. (B)
shows the pattern of asymmetry in those populations where
Antisymmetry is present. Here a population will have a bimodal distribution, having many individuals with a left bias, many with a right bias, and very few exhibiting perfect
symmetry of development. Generally, perfect symmetry in populations where asymmetrical development is the norm would be detrimental. Finally, (C)
represents Directional Asymmetry of a population wherein measurement of a characteristic is skewed to one side of perfect symmetrical development. Here, the majority of members within a population will show the same
asymmetrical growth of a feature or behavioural side preference.
A
B
4
signalling claw but whether it is the left or the right claw is variable (Pratt & McLain,
2002). Finally, directional asymmetries occur when greater than 50% of a population
exhibit an asymmetry where one half of a bilateral trait has a larger measured value,
indicating increased growth on that side (van Valen, 1962; Leary & Allendorf, 1989;
Møller & Swaddle, 1997). The term directional asymmetry largely applies to the typically
skewed asymmetry of physical characteristics, the norm for the developmental trajectory
(Leary & Allendorf, 1989), wherein one half of a bilateral characteristic always
(predictably) shows greater overall development (Van Valen, 1962). Little work,
however, continues to investigate the physical directional asymmetries of organisms and
instead focuses on ‘laterality’, or ‘lateralization’; it is this type of asymmetry upon which
I will focus in the present review. In more recent research, laterality has become
synonymous with measures of cognitive and behavioural asymmetries and seems to be
extending to neuroanatomical asymmetries as well. Laterality then is best understood as
the phenomenon of differential structural specializations or differential processing of
specific stimuli in the left and right hemispheres of the brain (Frasnelli et al., 2012;
Rogers et al., 2013; Dadda et al., 2015). This differential processing has been argued to be
displayed through specific behavioural inclinations, wherein there is a preferential use of
one half of a bilateral characteristic (e.g. Facchin et al., 1999; Braccini & Caine, 2009) or
movement in a preferred direction (e.g. Bisazza et al., 2000a; Dadda et al., 2010). Overall,
laterality can be suggested to provide a relative advantage, or benefit, to those organisms
that express this characteristic.
No matter the cognitive, behavioural or neuroanatomical asymmetry under
investigation there are specific formulae used to evaluate laterality but there is as yet little
5
the measure of the left side or preference, and ‘R’ is the value for the right. The first
formula, the ‘laterality index’ (LI), is most commonly calculated as LI = [(L-R) / (L+R)],
where positive values indicate a leftward preference and negative values indicate a
rightward preference (Alonso et al., 1997; Shoblock et al., 2013; Broder & Angeloni,
2014). This formulation of the laterality index, which can be multiplied by 100 to aid in
interpretation, generally ranges from -1 (or -100) to +1 (or +100) and is the strongest
indicator of the direction of asymmetry (Batt et al., 2007; Barnard et al., 2016). The
second laterality index equation commonly used focuses on one side or directional
preference: LI = [( R / L + R) x 100] (e.g. Sovrano & Andrew, 2006; Reddon et al., 2009;
Hopkins et al., 2016). When this formula is utilized, a cut-off value of 50% is used to
determine left or right dominance. Generally, values above 50% will indicate a rightward
preference—the greater the number is away from 50, the stronger the preference—and
any value below 50% indicates a leftward preference (Sovrano, 2004; Sovrano &
Andrew, 2006). The third commonly used measure of lateralization is absolute laterality
(ALI). This index is used to gauge the strength of laterality irrespective of direction and is
often used to assess individual asymmetry (Brown et al., 2007; Barnard et al., 2016). The
common way of calculating absolute laterality is by taking the absolute, or unsigned,
value of the laterality index: | LI |. In cases where the formula LI = ( R / L + R) has been
used, the calculation of absolute laterality is: ALI = | LI – 0.5 | (Dadda & Bisazza, 2012;
Bibost et al., 2013). Since this laterality index is centred around 50%, the value of 50%
(or 0.5 if the LI equation was not multiplied by 100) must be subtracted to establish
deviation from random (C. Brown, personal communication, July 6, 2016). Values of 0
would denote individuals who are ambidextrous or show no directional preference, and a
6
2011b). Of the three formulae, the absolute laterality index has previously been argued to
be the “more functionally important dimension” (Gutiérrez-Ibáñezet al., 2011 and
references therein) to measure asymmetry of an organism since the laterality index alone
may lead to a loss of overall information on individual variation in laterality (Brown et
al., 2007; Reddon & Hurd, 2008; Reddon et al., 2009). In general, many studies have
shown a preference for the proportional measure of laterality as opposed to the absolute
(e.g. Cantalupo et al., 1995; De Santi et al., 2001; Sovrano, 2004), yet using both
measures provides more information on the measured laterality of an organism.
Both invertebrate and vertebrate species have been assessed for the presence of
laterality, and while the majority of studies have been carried out in vertebrate species,
strong evidence does exist for asymmetry in invertebrates (see Frasnelli et al., 2012 for
review). For example, giant water bugs (Belostoma flumineum) have shown a significant
left-turn bias when tested in a T-maze (Kight et al., 2008) and honeybees (Apis mellifera)
have been found to show a lateral shift between right and left antenna use when tested for
short and long-term olfactory memory recall (Rogers & Vallortigara, 2008). Cuttlefish
(Sepia lycidas) exhibit morphological asymmetry of the curvature of their cuttlebone, and
behavioural asymmetry of prey capture is related to this curvature (i.e. right curvature,
leftward turn) (Lucky et al., 2012).
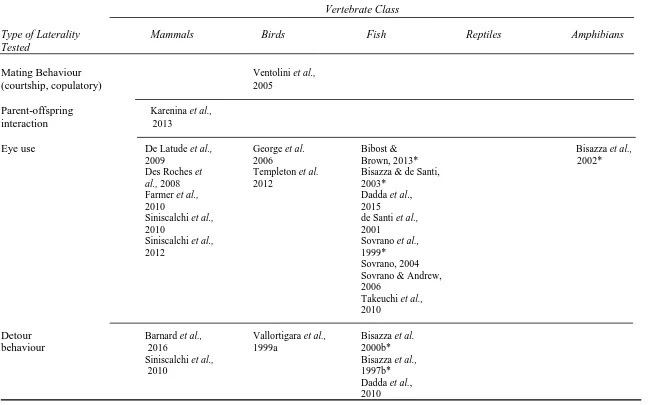
Among vertebrate species, all major classes have been investigated for lateralized
tendencies or preferences, with at least one representative study of lateralization from
each class (Table 1). For instance, mammals have been widely studied for lateralized
preference or control of a wide-range of behaviours, including, for example, the preferred
side on which an orca (Orcinus orca) calf stays next to its mother (Karenina et al., 2013);
7
2008); lateralized eye use in feral horses (Austin & Rogers, 2012); and hand use
preference in pig-tailed macaques (Macaca nemestrina) (Regaiolli et al., 2016). Both
bony and cartilaginous fishes have been investigated for lateralized eye use preferences
(e.g. Sovrano, 2004), and for asymmetry of escape or turning behaviour (e.g. Green &
Jutfelt, 2014). Eye use preference, “footedness”, and task ability or efficiency related to
level of lateralization has been investigated in bird species, including domestic chickens
(Rogers et al., 2004), parrots (Brown & Magat, 2011a) and Gouldian finches (Erythrura
gouldiae; Templeton et al., 2012). Amphibians and reptiles have been studied less often,
but there is evidence for lateralization of escape or attack direction (e.g. toads, Bufo spp.:
Vallortigara et al., 1998; Lippolis et al., 2002) and eye use (wall lizards, Podarcis
muralis, Bonati et al., 2013; tree lizards, Urosaurus ornatus, Hews & Worthington,
2002). Since much support exists in the literature for the presence of lateralization in all
classes of vertebrate species the remainder of this review will focus on non-human
vertebrate organisms.
Laterality in history
Asymmetrical neural structures in non-human animals
One of the earliest studies to focus on bilateral neuroanatomy investigated the size
difference between the Mauthner cell neurons, which control a fish’s quick escape
(C-start) response (Fetcho, 1992; Vallortigara & Bisazza, 2002), in a small sample of
goldfish (n = 3; Moulton & Barron, 1967) finding that the left Mauthner cell was three
times the size of that of the right (Moulton & Barron, 1967). The avian visual system also
shows clear asymmetry of neural structures. Injection of a retrograde tracer into the left or
8
evidence for the development of lateralization of the visual pathways, and also
demonstrated that lateralization is dependent upon asymmetrical light stimulation
pre-hatch (Rogers & Sink, 1988). Tracer studies in pigeons also show clear contralateral
projections of neurons from the right tectum to the left tectorotundus that are twice as
numerous as the reverse projection (Güntürkün et al.,1998). Additionally, the
development of the visual system of the pigeon, an altricial species, is much slower than
that of the chick, which is precocial, yet lateralization in both species is affected by
asymmetrical light stimulation during incubation (Güntürkün, 2002). Morphological
brain asymmetries in non-human primates, too, have been examined: magnetic resonance
images (MRI) from chimpanzees (Pan troglodytes), bonobos (Pan paniscus), and gorillas
(Gorilla gorilla) show that Broadman’s area 44, part of Broca’s area in the human brain,
has similar left hemisphere asymmetries to those found in the brains of humans
(Cantalupo & Hopkins, 2001). The habenular nuclei, a highly conserved pair of bilateral
neural structures within the limbic system (Bianco & Wilson, 2009; Reddon et al., 2009),
have often been compared for asymmetries, especially in fish, reptiles, and amphibians
(see Concha & Wilson, 2001 for review). Across these taxa there is differential size
between the habenular nuclei (e.g. Rana esculenta, Kemali et al., 1990; Petromyzon
marinus, Vallortigara & Bisazza, 2002; Amatitlania nigrofasciata, Gutiérrez-Ibáñez et al.,
2011), and in at least one species (pearl cichlids, Geophagus brasiliensis) the asymmetry
is dependent on body size – with the direction of asymmetry changing as the fish grow
(Reddon et al., 2009). With studies focusing on bilateral neural structures in vertebrates
that inhabit both land and water, it is clear that there is a slowly growing interest in the
idea that physical differences between bilateral neural features, not just asymmetrical
9
Table 1.1
Examples of lateralized morphology and behaviour, as well as mechanistic drivers of laterality, in major classes of vertebrates. This table is not meant as an exhaustive collection of all studies conducted to date on vertebrate organisms but rather as a sample summary demonstrating evidence for laterality found in each vertebrate class, and that laterality is evolutionarily conserved in many cases (e.g. handedness in amphibians and mammals). The table also indicates areas for future research.
Vertebrate Class
Type of Laterality Mammals Birds Fish Reptiles Amphibians
Tested
Appendage use Batt et al., Brown & Magat, Bisazza et al.,
(hand, paw, 2007 2011a* 1996
foot, tail) Braccini & Caine, 2009
Finch, 1941 Forrester et al., 2011
Hopkins & Bennet, 1994
Lilak & Phillips, 2008
Llorente et al., 2011
McGrew & Marchant, 1999
Peters & Rogers, 2008 Quaranta et al., 2007 Regaiolli et al., 2016
10 Table 1 (continued).
Vertebrate Class
Type of Laterality Mammals Birds Fish Reptiles Amphibians Tested
Escape behaviour, Lippolis et al., Beauchamp, Bisazza et al., Bonati et al., Dill, 1977
predator detection, 2005 2013 1997a 2013 Lippolis et
inspection, avoidance Koboroff et al. Cantalupo et al., 2002*
2008 al., 1995
De Santi et al., 2001
Facchin et al., 1999
Prey or food Milliken et al., Brown & Magat, Takeuchi & Vallortigara et
Detection, inspection, 1991 2011a* Hori, 2008 al., 1998*
Handling, avoidance Güntürkün et al.,
2000
Magat & Brown, 2009*
Ventolini et al., 2005
Agonistic behaviour Bisazza & de Deckel, 1995 Vallortigara et Santi, 2003 Hews & al., 1998*
11 Table 1 (continued).
Vertebrate Class
Type of Laterality Mammals Birds Fish Reptiles Amphibians Tested
Mating Behaviour Ventolini et al.,
(courtship, copulatory) 2005
Parent-offspring Karenina et al.,
interaction 2013
Eye use De Latude et al., George et al. Bibost & Bisazza et al.,
2009 2006 Brown, 2013* 2002*
Des Roches et Templeton et al. Bisazza & de Santi,
al., 2008 2012 2003*
Farmer et al., Dadda et al.,
2010 2015
Siniscalchi et al., de Santi et al.,
2010 2001
Siniscalchi et al., Sovrano et al.,
2012 1999*
Sovrano, 2004 Sovrano & Andrew, 2006
Takeuchi et al., 2010
Detour Barnard et al., Vallortigara et al., Bisazza et al.
behaviour 2016 1999a 2000b*
Siniscalchi et al., Bisazza et al.,
2010 1997b*
12 Table 1 (continued).
Vertebrate Class
Type of Laterality Mammals Birds Fish Reptiles Amphibians Tested
Morphological Cantalupo & Moulton & Barron, Kemali et al.,
differences of Hopkins, 2001* 1967 1990
neuroanatomy Reddon et al.,
(no behaviour) 2009
Mechanistic Denenberg et al., Brown & Magat, Ariyomo & Watt, Bauer, 1993
drivers to 1978 2011b* 2013
behavioural Garbanti et al., Deng & Rogers, Bibost et al.,
laterality 1983 1997 2013
Hook & Rogers, Nottebohm & Bisazza & Dadda,
2000 Nottebohm, 2016
Hopkins, et al., 1976* Bisazza et al.,
1994 Rogers, 1990 2000a
Bisazza et al., 2007
Broder & Angeloni, 2014
Brown et al., 2007 Clotfelter & Kuperberg, 2007* Dadda & Bisazza, 2012
Domenici et al., 2012
Gutiérrez-Ibáñez et al., 2011
13 Table 1 (continued).
Vertebrate Class
Type of Laterality Mammals Birds Fish Reptiles Amphibians Tested
Mehcanistic Reddon & Hurd, 2009
drivers to Roche et al., 2013
behavioural Sovrano et al., 2016
laterality Takeuchi & Hori, 2008
Takeuchi & Hori, 2013
14
the literature thus far has left a gap between the physical differences of bilateral neural
structures and their potential connection to cognitive processing and expressed behaviour.
Lateralized Behaviour in Non-Human Animals
Contrary to the early belief that humans were the only species capable of showing
hand preference, Finch (1941) found that in 800 handedness trials 25 out of 30 chimps in
the sample displayed preferential hand use in 80% or more of the trials. The early
exploration into handedness of chimpanzees continued (e.g. Hopkins & Bennet, 1994;
Hopkins, 1996; McGrew & Marchant, 1999; Llorente et al., 2011), with an upsurge in the
exploration of this trait in other primate species, including marmosets (Callithrix spp.)
(Hook & Rogers, 2000; Braccini & Caine, 2009), orangutans (Pongo pygmaeus; Peters &
Rogers, 2008), gorillas (Tennie et al., 2008), and capuchins (Cebus paella) and Rhesus
macaques (Macaca mulatta) (Westergaard & Sumoi, 1996), all finding strong evidence of
handedness. Other surveys of functional laterality have included analyses of detour
behaviour in fish (Bisazza et al., 1997b; Facchin et al., 1999; Heuts, 1999), domestic
chickens (Regolin et al., 1994; Vallortigara et al., 1999a), and dogs (e.g. Siniscalchi et al.,
2013). Lateralized eye use investigations in vertebrates have found differential eye use
preferences in fish, wherein the right eye is preferred when investigating a dummy
predator (Facchin et al., 1999), and the left eye is more often used when inspecting
familiar, social stimuli (Sovrano et al., 1999; Sovrano, 2004; Sovrano & Andrew, 2006).
In Gouldian finches right eye use is critical to choosing a genetically compatible mate
(Templeton et al., 2012). In Australian magpies (Gymnorhina tibicen) left eye inspection
of a predator indicates that the bird will withdraw, whereas right eye investigation
15
have also shown very strong preferences for viewing stimuli: the right eye is more
commonly used when viewing prey items (Vallortigara et al., 1998), whereas the left eye
is preferred for predator inspection (Lippolis et al., 2002); lizards (Podarcis muralis) too
have shown a left eye preference when viewing a predator (Bonati et al., 2013).
Examinations of lateralized footedness in parrots have found that more strongly
lateralized individuals exhibit better problem-solving skills (Magat & Brown, 2009), and
that eye preferences for food inspection correlate highly with foot use (i.e. left eye, left
foot) (Brown & Magat, 2011a). Behavioural laterality has also been found in the
“flippered-ness” of female sea turtles (Dermochelys coriacea) who more often use their
right flipper to bury their eggs in the sand (Sieg et al., 2010).
Experimental work has also shown defined links between bilateral brain structures
and expressed behaviour. Nottebohm and Nottebohm (1976), for example, explored the
hemispheric control of vocalization in canaries and white-crowned sparrows (Zonotrichia
leucophrys) through surgically severing the right or left hypoglossal nerve
(tracheosyringealis) that innervates the muscles of the syrinx responsible for song
production. Those birds whose right hypoglossal nerve was severed experienced little
change to their song production; those birds that had received left nerve severance,
however, experienced disturbed song production ability, indicating left brain control of
vocalization (Nottebohm & Nottebohm, 1976). Similarly, in frogs (Rana pipiens), when
lesions are made to the left pretrigeminal area (PTA), the area housing neurons that
project to and innervate vocal control muscles, release call vocalization is disrupted, but
not when lesions are made to the right PTA neurons (Bauer, 1993). When domestic
chicks were injected with a glutamate solution in either the left or right visual
16
hemisphere showed disruption in their visual discrimination ability, as well as exhibiting
increased attack and copulation behaviours (Deng & Rogers, 1997). From the research of
laterality in non-human vertebrates, commonalities of functional lateralization across
vertebrate species have been identified, yet there is clearly still a need to examine
laterality in a diverse array of species, especially regarding ecologically relevant
behaviours controlled by the left and right brain hemispheres (see Rogers et al., 2013 for
a review).
Laterality and evolution
Hemispheric specialization
Two main hypotheses have been advanced to explain the evolution of vertebrate
hemispheric specialization: asymmetry driven by specializations in feeding structures
(reviewed by Andrew, 2002; Rogers et al., 2013), or driven by the evolution of two eyes
(Andrew, 2002; Rogers et al., 2013). Evidence for the first hypothesis has been modelled
by the single-eyed chordate, the lancelet (Amphioxus) (Andrew, 2002; Rogers et al.,
2013). In the larval stage, the lancelet is asymmetrical in its feeding anatomy with its
mouth located on the left side of the body which permits stationary substrate exploration
for food particles (Stokes, 1997). In the adult stage, however, the lancelet’s mouth shifts
to a central position, but the neural connections controlling feeding behaviour remain
delegated to the left side of the nervous system (Rogers et al., 2013). This left hemisphere
control of the feeding response has endured over the course of vertebrate evolution and
has been demonstrated in species such as toads (Vallortigara et al., 1998) and chickens
(Deng & Rogers, 1997). The hypothesized role of two eyes relies on the supposition that
17
movements toward or away from stimuli (Rogers et al., 2013). Additionally, two eyes
permitted an organism to take in more of its surroundings, meaning there were a greater
number of stimuli to process at one time. This increased need for processing of multiple
stimuli may have been largely responsible for the differentiation of the processing
specialities of the hemispheres over time. The left hemisphere became responsible for
categorizing familiar experiences and stimuli, such as food and conspecifics, and for
regulating routine behaviour (Rogers, 2000; Lippolis et al., 2002; MacNeilage et al.,
2009; Rogers et al., 2013). Toads, for example, have demonstrated more efficient prey
capture ability when a prey item is presented in their right versus their left visual field
(Vallortigara et al., 1998; Robins & Rogers, 2004; Robins & Rogers, 2006), and harpy
eagles (Harpia harpyja; Palleroni & Hauser, 2003) and Japanese macaques (Macaca
fuscata; Petersen et al., 1978) both show a left hemisphere bias for recognition of
conspecific vocalizations. The right hemisphere, on the other hand, manages detection of,
and decisive action in response to, novelty and unexpected stimuli (MacNeilage et al.,
2009; Rogers et al., 2013). Shorter reaction times and more efficient escape behaviour
have been found in toads (Lippolis et al., 2002), fish (Cantalupo et al., 1995), and
stripe-face dunnarts (Sminthopsis macroura; Lippolis et al., 2005) when a predator, an
unexpected stimulus, is viewed in the left visual field. The evolutionary differentiation of
the left and right hemispheres resulting in hemispheric specialization across vertebrates
was likely out of necessity permitting quick processing of multiple forms of ecologically
18
Costs and benefitsof laterality
Having a distinct cerebral asymmetry may hold an ecological cost: there may be a
decrease in efficiency of processing if a given task necessitates interhemispheric
communication (Dadda et al., 2009). For example, in fish choosing between high- and
low-quality shoals, highly lateralized individuals make more errors in choice for quality
due to decreased interhemispheric communication (Dadda et al., 2009). For those
individuals that are highly lateralized in behavioural output it may become difficult to
overcome stereotyped responses to external stimuli leading to response errors. In a radial
maze, highly lateralized fish (Brachyraphis episcopi) consistently turned in their
preferred direction, instead of following a visual cue which signified an immediate food
reward (Brown & Braithwaite, 2004). Further, predators and prey can learn and exploit
behavioural biases, since with repeated exposure response biases may become predictable
(Ghirlanda & Vallortigara, 2004). A final cost of cerebral lateralization is that the natural
environment within which species live is unbiased; prey and predators do not consistently
present themselves on an organism’s “preferred” side, which can lead to increased
vulnerability if responses are strongly biased (Lippolis et al., 2002; Ventolini et al.,
2005); however, animals can still react to stimuli in the “wrong” visual field but the
reaction is less efficient. Taken together, the problem with these costs is plain: a highly
lateralized organism can become vulnerable to predation, as well as to missing feeding
opportunities. In addition, strict adherence to cerebral asymmetry can affect the efficiency
and speed of response (Rogers et al., 2004).
The benefits of laterality, on the other hand, are largely focused on the cognitive
advantages of cerebral lateralization. First, with a lateralized brain an organism may
19
the brain may spare the need for increased neural tissue volume, which is energetically
costly to produce (Aiello & Wheeler, 1995; Tsuboi et al., 2015). Finally, lateralization
helps avoid duplication of function in both hemispheres (Ghirlanda & Vallortigara, 2004;
Vallortigara, 2006) facilitating simultaneous processing of multiple types of stimuli. This
last benefit has been directly demonstrated in pigeons (Güntürkün et al., 2000) and
domestic chicks (Deng & Rogers, 1997) that showed improved visual discrimination
ability between food and non-food items when using the right eye; in lateralized chicks
better able to find food in the presence of a predator as compared to their non-lateralized
counterparts (Rogers et al., 2004); and, similarly, in highly lateralized topminnows,which
were quicker at capturing prey when in the presence of a predator (Dadda & Bisazza,
2006a) or a harassing male (Dadda & Bisazza, 2006b). While there are significant costs,
laterality must provide a greater benefit or relative advantage to the overall fitness of
organisms as we see this characteristic throughout vertebrate evolution. The advantages
discussed here are of clear benefit to the individual but do not explain population-level
laterality (Vallortigara, 2006). Population-level laterality, therefore, should be
investigated from an evolutionary standpoint to understand the importance of this strategy
to survival and fitness (Vallortigara, 2006).
Laterality and population ecology
When considering animal populations, laterality has often been discussed as an
evolutionarily stable strategy (ESS) (e.g.; Ghirlanda & Vallortigara, 2004; Vallortigara,
2006; Rogers et al., 2013; Barnard et al., 2016): a strategy (i.e. behavioural phenotype)
that, once adopted by the majority of a population, cannot be usurped by any other
20
directional bias differs from the group majority the most advantageous course is to align
individual behavioural action with the majority bias (Vallortigara, 2006; Rogers et al.,
2013). Laterality has been modelled as an ESS through game theory modelling by
Ghirlanda and Vallortigara (2004), the first to outline howlaterality can be exhibited in
the context of decision making during predator-prey interactions, suggesting that
population-level laterality can, in many conditions, be a beneficial course of action.
Laterality then can be considered a strategy that dictates how an animal may respond in a
given situation (Maynard Smith, 1982). In this case, it means choosing to escape in a
leftward or rightward direction, effectively increasing the probability of escape if each
member of the group is lateralized in the same direction (Ghirlanda & Vallortigara,
2004). Overall, there is no assumption of a greater benefit of a leftward or rightward
escape bias, but from a population-level point of view, the assumption for greater
probability of success lies with whichever directional preference is in the majority
(Ghirlanda & Vallortigara, 2004). In other words, population-level laterality may be
under the influence of frequency dependent selection, an evolutionary selection process
wherein the fitness of one phenotype (i.e. behavioural strategy) is dependent upon its
frequency in relation to other phenotypes within a given population (Conner & Hartl,
2004). In cases of positive frequency dependent selection, there is a positive correlation
between phenotype and fitness with the opposite being the case for negative frequency
dependent selection (Conner & Hartl, 2004). From a behavioural lateralization standpoint,
both positive and negative frequency-dependent selection can provide a benefit to those
individuals in the majority or minority, respectively. Frequency-dependent selection may,
therefore, work as an explanation to why majority and minority biases exist with respect
21
necessary to investigate vertebrate lateralization from the point of view of evolutionary
game theory, evolutionarily stable strategies, and frequency dependent selection
(Vallortigara, 2006) as these concepts provide a potential explanatory pathway to
population level lateralization. Investigating laterality from the standpoint of an ESS may
provide the necessary link required to bring together neuroanatomical,
neuropsychological and evolutionary approaches to the study of vertebrate lateralization
(Vallortigara, 2006; Rogers et al., 2013).
Mechanistic drivers of laterality
While laterality has been tested in species from each of the major classes of
vertebrates, the mechanisms controlling lateralized growth and/or behaviour have been
studied in only a handful of organisms. For example, canaries, (Nottebohm & Nottebohm,
1976), frogs (Bauer, 1993), and domestic chicks (Deng & Rogers, 1997), have all shown
disrupted behaviour when bilateral neuroanatomical structures have been manipulated. It
is clear that research must continue on mechanistic drivers and in many more species, but
the evidence gathered thus far in this area has provided valuable insight and direction to
further discussion and discovery of the driving forces behind the mechanistic driving
forces of laterality.
Genetic mechanisms
While it is unlikely that one gene controls laterality in all species, evidence is
slowly coming to light through genetic commonalities found within species groups,
leading to the idea of key genetic mechanisms responsible for lateralization. In mice there
22
et al., 1993; Collins et al., 1993), and more recently, directional asymmetry has been
found in the genetic expression of the ASE neurons—a bilateral pair of gustatory
neurons—of all Caenorhabditis elegans worms(Sagasti, 2007). In C. elegans there is a
reciprocal repression of the microRNAs and transcription factors in the genetic circuit
that determines asymmetry of the ASE neurons (Sagasti, 2007, and references therein).
Specifically, for the left ASE neuron the DIE-1 transcription factor promotes the
expression of the microRNA lsy-6, whereas in the case of the right ASE neuron the
COG-1 transcription factor activates expression of the microRNA mir-273 (Sagasti, 2007). This
reciprocal repression circuit in C. elegans is a well-studied and understood genetic circuit
that is responsible for structural or functional laterality, but the genetic keystones to
lateralized brains are, overall, not as well understood in the majority of species requiring
further investigation.
While a genetic mechanism is an important part of the laterality determination
process, this mechanism often requires environmental stimulation at a given time in
development to allow for the gene(s) to be more effectively “turned on” and for laterality
to emerge (Cowell & Denenberg, 2002). In fact, research with domestic chickens (Deng
& Rogers, 1997; Rogers et al., 2004), rats (e.g. Denenberg et al., 1978; Garbanati et al.,
1983), goldbelly topminnows (Dadda & Bisazza, 2012) and zebrafish (Danio rerio;
Sovrano et al., 2016) has shown that this may be the case since lateralization of visual
behaviour develops only if the embryo is exposed to light. However, more work needs to
be carried out with clearly defined genetic mechanisms upon which the environmental
manipulation is acting if we are to make strong conclusions on the overall
23
Rather than implicating a single gene as a driver of lateralization, an alternative
hypothesis suggests that the level of measured asymmetry is related to the overall genetic
variation of an organism, with increased asymmetry predicted in conjunction with
decreasing genetic variation (Leary et al., 1985; Leary & Allendorf, 1989; Bisazza et al.,
1998). What little evidence exists for this hypothesized relationship remains inconclusive:
while some studies have found an effect of level of inbreeding (e.g. Leary et al., 1985),
others have found no such relationship (e.g. Collins et al., 1993; Sheridan &
Pomiankowski, 1997). It may be that there is a connection between measured laterality
and genetic variation, but this relationship could be species-specific and trait dependent.
If so, the level of genetic variation could be used as a determining factor for some species
as to whether laterality is likely to be present and how strongly it may be expressed. The
connection between genetic variation and laterality needs to be more rigorously explored
to better understand what true relationship, if any, exists.
Parental effects
There may be heritability of laterality from parent to offspring, but there is
conflicting evidence on this topic. In mice some studies have found no evidence of
heritability of laterality of paw preference (e.g. Collins, 1968), whereas studies of
handedness in chimpanzees have proposed heritability of the trait (Hopkins et al., 1994),
suggesting, perhaps, that the likelihood of heritability of laterality may differ among
species. One of the best examples of the potential heritability of laterality is in the
topminnow, Girardinus falcatus. Bisazza et al. (2000a; 2007) used artificial selection
over five generations of fish to create preferential turning lines (right, left and no
24
parental fish. When tested in a T-maze, the offspring of the right and left preference lines
exhibited the same behavioural biases as their parental fish, whereas the offspring of the
‘no preference’ line showed an even distribution of directional preferences (Bisazza et al.,
2007), showing clear evidence of a heritable genetic element maintaining lateralization,
since no opportunities for learning the parental preferences were available to the
offspring. Correspondingly, motor asymmetries may be rooted in asymmetries of
neuroanatomy. While conservation of the nervous system can be argued to persist across
generations, and potentially across species (Tierney, 1996; Katz & Harris-Warrick, 1999),
the question remains: if there is heritability or conservation of neuroanatomy, are
lateralized preferences inevitably retained? Could conservation of neuroanatomy,
perhaps determined by particular gene sequences, be enough to maintain laterality across
the evolutionary time scale? Questions such as these have only really begun to be
answered in detail but with more research on lateralized behaviour and neuroanatomy,
and incorporating measures of heritability and maternal and paternal effects, the role of
parental effects on lateralization will become clearer.
The effects of rearing environment
In recent years, the effect of the environment on overall brain development has
garnered particular interest (e.g. Gonzalez-Voyer et al., 2009; Näslund et al., 2012;
Kotrschal et al., 2013) with evidence for differences in brain size corresponding to
differences in rearing environment (Marchetti & Nevitt, 2003; Kihslinger & Nevitt, 2006;
Kihslinger et al., 2006; Burns et al. 2009; Mayer et al., 2011). More recently,
environmental effects have been extended to the study of how features of the environment
25
cockatoos there was no difference in strength or direction of laterality between captive
birds and their wild counterparts (Brown & Magat, 2011b), but in the crimson-spotted
rainbow fish (Melanotaenia duboulayi), enrichment or impoverishment of the rearing
environment did affect brain lateralization, wherein males from impoverished
environments and females from enriched environments were more strongly lateralized in
a test for eye preference (Bibost et al., 2013). In mammals, domestication may be
responsible for limb preferences as observed in horses (Austin & Rogers, 2012) and yet
does not appear to have any effect on eye use preference, as similar patterns have been
found in domestic (Farmer et al., 2010) and feral (Austin & Rogers, 2012) horses
indicating that environmental influences may affect certain forms of laterality but not all.
Predation level can also act as an environmental driver to laterality, with fish
(Brachyraphis episcopi) reared in high predation environments showing different patterns
of laterality compared to their low predation conspecifics (Brown et al., 2004), and male
Trinidadian guppies (Poecilia reticulate) reared with olfactory predator cues having
higher degrees of laterality than those reared without predator cues (Broder & Angeloni,
2014). Light exposure, too, influences visual and motor laterality in both chicks (Deng &
Rogers, 1997; Rogers et al., 2004), and fish (G. falcatus; Dadda & Bisazza, 2012).
Finally, some environmental aspects can negatively affect (i.e. reduce) lateralized
behaviour. Increased levels of CO2 experienced by some fish species (Neopomacentrus
azysron, Gasterosteus aculeatus, and Amphiprion percula) have resulted in a disruption
of lateralized behaviour, which could present a danger to shoaling fishes (Domenici et al.,
2012; Nilsson et al., 2012; Jutfelt et al., 2013). While the evidence investigating
environmental effects on functional lateralization is intriguing, we must keep in mind the
26
result of the interaction of a genetic predisposition for laterality and specific
environmental conditions occurring during a sensitive period. The development of
laterality, therefore, can be considered from a genetic standpoint and, separately, from an
environmental standpoint, but the strongest explanation providing a greater understanding
of lateralization of an organism will come from the discussion of the interaction between
genetic and environmental drivers.
Species differences
Rogers et al. (2013) eloquently outlined the relationships between many
organisms that display laterality in some form, but the main commonality with respect to
laterality among vertebrate species studied to date is that so many of them have
demonstrated this phenomenon, with similarities for certain traits being quite comparable
between species. For example, canaries, white-crowned sparrows (Nottebohm &
Nottebohm, 1976), and frogs (Bauer, 1993) have shown left hemisphere control of
vocalization, and magpies (Koboroff et al., 2008) and some fish (Facchin et al., 1999)
demonstrate a right eye preference when investigating a model predator in close
proximity. Yet even with the general similarities present across species, there are
examples demonstrating that the adage speaks true: differences within groups are often
greater than differences between groups.
Within species differences
In studies investigating larger groups of species for lateralized behaviour,
differences within species groups have been found, where a smaller group of individuals