TANG, HOUJUN. Dynamic Data Prefetching and Layout Optimizations for High Performance Heterogeneous Data Access. (Under the direction of Dr. Nagiza F. Samatova.)
The advancement toward exascale computing is producing massive amount of data. The data is then accessed by analysis and visualization applications to explore and reveal knowledge in it. There is a growing demand for efficient data access for these data-intensive applications as the I/O performance often dominates the overall execution time. However, the existing I/O sub-systems in high performance computing (HPC) only provide general purpose optimizations, and cannot satisfy the dynamic and diverse data accesses from various applications. These accesses often exhibit cer-tain regularities of I/O behavior, which can be characterized as data access patterns. Understanding and utilizing these patterns to optimize for efficient data accesses becomes a challenging task.
With the recognition of data access patterns, data prefetching and layout optimization can be performed to improve the data access efficiency. Data prefetching can bridge the performance gap between memory and data storage devices by making predictions and bringing data before its use. As a result, the CPU stall is masked and data access latency is hidden. As a complement to prefetching, data layout optimization is another promising approach to speedup data accesses. In leadership computing facilities, data is typically stored on the parallel file system with hard disk drives (HDDs). The data organization (layout) is crucial to the access performance. The read performance suffers if it involves a large number of non-contiguous data block accesses, due to the high latency of seek and read operations by the HDDs. Unfortunately, it is common that analytic and visualization applications only require a subset of the data file, with an access pattern that can be very different from how data is written.
We propose a framework that performs data prefetching and layout optimization with the goal to extract the maximum data access performance in modern HPC architectures. We first present an online analyzer that is capable of detecting various heterogeneous data access patterns at an application’s runtime with low computational and memory overhead. Combining our pattern detection with prefetching, high prefetch accuracy is achieved and read performance is improved.
To further optimize data access, we present a dynamic I/O framework that recognizes the data based on access patterns, replicates the data of interest in multiple reorganized layouts that would benefit frequently used read patterns, and makes runtime decisions on selecting a favorable layout for current read request. This framework supports reading individual elements as well as chunks of a multi-dimensional array data.
by Houjun Tang
A dissertation submitted to the Graduate Faculty of North Carolina State University
in partial fulfillment of the requirements for the Degree of
Doctor of Philosophy
Computer Science
Raleigh, North Carolina 2016
APPROVED BY:
Dr. Rada Chirkova Dr. Steffen Heber
Dr. Kemafor Anyanwu Ogan Dr. Ranga Raju Vatsavai
Biography
First and foremost, I am grateful to my advisor, Dr. Nagiza Samatova. I definitely could not have reached this point without her consistent guidance and support in the past four years. I am very thankful to my committee members, Dr. Rada Chirkova, Dr. Steffen Heber, Dr. Kemafor Ogan, and Dr. Raju Vatsavai, for taking their valuable time to serve on my thesis committee, and for offering their insights in this dissertation. I would also like to thank Dr. Rui Mao, my undergraduate advisor at Shenzhen University. Without his guidense and encouragement, I could not have achieved my dream of studying in the United States.
This dissertation would not have been completed without the help from Dr. Samatova’s research group. I am thankful to Eric Schendel and John Jenkins for letting me participate in their research projects in my first year. I am especially thankful to Xiaocheng Zou for his help both in my research and in my life. Additionally, I would like to thank Steve Harenberg and Stephen Ranshous for their help with my research paper writing.
I have had the pleasure of collaborating with researchers at national laboratories: Drs. Suren Byna, Kesheng (John) Wu, Bin Dong, Oliver Rubel, Kristofer Bouchard, Dan Martin, Hans Johansen, and Dharshi Devendran from Lawrence Berkeley National Laboratory, and Scott Klasky from Oak Ridge National Laboratory.
I am thankful to my parents for their unconditional love and support. My mother Hai Zhang, and father Hezhong Tang have been enormously supportive of me throughout my life.
Table of Contents
List of Tables. . . vi
List of Figures. . . vii
Chapter 1 INTRODUCTION . . . 1
1.1 Challenges . . . 3
1.2 Proposed Approaches . . . 5
1.2.1 Access Pattern Guided Prefetching . . . 5
1.2.2 Uniform Grid Data Layout Optimization . . . 6
1.2.3 AMR Data Layout Optimization . . . 7
1.3 Overview of the dissertation . . . 8
Chapter 2 Access Pattern Guided Prefetching . . . 9
2.1 Introduction . . . 9
2.2 Background . . . 11
2.2.1 Structured Access Pattern . . . 11
2.2.2 Unstructured Access Pattern . . . 11
2.3 Method . . . 12
2.3.1 Tracer . . . 12
2.3.2 Online Access Pattern Analysis . . . 13
2.3.3 Structured Access Pattern Analysis . . . 14
2.3.4 Unstructured Access Pattern Analysis . . . 15
2.3.5 Trace Storage with Low Memory Footprint . . . 16
2.3.6 Informed Prefetching . . . 16
2.4 Experimental Results . . . 17
2.4.1 Experimental Setup . . . 17
2.4.2 Structured Access Pattern Performance . . . 18
2.4.3 Unstructured Access Pattern Performance . . . 19
2.4.4 Overhead of Trace Collection and Access Pattern Analysis . . . 21
2.4.5 Accuracy of Access Pattern Detection . . . 21
2.5 Related Work . . . 22
2.6 Summary . . . 24
Chapter 3 Uniform Grid Data Layout Optimization. . . 25
3.1 Introduction . . . 25
3.2 Method . . . 28
3.2.1 Trace Analysis and Pattern Detection . . . 29
3.2.2 Layout Decision Making . . . 31
3.2.3 Pattern and Layout Knowledge Base . . . 33
3.2.4 Layout Reorganization . . . 34
3.3 Results . . . 36
3.3.1 Overview of Evaluation . . . 36
3.3.5 ECoG Benchmark . . . 42
3.3.6 Validation of the Cost Model . . . 44
3.3.7 Overhead . . . 44
3.4 Related Work . . . 45
3.5 Summary . . . 46
Chapter 4 AMR Data Layout Optimization . . . 48
4.1 Introduction . . . 48
4.2 Method . . . 51
4.2.1 Approach Overview . . . 51
4.2.2 Runtime AMR Data Layout Optimization . . . 52
4.2.3 Runtime I/O direction . . . 59
4.3 Results . . . 59
4.3.1 Experiment Overview . . . 59
4.3.2 Evaluation of data organization overhead . . . 61
4.3.3 Evaluation of Performance Model . . . 62
4.3.4 Read Performance Evaluation - BISICLES . . . 63
4.3.5 Read Performance Evaluation - Turbulent Flow . . . 66
4.3.6 Evaluation using Chombo I/O Benchmark . . . 66
4.4 Related Work . . . 66
4.5 Summary . . . 67
Chapter 5 Conclusion and Future Work . . . 70
5.1 Conclusion . . . 70
5.2 Future Work . . . 71
List of Tables
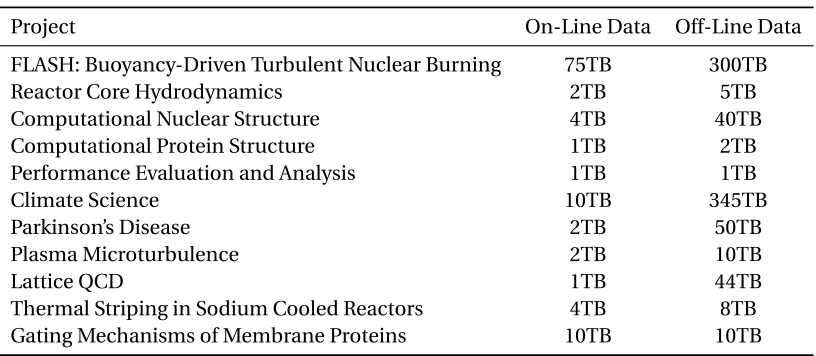
Table 1.1 Data requirements for representative INCITE applications . . . 2
Table 2.1 Ratio of computation time to read time for a given size of data . . . 18
Table 2.2 Prefetching accuracy of three structured access patterns . . . 18
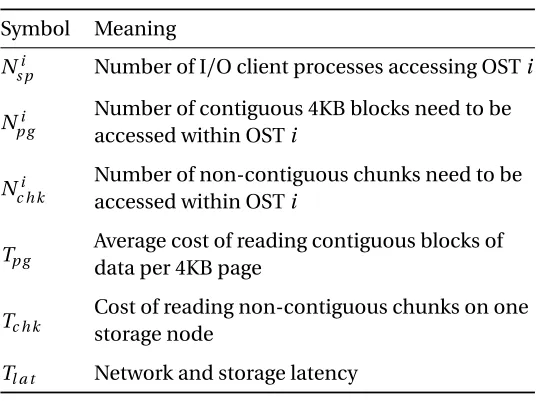
Table 3.1 Parameters in the cost analysis model . . . 33
Table 3.2 Data selections used in the experiments for the plasma physics dataset . . . 37
Table 3.3 Cost model validation . . . 43
Table 4.1 Data storage layout optimization approaches . . . 49
Figure 1.1 Data access/storage hierarchy . . . 3
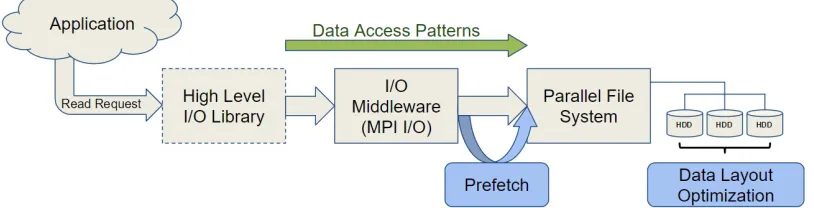
Figure 1.2 Hierarchical I/O stack and optimizations in HPC . . . 5
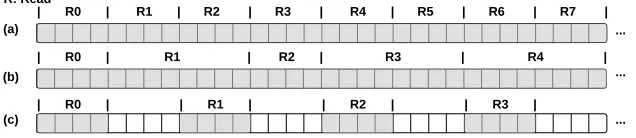
Figure 2.1 Each block represents 1 byte of data stored in row-major format, with shaded blocks being accessed. (a) Contiguous with uniform size: 8 requests (R0 to R7) each access 4 bytes. (b) Contiguous with variable size: 5 requests with sizes of 4,8,4,8,8 bytes. (c) Simple-strided: 4 requests each access 4 bytes of data with 8 bytes between the starting offsets of consecutive requests . . . 11
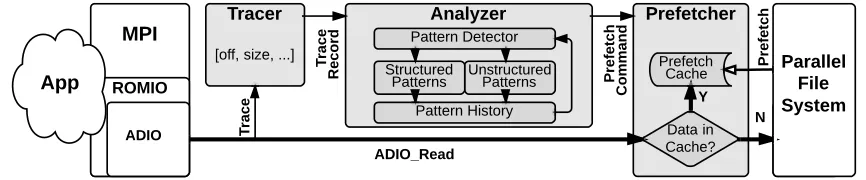
Figure 2.2 An overview of our framework: each time a read request is made, the tracer ex-tracts the read request’s information while it is being passed to the prefetcher. The requested data are copied to user buffer if found in the prefetch cache or a normal file read is issued to the parallel file system, the components added are in shaded shapes . . . 12
Figure 2.3 Offsets of a 3d-strided pattern . . . 14
Figure 2.4 Prefetching is fully masked by computation . . . 17
Figure 2.5 Prefetching is partially masked by computation . . . 17
Figure 2.6 Performance of contiguous and 2d-strided access patterns . . . 20
Figure 2.7 Two types of domain decomposition used in our evaluation . . . 21
Figure 2.8 Performance of row/column domain decomposition with different block size 21 Figure 2.9 Overhead of trace collector and analyzer with 2d-strided and unstructured access pattern . . . 22
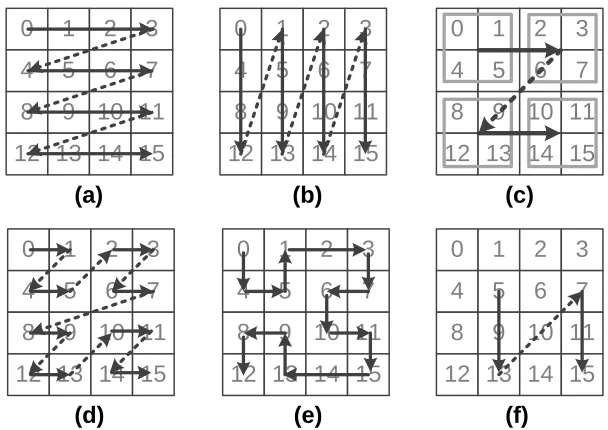
Figure 3.1 Data reorganization techniques that our framework supports. The numbers in each cell are the starting offsets of original data, and the arrow lines are the order of the reorganized offsets: (a) (original) row-major layout, (b) column-major (transposition) layout, (c) blocked (chunking) layout, used as a pre-processing step before applying (d) and (e), (d) z-curve, (e) Hilbert-curve, (f ) custom merging of a subset (data at offsets 5,9,13,7,11,15) . . . 27
Figure 3.2 At runtime, the framework traces and detects patterns of I/O and decides on optimal data layouts. The layout management, i.e., replica creation accord-ing to the optimal layouts is performed offline. When optimal layouts are available, redirection of file read calls to the replicated data is performed at runtime using binary instrumentation. The right side of the figure shows the components of the dynamic reorganization framework . . . 29
Figure 3.3 The eligibility for a replica to be a candidate is determined by how much overlap it has with the read request. A replica is not eligible with no or partial overlap region while eligible in other cases . . . 31
Figure 3.5 Two ideal cases where each OST is only accessed by minimal number of processes. (a) The number of processes equals to that of OSTs. (b) The number of processes is larger than that of OSTs . . . 36 Figure 3.6 An example of the typical accesses for the plasma physics dataset: each box
corresponds to one element, each process reads a number of elements with their locations scattered throughout the dataset . . . 38 Figure 3.7 An example of AR detection code read accesses in a file. A subset of the
rectangular region would result in multiple same-sized blocks with same size gaps in between when data is stored in row-major format . . . 39 Figure 3.8 Q1D1 toQ4D1 compares the time of reading from the original datasetD1
with (“Original+overhead”) and without (“Original”) our framework.Q1D2 toQ4D2 are combined results of two sceneries: (1) no additional storage allowed and our framework selects a “Z-curve” layout and replaces the original dataset with it, (2) sufficient additional space and our framework selects “Concatenation” and creates corresponding partial replicas. The percentage
number labels are the framework’s runtime overhead . . . 40 Figure 3.9 GroupAcompares the time to read from the original dataset, a reorganized
layout with “Transposition”, a reorganized layout with “Concatenation”, where 25 consecutivem/zslices per process are read; GroupBcompares the time to read from original dataset with the time to read from partial replicas reor-ganized with “Concatenation”, where each process reads 3×3 spectra; Group C compares the time to read from original layout, a reorganized layout with “Hilbert-curve”, and a reorganized layout with “Concatenation”, where each process reading 20×20×10000 sub-volumes. The percentage number labels are the framework’s runtime overhead . . . 41 Figure 3.10 ECoG dataset: data having the same label are stored in a file with same-size
blocks but variant gaps in between when stored in row-major format . . . 42 Figure 3.11 Read time comparison with different query selections accessing the ECoG
dataset. With non-regular data selection, our framework selects “Concatena-tion” to reorganize and create partial replicas. The percentage number labels are the framework’s runtime overhead . . . 43 Figure 4.1 An example of the mesh configurations for cell-based and block-structured
AMR data, with three levels and a refinement ratio of 2 . . . 50 Figure 4.2 Overview of the run time data layout reorganization process. With the AMR
a number of AMR boxes (represented as squares). The red arrows are the “jumps” in the new order defined by the SFC, and boxes that are contiguous have the same color within each component. “S” and “E” represents the start and end box as a result of the SFC . . . 54 Figure 4.4 Comparison for the layout reorganization results of applying three approaches
to the level 3 of the Antarctica AMR dataset . . . 56 Figure 4.5 Comparison of read time with different ranges of successive non-contiguous
read offset distances . . . 57 Figure 4.6 Overview of runtime I/O direction . . . 59 Figure 4.7 2D flow past a cylinder at Re=300 with extended wake (l=32). (a), (b), and
(c) are the visualization of three different timesteps . . . 60 Figure 4.8 Two views of the unit data region generated by the Chombo I/O benchmark . 61 Figure 4.9 Runtime layout optimization overhead. “Original” is the total write time, and
the other three bars each represents the total elapsed time for one approach. The time difference between the three approaches and the “original” is the overall computation overhead of our framework . . . 62 Figure 4.10 Comparison between model predicted time and measured read time of
dif-ferent data selections . . . 63 Figure 4.11 Sub-region data selections of the Antarctica ice sheets dataset produced by
BISICLES simulation . . . 64 Figure 4.12 Read time comparison of the different layout strategies using Z-curve,
Hilbert-curve(selected by framework), and Cluster-based on a climate dataset. The different sub-region selections are based on the regions of major ice shelves of Antarctica. The gray skyline shows the average data read per process (right axis). The total time also includes the construction of AMR structure . . . 64 Figure 4.13 The corresponding aggregated data read throughput of the different layout
strategies, also compared with reading the same amount of contiguous data. The throughput is calculated by using only the AMR data read time, excluding the AMR construction time . . . 65 Figure 4.14 Comparison of read times among different layout reorganization approaches
when applied to the flow past a cylinder dataset,original layoutis selected by framework . . . 65 Figure 4.15 Read time comparison of the different layout strategies on a 3D AMR dataset
with three levels and total size of 338GB. The total time also includes the construction of AMR structure,cluster-basedapproach is selected by framework 69 Figure 4.16 The corresponding aggregated data read throughput of the different layout
CHAPTER
1
INTRODUCTION
As computer systems and technology continue to evolve, the size of data being produced is growing increasingly larger. Table 1.1[65]shows the data requirements of representative scientific appli-cations run at Argonne Leadership Computing Facility through the INCITE program from the Department of Energy. The total size of the data produced by simulations and experiments has already surpassed the terabyte scale, now into petabyte.
However, data access speed have not kept up with the growth of computing power and data production rate. As a result, a huge gap emerged between data production and data access per-formance. Figure 1.1 shows the number of CPU cycles required to access register, cache, memory, and hard disk storage. A significant gap between memory and disk can be seen, which is primarily caused by the relatively slow disk access speeds.
Multivariate, spatio-temporal datasets at the tera- and peta-byte scale bring new challenges to the I/O subsystem for modern high performance computing (HPC). With the huge amount of data that needs to be read, the data access time can dominate the analysis or visualization application’s execution time. Optimizing I/O performance becomes a crucial task for these I/ O-bound applications.
Table 1.1: Data requirements for representative INCITE applications
Project On-Line Data Off-Line Data
FLASH: Buoyancy-Driven Turbulent Nuclear Burning 75TB 300TB
Reactor Core Hydrodynamics 2TB 5TB
Computational Nuclear Structure 4TB 40TB
Computational Protein Structure 1TB 2TB
Performance Evaluation and Analysis 1TB 1TB
Climate Science 10TB 345TB
Parkinson’s Disease 2TB 50TB
Plasma Microturbulence 2TB 10TB
Lattice QCD 1TB 44TB
Thermal Striping in Sodium Cooled Reactors 4TB 8TB
Gating Mechanisms of Membrane Proteins 10TB 10TB
or experiment, when the data is being generated, reducing data movement. Data compression is a complementary approach, reducing the size of the data being transfered, thus reducing I/O time, at the cost of having to compress and decompress the data[39, 46, 73]. However, though successfully reducing the required data movement, these approaches have their limitations: the time required to compress and decompress data at the PB scale may be substantial, surpassing the gains from reduced I/O; in-situ processing assumes complete prior knowledge of the analytical tasks to be performed, and requires most of the data to fit in memory. When scientists are performing exploratory analytics or visualization, based on multiple iterations of a diverse set of analytical tasks, having all the data stored permanently on file system is typically preferred.
A typical parallel I/O system has several layers: applications, high-level I/O library, I/O middle-ware, parallel file systems, and the underlying storage devices. In order to bring data from the file system into main memory efficiently, and narrow the gap between computation and I/O across the software stack, each layer has introduced different general purpose optimizations. At the highest level are I/O libraries such as ADIOS[52], NetCDF[64], Parallel netCDF[47], and HDF5[81]. These high level libraries are built on I/O middleware such as MPI/MPI-IO[35, 80], which in turn are built on parallel file systems (PFS) such as GPFS[71], Lustre[8], and PVFS[66]. However, specialized optimizations are left to the domain scientists.
1.1. CHALLENGES CHAPTER 1. INTRODUCTION
Register
O(KB), 1 cycle
Cache
O(MB), 10 cycles
Memory
O(GB), 100 cycles
Hard Disk Drive
O(TB), 10,000 cycles
Latency Gap
Figure 1.1: Data access/storage hierarchy
level details. Thus, it is desirable to have a framework that can perform optimizations to improve data access efficiency automatically, based on either prior knowledge or data access history.
In this thesis, we present our approaches that address this issue. To understand how data is accessed, we first explore data access patterns[51, 53], which play an important role and serve as the fundamental step in our optimizations. For example, the read performance of applications with qualitative and recognizable access patterns, such as 2d-strided read requests, can benefit greatly from various optimization techniques if the pattern can be identified.
Data prefetching and layout optimization are two effective approaches to improve data access efficiency. Prefetching hides the data access latency, masks the CPU stall, and can achieve high accuracy levels if the runtime access patterns can be identified online timely and correctly. While prefetching happens in the I/O middleware layer, data layout optimization focuses on the storage level, as shown in Figure 1.2. The goal for layout optimization is to store the data in such a way that frequently accessed data are organized closely are stored contiguously. In this way, the number of seek and read operations required to satisfy a read request is minimized.
1.1
Challenges
To summarize the problems mentioned in the above sections, we elaborate specifically on the challenges in improving data access efficiency.
(such as composition-based unstructured access patterns). Offline-based tools assume the avail-ability of complete access history of one or more previous runs, which is unrealistic to obtain for scientific applications that run for hours or even days. In addition, offline-based algorithms cannot be directly applied to online analysis as they assume the presence of full access history, which may not fit in memory or be available; and only detect a pattern after its full occurrence, which provides no useful information for the current optimization.
Once a scientific dataset is produced, it’s storage layout typically remains the same. The layout is determined by, and optimized for, the producer that is writing the data to storage devices. A variety of analytical applications may access the dataset, each exhibiting access patterns much different from the writer. While the initial layout is ideal for access patterns similar to that of the writer, it could lead to poor performance (2X to 100X slower) and dominate the total run time. To address these issues, the following challenges must be addressed:
1. Recognizing data usage patterns and identifying an optimal physical layout. The system needs efficient and accurate analysis of various data access patterns. With a number of partial replicas of different layouts, selecting the optimal layout from these replicas becomes crucial for performance improvement.
2. Adapting to changes in read patterns.Read patterns are often dynamic, changing over time as the user explores the data and focuses on different regions of interest.
3. Evaluating costs and benefits in reorganizing data. The system should evaluate the cost to create and store replicas with different layouts, together with the benefits of having this reorganized data, and use this information to help make the creation decision.
4. Handling duplicate data replicas and budgeted storage space for replicas.When the storage space of replicas reaches an upper bound, a decision has to be made about which of the previous replicas to drop (if any).
1.2. PROPOSED APPROACHES CHAPTER 1. INTRODUCTION
1.2
Proposed Approaches
Figure 1.2: Hierarchical I/O stack and optimizations in HPC
In this thesis, we address the problem of improving data access efficiency by proposing two approaches:
• Data access pattern guided prefetching;
• Data layout optimization.
We first present an online access pattern analyzer (Chapter 2) that recognizes patterns during an application’s runtime, and uses the patterns to guide prefetching. Based on the accumulated knowledge of frequent access patterns, we present a dynamic layout optimization framework (Chapter 3) for uniform mesh data. Our framework selects suitable data layouts for heterogeneous patterns, reorganizes the data accordingly, and is entirely transparent to the user. Furthermore, to support the emerging adaptive mesh refinement simulations, and the access of their produced data, we propose an AMR data specific layout optimization approach (Chapter 4). We briefly summarize the contributions of our work.
1.2.1 Access Pattern Guided Prefetching
pattern before being inserted to the trace buffer. The pattern library consists of detection and coalesce rules for detecting structured and unstructured access patterns. Each time a read request is made, the tracer extracts the read request’s information while it is being passed to the prefetcher. The requested data are copied to user buffer if found in the prefetch cache, otherwise a normal file read is issued to the parallel file system. Figure 1.2 shows the modified parallel I/O stack that includes our prefetcher, shown as the shaded shape between the middleware and PFS layers.
We used PIO-Bench[75], a widely used synthetic parallel file system benchmark suite, to con-duct experiments with various structured access patterns. For unstructured access patterns, we developed a micro-benchmark that simulates the file read behavior of an application that performs 3D visualization of climate datasets. With the pattern-aware prefetching, our method results in up to 26% run-time reductions on top of less than 5% overhead, with both kind of access patterns, in 22 benchmark evaluations.
1.2.2 Uniform Grid Data Layout Optimization
We proposed a framework that selects the most suitable layout among the common layout reor-ganization techniques based on detected data usage patterns. It is capable of performing storage-efficient optimizations for heterogeneous patterns, from both bounding box and element data selections. The framework is composed of aTrace Analyzer,Layout Decision Maker,Pattern and Layout Knowledge Base, andData Reorganization Manager.
The Trace Analyzer uses a binary instrumentation method to trace I/O read calls and to identify data access patterns. We have developed in this work a cost model to predict the number of contiguous blocks accesses by a read access pattern. The Layout Decision Maker analyzes the cost of accessing data using the available layouts of the requested data, and selects the layout that would give the best performance. The Data Reorganization Manager uses suggestions of improved layouts to replicate and reorganize data. An advanced user can also initiate a request to the Data Reorganization Manager. When multiple replicas of the data with different layouts are available, the Layout Decision Maker dynamically redirects the read call to the selected replica for obtaining the best performance. The metadata related to the available layouts and data access pattern history are managed in the Layout and Pattern Knowledge Base.
To measure the performance of our proposed framework, we used I/O kernels extracted from four different scientific applications or datasets from various science domains, including:
1.2. PROPOSED APPROACHES CHAPTER 1. INTRODUCTION
• accessing climate model and observation data, used for detecting Atmospheric Rivers (AR), to demonstrate the ability of applying historical optimization strategies on new datasets;
• accessing Electrocorticography (ECoG) data, to demonstrate the support for non-regular patters with an ability to perform optimizations for different data regions;
• accessing data from Mass Spectrometry images to show that our framework is able to support and manage different layout reorganization techniques at the same time.
Our framework yields up to 90X time speedup in the plasma physics queries that uses element selection, and up to 8X speedup for other experiments using bounding box selection.
1.2.3 AMR Data Layout Optimization
Adaptive mesh refinement (AMR) has gained its popularity in recent years, with the ability to dynamically adapt simulation resolution across space and time. It greatly improves the efficiency of computational resources, meeting the acceptable error levels for numerical convergence at the same time. However, the hierarchical and complex data structure of AMR differs greatly from uniform grid data, and brings new challenges to I/O optimization.
AMR libraries like Chombo do not provide functions to access AMR data with spatial selection. Instead, the entire dataset must read to access any region, which is extremely inefficient for analyzing a small region of interest. Even with support for reading data subsets, performance could still be poor, as boxes of data that are selected are scattered across the file, and may cause contention on the parallel file system. Moreover, other files that are accessed together with the AMR dataset, such as index files, could yield high data access latency.
Towards enabling efficient AMR data accesses, we present an I/O framework that addresses the issues of runtime data reorganization, supporting the complex structure of AMR data. We propose a new clustering-based approach to reorganize the AMR box storage layout, with consideration of the Lustre parallel file system’s bulk I/O RPC size, which is shown to be more effective than space-filling curves. As the spatial location information of AMR boxes are contained within the dataset, no prior knowledge of the dataset is required with our optimization. Our framework automatically selects from a set of candidate layouts based on a performance model, and reorganizes the data before writing to storage.
all read accesses into contiguous reads, we are able to achieve 90% of contiguous read throughput with the optimized layouts on average.
1.3
Overview of the dissertation
CHAPTER
2
ACCESS PATTERN GUIDED
PREFETCHING
In this chapter, we first introduce an online analyzer capable of detecting both simple and complex access patterns with low computational and memory overhead. We then utilize the analyzer to guide data prefetching and show the performance improvement with different I/O benchmark configurations.
2.1
Introduction
Scientists who work with simulations such as S3D combustion[17]and GTS core plasma fusion[84] spend a significant amount of time analyzing the massive amount of data generated. With the increasing gap between CPU and I/O, the performance of scientific analysis and visualization applications are often I/O-bound[97], thus read performance becomes a key area for optimization. An essential component of this process is to better understand the application’s I/O behavior or its access patterns.
row-major format, reading consecutive rows of the matrix results in a contiguous pattern, whereas reading one column induces a simple-strided pattern with the file pointer incremented by the same amount (row size) between each request. Scientific applications exhibit these patterns and others, including higher dimensional strided access patterns and composition-based or correlation-based unstructured access patterns.
Recognizing access patterns in an application is a key to potentially reducing future file read time. Scientific applications often read and analyze data alternately, thus by overlapping the two phases with prefetching can significantly reduce the overall execution time of the application. Accurate prefetching can be achieved with access pattern analysis.
In order to achieve high prefetching accuracy, it is necessary to acquire comprehensive knowl-edge of the application’s access patterns. Various methods have been proposed[11, 19, 48, 60], however, these tools are all offline-based and not capable of detecting complex access patterns (such as composition-based unstructured access patterns). Offline-based tools assume access history of one or more previous runs beforehand, which is unrealistic to obtain for scientific appli-cations nowadays that run for hours or even days. In addition, offline based algorithms cannot be directly applied to online analysis as 1) they assume the presence of full access history, which may not fit in the memory; and 2) they detect a pattern after its full occurrence, which provides no useful information for the current optimization strategy.
We propose a method for online analysis that requires no prior information of the application. To the best of our knowledge, our method is the first one capable of performing online analysis of various complex access patterns. Our framework collects an application’s file read requests during its run-time and perform online analysis to guide prefetching. The contributions of this work are as follows:
1. Online, low-overhead pattern analysis with high accuracy. We adopt a “pattern growth” approach and efficient pattern detection algorithms to enable online analysis with overhead less than 5% in all test cases. The overall run-time reduction is up to 26% via pattern-aware prefetching with accuracy up to 99%;
2. Support for various access patterns.We develop an analyzer capable of detecting structured access patterns as well as composition-based and correlation-based unstructured access patterns;
2.2. BACKGROUND CHAPTER 2. ACCESS PATTERN GUIDED PREFETCHING
2.2
Background
Many I/O access patterns classification approach have been proposed[11, 23, 54]. Compared with them, we additionally support unstructured access pattern. Although the access pattern classification is similar, the algorithms to detect the patterns are different for offline and online analysis, as explained in Section 3.1.
2.2.1 Structured Access Pattern
Structured access patterns include contiguous, simple-strided, andkd-strided patterns. Fig. 2.1 illustrates the former two kinds. A contiguous pattern occurs when consecutive read requests are accessing a contiguous region of data in a file. It can be further divided into uniform and variable size patterns. For strided patterns, a stride is the difference between starting offsets of consecutive requests, and is fixed within each dimension. Simple-strided pattern is a special case ofkd-strided whenk=1. Akd-strided pattern can be viewed as a series ofk−1d-strided segments with itsk dimensional stride. For example, a 2d-strided pattern with the following offsets:{1, 3, 5, 11, 13, 15, 21, 23, 25}, is composed of three simple-strided segments{1,3,5},{11,13,15}, and{21,23,25}, with the second dimensional stride of 10.Kd-strided pattern is often found when accessing a sub-volume or sub-plane of multi-dimensional data.
2.2.2 Unstructured Access Pattern
Unstructured access patterns are accesses that exhibit patterns with less regularity compared to structured ones. The number of accesses is linear to the number of parameters representing them, while exponential for structured ones. There are two particular instances that we found useful for scientific applications, which are referred as composition-based and correlation-based unstructured
Figure 2.2: An overview of our framework: each time a read request is made, the tracer extracts the read request’s information while it is being passed to the prefetcher. The requested data are copied to user buffer if found in the prefetch cache or a normal file read is issued to the parallel file system, the components added are in shaded shapes
access patterns. The composition-based patterns capture the repeating intervals between structured patterns or individual accesses, which is further explained in Section 3.3. Previous research in[48] exploited block correlations in storage systems. We include this kind of pattern and referred it as correlation-based unstructured access patterns. For example, from an offset sequence of{10, 20, 30, 40, 50, 10, 70, 20, 30, 80, 10, 40, 20, 30}, the correlation-based pattern is{10|20,30}and{20|30}, meaning that the data starting from offset 20,30 is frequently accessed after 10, while 30 is often accessed after 20. The threshold value of frequent accesses is 3, which is the number of times an offset occurs to be considered in a pattern. The request size is omitted for simplicity.
2.3
Method
Our online analyzer performs access pattern analysis of applications during their run-time and utilize the pattern information to guide prefetching for better performance. Fig. 2.2 illustrates the overview of our framework.
2.3.1 Tracer
2.3. METHOD CHAPTER 2. ACCESS PATTERN GUIDED PREFETCHING
of MPICH[9]3.0.4 source code.
2.3.2 Online Access Pattern Analysis
We adopt a rule-based model for access pattern detection in our online analyzer, which is the key component the framework. We maintained a “pattern library” that contains a collection of rules. These rules provide a concise description of the access sequences that are recognized as access patterns. The input is a sequence of accesses and the output is the detected access patterns and corresponding prefetching instructions.
Each time a read request is traced, the analyzer first performs a lookup in the pattern history to decide whether to activate a previously detected pattern and start prefetching or use it for analysis. The pattern analysis procedure includes the following steps:
1. Create a new pattern if current records in the trace buffer match any detection rules in the pattern library;
2. “Grow” the current pattern if the following accesses belong to it and inform the prefetcher to prefetch data that are predicted to be accessed next;
3. Commit the access pattern to the pattern history when the new access do not fit in;
4. Attempt to coalesce the current pattern with previous structured ones to form a higher level pattern;
5. Look back in the pattern history and check if there is any pattern that matches the current one.
More details of this procedure are explained in later examples of structured and unstructured pattern analysis.
Figure 2.3: Offsets of a 3d-strided pattern
2.3.3 Structured Access Pattern Analysis
Different detection rules are used for contiguous and simple-strided access patterns. A contiguous pattern is determined by having at least 3 consecutive accesses with no gap in between. A simple-strided pattern comes with same offset differences (stride) between at least 3 consecutive accesses with identical request size. Kd-strided pattern is composed of(k−1)d-strided segments and is detected by the coalesce rule, which checks the stride and the number of accesses of two strided patterns with the same dimension. Note that each dimension of akd-strided pattern must have at least three(k−1)d-strided segments.
Take a 2d-strided pattern with the following offsets{1, 3, 5, 11, 13, 15, 21, 23, 25, 31, 33, 35}as an example. The second dimensional stride can not be determined until 31 is accessed that signals the end of the third simple-strided segment. With three simple-strided segments detected and committed, they are coalesced to a 2d-strided one(step 1 to 4 of the pattern analysis procedure). An earlier detection is possible if a previous 2d-strided pattern with the same stride and number of accesses of first dimension exists in the pattern history: we temporarily mark the current simple-strided pattern of{1, 3, 5}as the 2d-strided one and start prefetching (step 5). Once a mismatch happens, it is restored to the previously detected pattern and continue the analysis procedure. Only the most recent pattern that qualifies is used in case multiple candidates exist, as same pattern tends to occur close in time.
2.3. METHOD CHAPTER 2. ACCESS PATTERN GUIDED PREFETCHING
The time complexity the above pattern detection process isO(n×Ts t r u c t), and for the coalesce rule isO(Ns p a t t e r n), wheren is the number of total accesses, and Ns p a t t e r n is the number of detected structured access patterns. Though the time complexity depends on the whole trace and could be quite large, the frequency of the analysis is expected to be high and as a result for each analysis procedure the workload is relatively small.
2.3.4 Unstructured Access Pattern Analysis
Previous analyzers usually deal with access patterns build from individual accesses. However, when accessing time-series data generated by scientific simulations, a higher level of pattern often exists between the accesses of different time steps. For example, if a scientist wants to visualize a climate dataset with hourly recorded data at the times when the daily low/high temperature occurs (usually 5-6am and 2-3pm) for 30 days. The corresponding visualization application would read data of time step 5, 6, 14, 15, 29, 30, 38, 39, 53, 54, 62, 63, etc. and for each time step, structured access patterns could exist if a sub-volume decomposition is used for parallel processing. State-of-the-art analyzer like IOSIG[11]is only able to detect the structures ones within each time step, while not recognizing the higher level of composition-based unstructured pattern with time step intervals repeating 29 times of{1,8,1,14}.
The detection rule for composition-based pattern detection is to find offset delta (the difference between any two consecutive offsets) sequences that repeat at least twice. Two separate delta sequences are created from the offset of accesses and the starting offset of structured access patterns. To efficiently detect such patterns, we build suffix trees incrementally that has linear time and space complexity. The corresponding pattern can be easily obtained from its suffix tree after each time of analysis. Since the number of patterns is significantly smaller than that of accesses, this process is expected to be of low computation overhead.
as much as possible.
The limitation of non-structured access patterns is that it is only effective when there is sufficient amount of accesses accumulated during an application’s run time. To help user better understand the access pattern and improve the analysis performance, we provide the option of post-run analysis. Access patterns can be saved to files after all data loading process have completed. The output file can be used as the meta-data file and be loaded in later runs. This is useful when the same data files are used multiple times with same or similar access patterns.
Since the detected patterns are per-process based, we will form global patterns when possible. One use case of this is when each process of an application reads only part of the data and the total data accessed is a contiguous region. When running that application with different number of processes, the local pattern of each process will change but the global patterns remain the same, and we can infer the pattern of each process from the global one.
2.3.5 Trace Storage with Low Memory Footprint
Our framework requires limited additional memory usage during application’s run-time. The tracer extracts useful information from read requests and passes them to the analyzer to determine whether to store them in the trace buffer. Trace records are compressed to a pattern representation if possible. The memory used for structured access patterns are significantly reduced due to its regularity. A 2d-strided pattern with 1024 accesses needs approximately 102KB in memory while only 134B with a pattern representation. The unstructured access patterns require more storage than structured but still use much less memory than keeping all its accesses.
In addition, since online analysis focuses on current access patterns, only recent trace records are kept in the trace buffer. The tracer is implemented in the ADIO layer of MPI-IO, on which MPI optimizations like data sieving can be captured and utilized, as well as allowing the usage of other PMPI-based methods, such as Darshan[16]. The trace record contains information of its MPI rank, file ID, offset, request size, starting time, and operation type. Patterns are stored in a compact format: the structured access pattern contains file ID, pattern type, start time, start offset, and request size.
2.3.6 Informed Prefetching
2.4. EXPERIMENTAL RESULTS CHAPTER 2. ACCESS PATTERN GUIDED PREFETCHING
Figure 2.4: Prefetching is fully masked by computation
Figure 2.5: Prefetching is partially masked by computation
the analysis and prefetching are per-process based. We adopted a conservative prefetching strategy to minimize the cost of mis-prefetching: the prefetcher starts to prefetch data when a stable access pattern is detected and stops immediately when the previously prefetched data is not used, which indicates the detected access pattern is terminated.
2.4
Experimental Results
2.4.1 Experimental Setup
Table 2.1: Ratio of computation time to read time for a given size of data
Size min min100 mean sd sort
128KB 0.027 0.061 0.183 0.353 1.388 1MB 0.028 0.031 0.221 0.428 1.899 16MB 0.034 0.027 0.244 0.473 2.586
Table 2.2: Prefetching accuracy of three structured access patterns Pattern Type Size Read # Accuracy
Contiguous/ Simple-strided
128KB 1024 99.9%
1MB 512 99.8%
16MB 32 96.5%
2d-strided
128KB 1024 99.8%
1MB 512 99.6%
16MB 32 92.0%
2.4.2 Structured Access Pattern Performance
We used the PIO-Bench[75], a widely used synthetic parallel file system benchmark suite, and conducted experiments with contiguous, simple-strided, and 2d-strided access patterns to evaluate the performance with structured access pattern detection. The sequential (contiguous in our classification), simple-strided, nested strided (2d-strided), segmented (contiguous) and Tiled I/O (simple-strided with different parameters) access patterns fall in structured access patterns in our classification.
As mentioned in Section 1, the benefit of prefetching comes from overlapping I/O and compu-tation. Fig. 2.4 and Fig. 2.5 illustrate four periodic read (R D0 to R D3) that are fully and partially masked by the computations via informed prefetching and the total time ofT1andT2is reduced. To
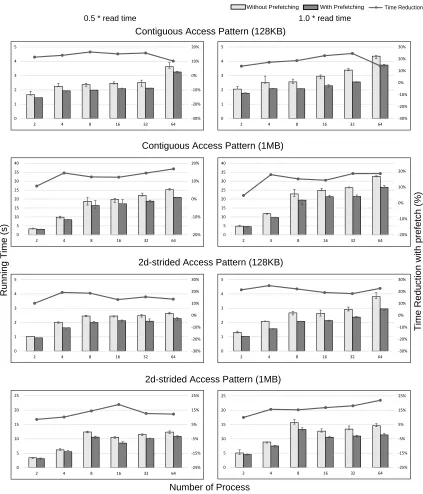
mimic real application’s behavior, we insert computation time between each file read operation of PIO-Bench. To determine the computation time, we collected the time of running GNU Scien-tific Library functions such as find minimum number, first 100 smallest numbers, mean, standard deviation, and sorting. The ratio of computation time to read time for different size of data are shown in Table 2.1. We found the ratio of 0.5, 1.0, and 2.0 could represent different scenarios of real computation time and thus are used in our experiments. The results of simple-strided is similar to those of 2d-strided and we show the results using ratio of 0.5 and 1.0 that represent I/O intensive and compute intensive scenarios, contiguous and 2d-strided access pattern, and read request of 128KB and 1MB.
2.4. EXPERIMENTAL RESULTS CHAPTER 2. ACCESS PATTERN GUIDED PREFETCHING
in all cases with the percentage of up to 26% and an average of 17% for contiguous access pattern and 16% for 2d-strided. The performance gain of the informed prefetching with access pattern analysis are more pronounced when the computation to read time ratio is 1.0 because read time is fully masked by computation. For ratio with 2.0, the time reduction percentage is between that of 1.0 and 0.5, which is expected because the potential of run-time reduction is less when computation takes most of the time. Compared with offline methods such as that in[11], we achieve approximiately the same IO improvement.
Since the read size of each experiment is fixed, we could also see a trend of time increase with the number of processes increases, this is due to more requests to the parallel file system slows down its performance. We also observed that for the cases with 8 processes that takes longer time than 4 or 16, we believe this is caused by network congestion since all 8 processes are on the same node and send read requests concurrently.
2.4.3 Unstructured Access Pattern Performance
The random strided pattern of PIO-Bench is a composition-based unstructured access pattern, however, this pattern is too simple compared to real scientific applications. Thus we developed a micro-benchmark with both structured and unstructured access patterns. We found the results for correlation-based patterns are similar to those in[48].
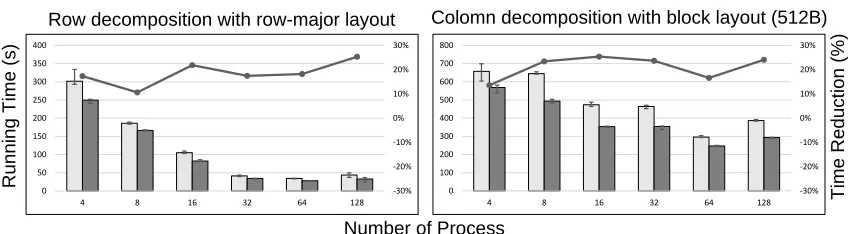
The micro-benchmark simulates the file read behavior of an application mentioned in Section 2.3.3, which performs 3D visualization of climate datasets with hourly data at time steps when daily low/high temperature occurs. A sub-volume decomposition is used to perform parallel I/O for each time step. We experimented with two types of decompositions: row-wise and column-wise, as shown in Fig. 2.7. For each time step, the 3D data is broke into “slices” and each process reads one slice. The resulting access pattern contains both structured (simple/2d-strided within each time step) and composition-based unstructured pattern (repeatingkd-strided with time step interval rotates from{1,8,1,14}). Similar to the previous experiments, we set the computation time to the average time of each file read. In addition to using plain row-major file layout, we also tested with files stored with block layout. Scientific applications like ScaLAPACK benefits from this kind of layout as they use blocks as the unit for communication and computation. The normal row-major file layout can also be viewed as the block layout with block size of 8B (the size of double).
-30% -20% -10% 0% 10% 20% 0 1 2 3 4 5
2 4 8 16 32 64
-30% -20% -10% 0% 10% 20% 30% 0 1 2 3 4 5
2 4 8 16 32 64
-20% -10% 0% 10% 20% 0 5 10 15 20 25 30 35 40
2 4 8 16 32 64
-20% -10% 0% 10% 20% 0 5 10 15 20 25 30 35 40
2 4 8 16 32 64
-30% -20% -10% 0% 10% 20% 30% 0 1 2 3 4 5
2 4 8 16 32 64
-30% -20% -10% 0% 10% 20% 30% 0 1 2 3 4 5
2 4 8 16 32 64
-25% -15% -5% 5% 15% 25% 0 5 10 15 20 25
2 4 8 16 32 64
-25% -15% -5% 5% 15% 25% 0 5 10 15 20 25
2 4 8 16 32 64
Without Prefetching With Prefetching Time Reduction
0.5 * read time 1.0 * read time
Contiguous Access Pattern (128KB)
Contiguous Access Pattern (1MB)
Running Time (s)
2d-strided Access Pattern (128KB)
Time Reduction with prefetch (%)
2d-strided Access Pattern (1MB)
Number of Process
Figure 2.6: Performance of contiguous and 2d-strided access patterns
2.4. EXPERIMENTAL RESULTS CHAPTER 2. ACCESS PATTERN GUIDED PREFETCHING Proc 0 Proc 1 Proc 2 Proc 3 Proc 3 Proc 2 Proc 1 Proc 0
Row Column Timesteps
... ...
Figure 2.7: Two types of domain decomposition used in our evaluation
-30% -20% -10% 0% 10% 20% 30% 0 50 100 150 200 250 300 350 400
4 8 16 32 64 128
-30% -20% -10% 0% 10% 20% 30% 0 100 200 300 400 500 600 700 800
4 8 16 32 64 128
With Prefetching Time Reduction
Without Prefetching
Colomn decomposition with block layout (512B)
Time Reduction (%)
Number of Process
Running Time (s)
Row decomposition with row-major layout
Figure 2.8: Performance of row/column domain decomposition with different block size
ranges from 13% to 26% with prefetching, which proves the effectiveness of the analyzer.
2.4.4 Overhead of Trace Collection and Access Pattern Analysis
The overhead of our trace collector and analyzer is defined as the time difference between the two runs with our framework and with original MPICH. To test the overhead of trace collection and analysis, we run with the previous configurations by setting the computation time to, the median of 10 different runs is used. We show results of two different cases in Fig. 4.9. Similar overhead is observed in other cases and all are less than 5%.
2.4.5 Accuracy of Access Pattern Detection
-5% -3% -1% 1% 3% 5% 0 5 10 15 20
2 4 8 16 32 64
-5% -3% -1% 1% 3% 5% 0 30 60 90 120 150 180
4 8 16 32 64 128
2d-strided access pattern
With Prefetching Overhead
Without Prefetching
Overhead (%)
Number of Process
Running Time (s)
Row decomposition with row-major layout
Figure 2.9: Overhead of trace collector and analyzer with 2d-strided and unstructured access pattern
2.5
Related Work
Various methods have been proposed to utilize access patterns for I/O optimization. In HPC commu-nity, tracing and profiling tools that are used for analysis and visulization purposes such as TAU[74], Jumpshot[94], Periscope[31], Upshot[37], and KOJAK[56]. Gong et. al[32]proposed a parallel run-time layout optimization framework to speed up queries on large complex scientific datasets. In database community, utilizing access patterns to guide prefetching proves to be effective[36]. Unlike their methods that deal with file layout organization and database objects, respectively, our work only involves MPI-IO and is on byte level. These tools mainly focus on profiling and analyzing an individual application’s parallel processing performance, MPI messaging between computing nodes and processes/threads, and I/O behaviors in main memory layer instead of file storage layer. To understand the I/O behavior of the data access from various applications, Reed et al. have categorized several common data access patterns of parallel applications[53–55].
2.5. RELATED WORK CHAPTER 2. ACCESS PATTERN GUIDED PREFETCHING
offline-based ones.
Another method is streaming frequent itemset mining [14]. However, the frequent itemset mining algorithm are used with large-scale transaction data while our data is a single long sequence of accesses. Breaking the sequence into multipleshort sequences and viewing them as transactions will cause information to be lost, as occurrences could be split into two sequences.
Data prefetching is an effective latency-hiding solution for improving efficiency of parallel I/O and has been extensively studied and widely used[3, 5, 24, 25, 28, 30, 49, 59, 89]. However, the traditional prefetching strategies such as file-system level approaches are conservative. Even with advanced parallel file systems such as PVFS[66], Lustre[8], and GPFS[71], high bandwidth is not achieved when only simple patterns such as contiguous or simple strided are detected. They cannot provide satisfactory performance for the modern scientific simulations with a large number of complex access patterns. Patterson et al. proposed informed prefetching[62], but this requires developers to add I/O hints to the program. Unlike their method, our framework requires no code modification.
While the above research work focus on access patterns of data within a file, to detect access patterns of files have also been investigated. One approach is to use graphical models to represent unstructured access pattern. The main idea is to record number of times that one itemais accessed within a time window after anotherb as the weight of edge connecting vertexaandb. Kuenning et al. used probability[42, 43]to capture file correlations in file systems. Bhadkamkar et al. proposed BORG[6], a self-optimizing storage system that performs automatic block reorganization based on the directed process access graph build with traces obtained from profiler at the block layer. Our current work is only applied on patterns within a file, but it can be extended to detect file access patterns as well. Besides, one major problem when using graph is that it is very likely to consume too much memory storing the graph. In our method, patterns stored in a much more compact way that requires much less space.
2.6
Summary
CHAPTER
3
UNIFORM GRID DATA LAYOUT
OPTIMIZATION
In previous chapter we proposed an online analyzer that is capable of detecting both simple and complex access patterns with low computational and memory overhead, by combining our pattern detection with prefetching, we have achieved high prefetch accuracy and accelerate runtime I/O. However, through our experiments we found that another aspect that has a significant impact on the I/O is the data storage layout. In this chapter, we focus on dynamic layout reorganization to improve the locality of uniform grid data accesses and achieve multi-fold I/O performance improvement.
3.1
Introduction
subsetof variables within a specific region over a number of time steps. Such mismatches between a write layout and a read pattern lead to poor read performance due to a large number of seek and read operations to hard disk-based file systems. This issue is exacerbated by the advancement towards exascale computing, leading to ever-increasing dataset sizes and thus presenting challenges with data management and I/O optimization for efficient data accesses.
To address this data layout mismatch issue, many layout reorganization methods have been proposed to increase the number of contiguous I/O accesses. For instance,space-filling curves, such as Hilbert-curve and Z-curve, are used to reorganize the original data[82]; arraytransposition is applied to create multiple full replicas[50]of data; andmergingof multiple non-contiguous data blocks to a single contiguous chunk to create partial replicas[40, 90]. Each of these techniques has its own advantages and disadvantages. Space-filling curves bring performance benefits to sub-region accesses by reorganizing the dataset and they require no additional storage when only the original data is reorganized. Array transposition leads to better performance for accesses that have significantly larger sizes along one dimension. However, transpositions may require multiple replicas of the data. Specialized merging with partial replication results in better performance, as the previously non-contiguous data accesses become contiguous.
Despite various advantages of reorganization, none of the strategies alone can provide near-optimal read performance for hetergeneous patterns of analytic applications. To support multiple read patterns, there is a need for managing different layout strategies. These organizations shall facilitate commonly used spatial selections defined by multi-dimensional bounding boxes as well as by random element (point) selections. As storage space for managing multiple full replicas is expensive, support for managing partial replicas considering the storage budget is necessary. Transparent redirection of accesses to the available replicas that may match fully or partially are required as well. To the best of our knowledge, a framework supporting these requirements is absent in scientific data management. These optimizations are common place in the relational database management[1]. However, scientific data is often stored on parallel file systems using file formats such as HDF5 and NetCDF that do not provide such data reorganizations.
In this paper, we present the dynamic data reorganization framework that performs dynamic data access pattern tracing and identification functions, efficient storage of partial replicas to support multiple read patterns, and redirection of read accesses to a favorable layout at runtime. Our data reorganization framework shows a broader applicability compared to existing methods, enabled by the following main contributions of this work.
3.1. INTRODUCTION CHAPTER 3. UNIFORM GRID DATA LAYOUT OPTIMIZATION
0
1
2
3
4
8
12
5
6
7
9
10 11
13 14 15
0
1
2
3
4
8
12
5
6
7
9
10 11
13 14 15
0
1
2
3
4
8
12
5
6
7
9
10 11
13 14 15
0
1
2
3
4
8
12
5
6
7
9
10 11
13 14 15
(a) (b) (c)
0
1
2
3
4
8
12
5
6
7
9
10 11
13 14 15
0
1
2
3
4
8
12
5
6
7
9
10 11
13 14 15
(d) (e) (f)
Figure 3.1: Data reorganization techniques that our framework supports. The numbers in each cell are the starting offsets of original data, and the arrow lines are the order of the reorganized offsets: (a) (original) row-major layout, (b) column-major (transposition) layout, (c) blocked (chunking) layout, used as a pre-processing step before applying (d) and (e), (d) z-curve, (e) Hilbert-curve, (f ) custom merging of a subset (data at offsets 5,9,13,7,11,15)
supports the HDF5[81]library in tracing bounding box selections, known ashyperslabsin HDF5, and element selections.
2. Flexible multi-layout management with storage budgets.Instead of using only one layout reorganization technique, we provide more flexibility by supporting multiple layout reorga-nization techniques among those shown in Figure 3.1. Based on the user-specified storage constraint and current usage patterns, our framework evaluates the costs of reorganization and the benefits with accessing the reorganized data to select the most suitable technique. 3. Runtime decision making with partial match and redirection.By allowing partial matches
The remainder of this paper is organized as follows: We briefly discuss the related work in Section 4.4. In Section 3.2, we present a high-level overview of the proposed data reorganization framework and describe the functionality of different components. We demonstrate the application of the framework in Section 4.3 using read patterns from multiple real applications and conclude our discussion in Section 3.5. various automated scientific data management optimizations[29, 86]. In this paper, we present the dynamic data reorganization service framework that performs dynamic data access pattern tracing and identification functions, efficient storage of partial replicas to support multiple read patterns, and to direct read accesses to optimal layouts at runtime.
3.2
Method
We present an overview of the proposed dynamic data reorganization framework in Figure 3.2. The main components of the framework areTracer,Trace Analyzer,Layout Decision Maker,Pattern and Layout Knowledge Base, andData Reorganization Manager.
The tracer traces the accessed files, variables, and the offsets (data locations) of the application’s reads and pass them to access pattern analyzers to identify the read patterns. The analyzed results are stored as metadata and managed by SDS Metadata Manager, which implemented using Berkeley DB. With the identification of the data usage patterns, the layout reorganizer will create replicas with optimized layout for the patterns. These replicas will be used for future accesses that have same or similar patterns.
The Trace Analyzer uses a binary instrumentation method to trace I/O read calls and to identify data access patterns. Our current implementation supports the HDF5 library to trace hyperslab (a subset of a multi-dimensional array) definitions that access bounding box and element selections. We have developed in this work a cost model (Section 3.2.2) to predict the number of disk drive page accesses by a read access pattern.
The Layout Decision Maker analyzes the cost of accessing data using the available layouts of the requested data and selects a layout that would give the best access performance. The supported layout reorganization techniques, as shown in Figure 3.1, are designed as plugins so new layouts can be easily added for more specialized optimization.
3.2. METHOD CHAPTER 3. UNIFORM GRID DATA LAYOUT OPTIMIZATION
HDF5 I/O
Trace Analyzer
Original Data
Replica Replica
Pattern and Layout Knowledge Base
Layout Decision
Maker
Data Reorganization
Manager
Parallel File System
Redirection
Pattern History Read Call
Pattern
User's Directive
Figure 3.2: At runtime, the framework traces and detects patterns of I/O and decides on optimal data layouts. The layout management, i.e., replica creation according to the optimal layouts is performed offline. When optimal layouts are available, redirection of file read calls to the replicated data is performed at runtime using binary instrumentation. The right side of the figure shows the components of the dynamic reorganization framework
components in detail in the following subsections.
3.2.1 Trace Analysis and Pattern Detection
The first step to understand the data usage of applications is tracing the I/O read calls and identifying patterns. Motivated by existing work[40, 77, 90], we characterize data usage patterns in accessing a particular dataset, by focusing on three major aspects: (1) variables within a dataset being accessed, (2) accessed region (one or more sub-planes or whole plane, one or more sub-volume or whole volume, scattered points) of variables, and (3) the size of the requests.
To identify different patterns induced by element and hyperslab selection, our framework first checks the selection type and then records the data selection information during runtime. This information is then used for selecting high performant layout (Section 3.2.2) and creating new replica in offline layout management (Section 3.2.4).
Bounding Box Selection
Many analysis applications read data from a variable that is bounded by spatial locations defined by multi-dimensional array coordinates. As categorized by Lofstead et al.[51], in a 2D array, this bounding box region is referred as sub-plane or a whole plane and in a 3D dataset, the region is called sub-cube. In HDF5, the bounding box selections are calledhyperslabs.
A HDF5 hyperslab selection can be regarded as a complex bounding box selection. It allows users to select multiple bounding boxes with arbitrary regions using set operations (e.g. intersection, union, etc.). Such flexibility simplifies users effort to read their interested data regions in one read function call. Dealing with complex definitions of hyperslab challenges the existing work (such as [40, 82, 90]), which deals with one bounding box selection at a time. One such example is when accessing a labeled dataset, where the data is partitioned into chunks and each chunk has a different label. The data of one label is scattered in a file and is determined by an auxiliary index (See Section 3.3.5 for more details).
Element Selection
Element selection is commonly used when a query library is involved, where the coordinates of typically scattered elements are given and the corresponding data need to be read from file. The coordinates can often be obtained fast with indexing techniques such as FastBit[85]and ISABELA-QA[45]. However, reading the data often results in extremely low I/O throughput due to the large number of non-contiguous reads with small request sizes. The capability to optimize for such patterns would bring huge read performance improvements and thus motivates us to explore the methods for such optimization.
3.2. METHOD CHAPTER 3. UNIFORM GRID DATA LAYOUT OPTIMIZATION
Type Eligibility
Request Replica Request Replica
or No
Request
Replica or or
Request
Replica
Replica
Request Yes
Figure 3.3: The eligibility for a replica to be a candidate is determined by how much overlap it has with the read request. A replica is not eligible with no or partial overlap region while eligible in other cases
of data in file, and storing their original offsets, a large amount of time can be saved when future accesses include these elements. More details about the “clustering” part will be elaborated in Section 3.2.4.
3.2.2 Layout Decision Making
The layout decision maker uses the pattern information recorded in the detection process and attempts to find the best matching replicas. The layout decision making process consists of two main steps:
Step 1: Candidate Selection
The layouts that cannot satisfy the request are first pruned to avoid the potentially large overhead of iterating through all layouts and loading their metadata. To be I/O efficient, a storage-lightweight catalog containing the start and end offsets for each existing layouts is maintained and used for the first round of coarse-grained pruning. The coarse-grained pruning prevents loading all metadata files. Another round of fine-grained pruning is performed, which loads the rest of metadata (the exact regions of data that a replica contains) of the remaining layouts and compared them with the requested data regions. A candidate set of potential replicas is generated using the following rules shown in Figure 3.3.
of a replica. Accessing the metadata, especially for element selections (mappings to the original dataset), results in a non-negligible I/O cost as the size of metadata grows linearly with the data.
Though it is best when the data of a replica is exactly the same as a request, we found performance improvements using the replica in two cases: 1) when the request region is larger than the replica, splitting the read request to read the entire replica and the rest is still beneficial especially when the overlapping region is relatively large (see § 3.3.2); and 2) when the replica contains more data than the request, using the replica results in more contiguous accesses than using the original dataset and is expected to provide better read performance before a specific replica for that pattern is created.
Step 2: Layout Ranking Via Cost Model
The candidate replicas are ranked and the final decision is made via our page-level cost model. Inspired by the previous research work from[40, 90], we adopt a similar model with adjustments that better estimate the costs. As opposed to byte-level cost model, we chose to use a page-level cost model as it more accurately reflects the file read cost, especially in cases of element selection. The estimated read timeTr for replicas with different layouts is defined as follows (parameters defined in Table 3.1):
Tr=max{(Np gi ∗Tp g+N i
c h k∗Tc h k)N i
s p| ∀i∈ O }+Tl a t (3.1)
whereO is the set of Object Storage Targets (OSTs). Based on the request and the layout, we “flatten” the requested region into linear space and calculateNp gi andNc h ki within the data stored on each OST. This cost model estimates the total time needed when reading data across multiple OSTs, and assumes each OST offers the same I/O rate as well the network and storage latency.Tp g,Tc h k, and Tl a t are measured at the start of each application runs to reflect the dynamic I/O performance in a shared system. We compare the cost for all eligible replicas and the one with lowestTr is selected.
I/O Redirection in HDF5