ABSTRACT
MELI, CHARLOTTE ABIGAIL. Factors Involved with the Induction and Long-term Management of Diabetic Pigs. (Under the direction of Dr. William L. Flowers).
The main objectives of this study were to examine the best way to adjust daily insulin doses in the management of chronically diabetic pigs and to determine if early changes in glucose immediately after induction of diabetes could be used to predict how well an individual pig will fit the diabetic model. For these studies, the desired glucose range was between 250 and 400 mg/dL. Adjusting daily insulin doses once per day based on the morning glucose levels in conjunction with the pig’s behavior proved to be superior to
Factors Involved in the Induction and Long-term Management of Diabetic Pigs
by
Charlotte Abigail Meli
A thesis submitted to the Graduate Faculty of North Carolina State University
in partial fulfillment of the requirements for the degree of
Master of Science
Animal Science
Raleigh, North Carolina 2014
APPROVED BY:
_______________________________ ______________________________
Dr. William L. Flowers Dr. Scott Whisnant
Committee Chair
ii BIOGRAPHY
Charlotte Meli was born on March 15, 1990 in Winchester, England to Dr. Roger Meli and Penelope Meli. She has a younger brother, Michael. She graduated from Leesville Road High School in Raleigh, North Carolina in 2008.
After graduating from high school, Charlotte attended North Carolina State
iii ACKNOWLEDGEMENTS
I would like to thank Dr. William Flowers for all of his advice and support during my undergraduate and graduate years at North Carolina State University. His vast knowledge and experience has taught me more than I can ever thank him for. When I began working for Dr. Flowers I knew absolutely nothing about pigs as I only had experience with horses, but with his help I have grown to love pigs and have enjoyed every minute I spent working with him. When I began the graduate program I was unsure of whether I would be able to
complete it but with his help and support I realized that I can reach any goal with hard work. I would also like to thank Dr. Scott Whisnant for everything he has taught throughout my graduate career and for serving on my committee. I would like to thank Dr. Shannon Pratt-Phillips for her time spent serving on my committee.
I would also like to extend a special thank you to everyone who helped take care of the pigs throughout my study. It would not have been possible to take care of them twice a day, every day, without help. I would especially like to thank Emily Tosky as she spent almost every morning there with me, even on holidays, and she stayed late on many afternoons to help me mix feed.
My last thanks go to my family and boyfriend. My family has been there for me and been incredibly supportive while I achieved this goal. Without them I would not have been as successful, they always stood behind me and encouraged me when school seemed
iv TABLE OF CONTENTS
LIST OF TABLES ... vii
LIST OF FIGURES ...xi
FACTORS INVOLVED IN THE INDUCTION AND LONG-TERM MANAGEMENT OF DIABETIC PIGS ...1
LITERATURE REVIEW ...2
Introduction ...2
What is Diabetes ...2
The Hormones Involved in Diabetes ...5
Beta Cells ...5
Insulin...6
Glucose...7
Glucagon ...7
Using Pigs as a Model for Human Research...9
Pancreaectomy ...12
Transgenic Model GIPRdn...13
Transgenic Model HNF1A ...15
Transgenic Model INSC94Y ...16
Streptozotocin...17
Nephrectomized Rats ...19
Summary ...20
WORKS CITED ...21
INTRODUCTION ...23
v
Animals ...25
Facilities ...25
General Experimental Procedures...26
Induction of Diabetes ...27
Feeding Program ...28
Body Weights and Metabolic Profiles ...29
Glucose Monitoring and Insulin Treatment ...30
Behavioral Observations ...32
Body Dimension Measurements ...33
Statistical Analyses ...34
Comparison of Diabetes in Boars and Barrows ...34
Comparison of Strategies for Insulin Dosing to Maintain Diabetes ...35
Efficiency of Induction of Diabetes ...36
Behaviors and Body Dimensions in Diabetic Pigs ...37
RESULTS ...39
Comparison of Strategies for Insulin Dosing to Maintain Diabetes ...39
Overall Average Glucose ...39
Insulin Administered ...40
Diabetic Condition Score ...40
Daily Glucose Relative to Target Range Score ...41
Average Daily Weight Gain ...42
Efficiency of Diabetes Induction ...42
vi
DISCUSSION ...46
OVERALL CONCLUSIONS ...56
WORKS CITED ...58
TABLES ...59
FIGURES ...96
APPENDIX ...99
vii LIST OF TABLES
Table 1. Effect of different insulin dosing strategies on daily glucose levels
(mg/dL ± s.e.) in diabetic pigs ... 59 Table 2. Effect of different insulin dosing strategies on variance of daily glucose levels (arbitrary units ± s.e.) in diabetic pigs ...60 Table 3. Effect of different insulin dosing strategies on daily insulin administered (IU/day + s.e.) to diabetic pigs ...61 Table 4. Effect of different insulin dosing strategies on variance in daily insulin administered (arbitrary units/day + s.e.) to diabetic pigs ...62 Table 5. Effect of different insulin dosing strategies on total amount of daily insulin administered (IU + s.e.) to diabetic pigs ...63 Table 6. Effect of different insulin dosing strategies on diabetic condition score (arbitrary units + s.e.) to diabetic pigs ...64 Table 7. Effect of different insulin dosing strategies on variance in diabetic condition scores (arbitrary units + s.e.) of diabetic pigs ...65 Table 8. Effect of different insulin dosing strategies on proportion of days that daily glucose levels were below desired range of 250 mg/dL in diabetic pigs (% + s.e.) ....66 Table 9. Effect of different insulin dosing strategies on proportion of days that daily glucose levels were within desired range of 250 – 400 mg/dL in diabetic pigs
viii Table 15. Effect of different insulin dosing strategies on variance in glucose for days
within the range (arbitrary units + s.e.) in diabetic pigs ...73 Table 16. Effect of different insulin dosing strategies on variation of daily glucose levels when above the range (arbitrary units ± s.e.) in diabetic pigs ...74 Table 17. The mean average daily gain for each group of diabetic pigs compared to the control group (kg/day ± s.e.) ...75 Table 18. Individual pig means were combined from twice daily adjustments and daily adjustments + behavior of how many days the diabetic pigs were below, within or above target range to create diabetic condition score using standard deviation of population (mean ± s.e.)...76 Table 19. The mean change in glucose over the first 24 hours after first streptozotocin dose for the low, medium, and high groups (mg/dL ± s.e.) ...77 Table 20. The mean change in glucose over 24 – 48 hours after first streptozotocin dose for low, medium, and high groups (mg/dL ± s.e.) ...78 Table 21. The mean change in glucose during first 5 days after first streptozotocin dose for low, medium, and high groups (mg/dL ± s.e.) ...79 Table 22. The minimum mean glucose during first 3 days after first streptozotocin dose for low, medium, and high groups (mg/dL ± s.e.) ...80 Table 23. The maximum mean glucose during first 5 days after first streptozotocin dose for low, medium, and high groups (mg/dL ± s.e.) ...81 Table 24. The variation in mean glucose during first 5 days after first streptozotocin dose for low, medium, and high groups (mg/dL ± s.e.) ...82 Table 25. The diabetic condition score compared to the weight of pigs at the
ix Table 29. Relative contributions of initial weight and glucose characteristics during
the first 5 days post STZ treatment to overall variation in diabetic condition scores based on diabetic pigs subsequent daily glucose levels ...87 Table 30. Mean diabetic condition scores for pigs in study 2 assigned to different groups based on the severity of their diabetes (arbitrary units + s.e.). Numbers in parenthesis indicate number of observations used to calculate each mean...88 Table 31. Glucose, insulin and growth characteristics for pigs in study 2 assigned to low, medium, and high diabetic severity groups (mean + s.e.)...89 Table 32. Body dimensions for pigs in study 2 at 20 weeks of age assigned to low, medium, and high diabetic severity groups (mean + s.e.) of low, medium, and high groups ...90 Table 33. Weight and body dimensions for pigs in study 2 at 20 weeks of age
assigned to low, medium, and high diabetic severity groups (mean + s.e.) of low, medium, and high groups ...91 Table 34. Body dimensions for pigs in study 2 at 36 weeks of age assigned to low, medium, and high diabetic severity groups (mean + s.e.) of low, medium, and high groups ...92 Table 35. Weight and body dimensions for pigs in study 2 at 36 weeks of age
x LIST OF FIGURES
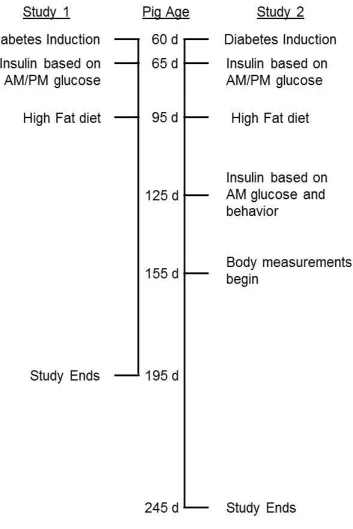
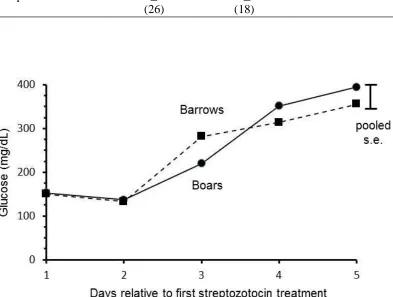
Figure 1. Floor plan for rooms used in both studies………96 Figure 2. Schedule of events relative to pig age for Studies 1 and 2…………..97 Figure 3. The mean fluctuations in glucose of both treatments over time
1 FACTORS INVOLVED WITH THE INDUCTION AND LONG-TERM MANAGEMENT
2 LITERATURE REVIEW
Introduction
Diabetes is an epidemic that is estimated to increase from 346 million people globally to 400 million by the year 2030 (Wolf et al. 2013). Based on this prediction medical research has become vital in order to determine better treatment options and hopefully even a cure. The majority of previous animal research has been conducted with rodents as they are easier to raise and care for. However, over time it has been determined that pigs are
physiologically more similar to humans and therefore have an important role in future diabetes research. Even though pigs already mimic human diseases for translational research, genetic engineering provides the ability to tailor pig models even more closely to humans at a molecular level (Wolf et al. 2013). Pigs have become vital in translational research within the medical field to determine new therapeutic treatments for many different diseases. As the translational research field grows it is important that appropriate animal models are developed that provide the ability to evaluate the safety and efficacy of new drugs as a treatment or a cure for disease epidemics (Aigner et al. 2009).
What is Diabetes?
Diabetes is a well-known disease that is characterized by the inability of the person to regulate their blood glucose levels. Wilmowsky et al. (2010) described diabetes as being “a disturbed regulation of the metabolism that is usually characterized by unorganized
production of insulin or the inability to use insulin”. Due to this disorder affecting the
3 disorder. Generally, diabetes causes an increase in blood glucose levels, polyuria,
polydipsia, and weight loss (Wolf et al. 2013). Over time diabetes begins to cause metabolic decomposition as it damages various parts of the body, this can lead to ketoacidosis and non-ketotic hyperosmolar syndrome (Wolf et al. 2013). This disorder can cause a variety of symptoms that many people may ignore as they are not overt or painful symptoms. The American Diabetes Association (2013) lists the symptoms as feeling hungry, extreme fatigue, blurry vision, cuts and bruises that are slow to heal and tingling, pain, and numbness in the hands and feet due to nerve degeneration. One complicating factor of this disorder is that it does not simply affect people of a certain age range. Instead, there are many different types of diabetes that can affect almost anyone. Type I diabetes affects only 5-10% of people who develop a form of diabetes (Wolf et al 2013). Type I diabetes usually affects young children hence it is also known as Juvenile Diabetes, and is characterized by an autoimmune
destruction of pancreatic beta cells (Wolf et al. 2013). The most common form of diabetes is Type II which affects 90-95% of the population; therefore, the vast majority of those affected by diabetes develop Type II (Wolf et al. 2013). This form of diabetes is characterized by a development of insulin resistance or inadequate insulin secretion generally during adulthood (Wolf et al. 2013). Insulin resistance is generally characterized as the failure of the
5 gestational diabetes tend to give birth to large babies. There are many different forms of diabetes affecting a wide variety of people causing this disorder to have become an epidemic. Since so many people are suffering from this disorder it is of vital importance to develop new and improved treatments to improve and lengthen the lives of those affected. Not only do those diagnosed with diabetes suffer from high blood sugar levels and insulin resistance, but they are also predisposed to cardiovascular disease, diabetic retinopathy, nephropathy, and neuropathy (Wolf et al. 2013). A combination of any of these long term complications can lead to multiple organ failure and is the leading cause of death in those diagnosed with diabetes (Wolf et al. 2013).
The Hormones Involved in Diabetes:
Beta Cells
Diabetes is a complicated disease as many different hormones are involved in the negative feedback loop that controls blood sugar within the body. One of these main
hormones, insulin, is released from the beta cells that make up the Islets of Langerhans. The beta cells are contained in a complete intact islet as these are more efficient than isolated beta cells. The islet responds to the rise in glucose within the body by the combination of
6 much quicker speed than those located in the center of an islet (Meda and Schuit 2013). This concept allows the beta cells to work together to help regulate the blood glucose within the body as rapid changes are not good. Each beta cell has a different purpose when it comes to metabolizing glucose, producing insulin and releasing insulin; therefore, it is vital that the beta cells work together during every glucose stimulation (Meda and Schuit 2013). The pancreatic beta cells respond to a rise in blood glucose because the sugar has the ability to cross through the transport proteins into the cytoplasm due to facilitated diffusion (Meda and Schuit 2013). This movement of sugar through the cell wall causes the cells potassium channels to close, allowing calcium to move into the cell; therefore causing the appropriate amount of insulin secretion to decrease the blood glucose level (Meda and Schuit 2013).
Insulin
7 insulin differently and based on their own diet can require a variety of different types of insulin injections. There are 4 main types of insulin: rapid acting which can work within 15 minutes but only lasts a couple hours, short acting that works within 30 minutes and lasts 3-6 hours, intermediate acting works within 2-4 hours and is effective for 12-18 hours, and finally long acting that reaches the bloodstream within several hours and lowers glucose evenly over 24 hours (American Diabetes Association 2013). It is important to understand how quickly and for how long each insulin injection lasts as it is vital not to give a rapid acting insulin injection when you will not eat for a long period of time as your blood sugar can drop too low. It is difficult to use insulin injections as the only way to regulate blood sugar as the natural insulin secretion does not take place simultaneously from each beta cell (Meda and Schuit 2013).
Glucose
The negative feedback cycle that controls the blood sugar level in the blood does not only involve insulin, it also involves glucose. The feedback cycle is initiated by a rise in blood glucose, followed by an increase in insulin secretion and within minutes there is an increase in glucose transport, metabolism, and the storage of muscle and adipocytes
8 surface now allows facilitated diffusion of circulating glucose down the concentration
gradient (Bryant et al. 2002). Since GLUT-4 is the main insulin-responsive glucose transporter, in patients with diabetes this is the rate limiting step for glucose metabolism within muscle cells (Shepherd and Kahn 1999). In the intestines and the kidneys glucose is actively transported via sodium linked glucose transporters, since this is active transport it occurs against the concentration gradient by using sodium as a cotransporter (Shepherd and Kahn 1999). For a healthy individual the blood glucose level should be between 90-130 mg/dL before a meal and less than 180 mg/dL after a meal. When someone is diabetic it is important for them to regularly check their blood glucose using a blood glucose monitor. If the blood glucose is too high they are considered to suffer from hyperglycemia.
Hyperglycemia can be caused by too little insulin in the case of type I or no longer
responding to insulin which corresponds to type II (American Diabetes Association 2013). When checking an individual for diabetes high levels of sugar will be found in the urine and they will suffer from increased thirst and urination (American Diabetes Association 2013). Hypoglycemia is when blood sugar drops to below 70 mg/dL which is often referred to as insulin shock (American Diabetes Association 2013). When someone goes into insulin shock it will happen quickly and they will have symptoms of lightheadedness and sleepiness and will eventually fall into a coma (American Diabetes Association 2013).
Glucagon
9 amino acid peptide (Drucker and Safina 2009). Glucagon simply stimulates the release of glucose that is stored within the liver into the bloodstream when blood glucose drops too low (American Diabetes Association 2013). Glucagon is released into the bloodstream from the alpha cells located within the islets of Langerhans in the pancreas. The presence of glucose in the bloodstream can directly inhibit glucagon secretion, along with insulin, zinc, and gamma-aminobutyric acid release (Drucker and Safina 2009). When the body has low glucose levels the ATP-sensitive K+ channel within the brain and the pancreatic alpha cells are activated (Drucker and Safina 2009). Once this occurs, an action potential is generated of sodium and calcium currents causing the release of glucagon (Drucker and Safina 2009). This release of glucagon stimulated the conversion of the glycogen stored in the liver into glucose which can then be released into the bloodstream; this process is known as
glycogenolysis (Society of Endocrinology). This release of glucagon is often stimulated by protein rich meals (Society of Endocrinology). In patients with Type II Diabetes, glucagon has been shown to have a role in the hyperglycemia that is seen (Drucker and Safina 2009). Therefore, researchers are interested in developing drugs that inhibit glucagon secretion aiding the in decrease in blood glucose (Drucker and Safina 2009).
Using Pigs as a Model for Human Research
11 predominantly within the brain (Wang et al. 1997). Within the brain, this gene is responsible for mediating the neuronal uptake of monoamines into the vesicles within the cell (Nirenberg et al. 1997). Along with the anatomical and physiological similarities another important benefit of using pigs for translational research is their size and body weight. The large size and heavy body weight allow for the use of standard diagnostic equipment and surgical techniques of human medicine for research purposes (Wolf et al. 2013). Pigs are also beneficial for biomedical research because they reach sexual maturity at an early age, have a short generation time and have multiple offspring, this allows for researchers to be able to raise and replace a herd quickly (Wolf et al. 2013). A lot of research with pigs for
biomedical research requires precise genetic modification to ensure they model disease symptoms and progression in its entirety; therefore, genetic modification has been the focus of much research and is now very efficient in pigs (Wolf et al. 2013). One disadvantage to research with pigs is the housing requirement and labor needed compared to housing rodents. As the biomedical research field grows the housing environment, feeding, and hygiene
12 Pancreatectomy
13 until it was at a normal level, in comparison to pigs that had not had their pancreas removed (Kobayashi et al. 2004). It was quickly determined that this method may not be successful enough for modeling diabetes accurately as their blood glucose did not remain high enough. Along with this disadvantage it is also essential that any pigs that have their pancreas
removed must be given supplemental gastric enzymes, a gastric feeding tube, and possibly a bioartificial pancreas that has the ability to produce some insulin (Kobayashi et al. 2004). By having to provide so much supplementation in order to maintain the pigs long term it does not make them a very viable model for diabetes.
Transgenic Model GIPRdn
14 they enhance the release of insulin (Society of Endocrinology). In those with type II diabetes it is apparent that there is a decrease in pancreatic response to GIP but not GLP-1; therefore, this contributes to the decrease in efficient insulin release in the pancreas (Lynn et al. 2001). In order to develop this model the pigs are born with a desensitization of the
glucose-dependent insulinotropic polypeptide (GIP) and glucagon-like peptide-1 (GLP-1) which are secreted by enteroendocrine cells causing the incretin effect (Wolf et al. 2013). These piglets are born with this response and they also have a lower amount of beta cell levels in their pancreas (Wolf et al. 2013). Over time, the level of beta cells in the pancreas did decrease which could possibly be due to the lack of blunted insulinotropic action of GIP (Wolf et al. 2013). Since these pigs so accurately match patients with prediabetes before they develop type II there is a lot of potential for future research with these transgenic pigs. These pigs have the same response to oral glucose compared to intravenous glucose as adult patients with type II diabetes (Wolf et al. 2013). In this phenomenon called the incretin effect giving oral glucose gives a higher insulin response than giving IV glucose; however, in patients with type II diabetes there is not as great of an insulin response to oral glucose as in people
15 as controversial due to rodents having beta cell proliferation (Wolf et al. 2013). Another line of research made possible by these transgenic pigs is the ability to study whether these GLP-1 receptor agonists can prevent beta cell apoptosis during the prediabetic condition and determine whether these pigs still develop clinical diabetes (Wolf et al. 2013). Overall, these transgenic pigs model important aspects of type II diabetes such as reduced GIP action, the incretin effect, and reduced pancreatic beta cell mas; therefore, this model can potentially show the role GIP plays in beta cell expansion and apoptosis (Aigner et al. 2009).
Transgenic Model HNF1A
The second transgenic pig model for diabetes that has been developed is called the HNF1A. This transgenic pig model has an autosomal dominant mutation in the hepatocyte nuclear factor 1-α gene which causes irregularities with insulin secretion and glucose
homeostasis (Aigner et al. 2009). The main goal of this particular transgenic pig is to model mature onset diabetes of the young or type III diabetes (Aigner et al. 2009). Pigs that have been genetically modified to carry this gene generally have a non-fasting glucose of over 200 mg/dL (Wolf et al. 2013). Along with a high glucose level they also are born with abnormal pancreatic islet formation, immature renal development, pathological alterations of the kidney, and liver alterations (Wolf et al. 2013). However, these pigs have not been able to survive for a long period of time so further research is needed to produce a more successful model with this mutation (Wolf et al. 2013). After the animals died a necropsy was
16 glomerular hypertrophy and sclerosis; however, it is undetermined whether this degeneration was due to the diabetic condition or the toxic effect of the HNF-1α (Wolf et al. 2013). During the necropsy the researchers were able to detect the transgenic protein in the pancreas, heart, and kidney (Wolf et al. 2013). This transgenic pig model holds a lot of possibilities for future research in the development and progression of mature onset diabetes of the young.
Transgenic Model INSC94Y
The final transgenic pig model that has been developed to model diabetes is called the INSC94Y. This particular diabetic model is diagnosed with permanent diabetes when they are less than a year old; generally they are diagnosed shortly after birth (Wolf et al. 2013). These pigs were produced by using the control of the porcine INS promoter, this particular
promoter is used due to 20 mutations having already been found in the human INS gene that contribute to diabetes mellitus (Wolf et al. 2013). Due to a change in the porcine INS promoter these pigs are extremely hyperglycemic after birth; however, their pancreatic beta cell mass was unaltered which means they simply do not produce enough insulin (Wolf et al. 2013). One disadvantage of the INSC94Y was all of their organs were underweight, except for the kidney which was heavier than normal (Wolf et al. 2013). Another disadvantage
17 superior to chemical induction of diabetes with streptozotocin or a pancreatectomy (Wolf et al. 2013).
Streptozotocin
The final method used to develop a pig model for diabetes involves the use of
18 used in pigs (Wilmowsky et al. 2010). At the beginning of the study glucose levels were checked every morning before their meal to ensure a fasting glucose reading; however, later in the study they were only checked approximately twice a week (Wilmowsky et al. 2010). The average blood glucose level recorded was around 337.1 mg/dL for the pigs considered diabetic and remained approximately 70 mg/dL for healthy pigs (Wilmowsky et al. 2010). Even when the pigs were not administered daily insulin, the pigs that required insulin did not experience a reversal in their diabetic condition (Wilmowsky et al. 2010). The researcher s also decided to perform an Intravenous Glucose Tolerance test (IvGTT) to see how effective the STZ was at creating a diabetic condition. The IvGTT test involves the rapid
19 fulfilled the requirements to model type II diabetes. The only noticeable disadvantage with the STZ diabetic pigs was near the end of the study blood glucose levels began to decrease, which was most likely due to the STZ not damaging all of the beta cells within the pancreas (Wilmowsky et al. 2010). Overall, these animals are considered to be extremely benefici al for long term scientific research as they do not pose any problems for long term maintenance because a lack of insulin administration does not cause any metabolic fluctuations
(Wilmowsky et al. 2010).
Nephrectomized Rats
One main concern of diabetes is the development of renal complications due to the degenerative effect of diabetes on the kidneys. Glomerular injury associated with diabetes was first discovered around 1936 and even with current research end stage renal failure is still unavoidable (Lopes et al. 2004). Since this is a common and life threatening
20 glomerular alterations (Lopes et al. 2004). This observation suggests that renal mass affected by diabetes does lead to hyperfiltration (Lopes et al. 2004). Not only was hyperfiltration present, but the renal nephropathy was also characterized by glomerular hypertrophy, thickness of the glomerular capillary membrane, and mesangial expansion (Lopes et al. 2004). As more research is focused on nephrectomized rats the goal is to develop ways to slow the diabetic renal degradation or to prevent the damage before it begins.
Summary
21 WORKS CITED
Aigner, Bernhard, Simone Renner, Barbara Kessler, Nikolai Klymiuk, Mayuko Kurome, Annegret Wunsch, and Eckhard Wolf. Transgenic pigs as models for translational biomedical research. Molecular Medicine. (2010): 653-664.
Amatuzio, Donald, Stutzman, FL, Vanderbilt, MJ, Nesbitt, S. Interpretation of the rapid IV glucose tolerance test in normal individuals and in mild diabetes mellitus. J Clin Invest. (1953), 32 (5): 428-435.
American Diabetes Association (2013) Diabetes basics and living with diabetes.
Bryant, NJ, Govers, R, James, DE. Regulated transport of the glucose transporter GLUT-4. Nature Reviews Molecular Cell Biology. (2002), 3 (4): 267-277.
Gremlich, Sandrine, Porret, Andree, Hani, El Habib, Cherif, Dorra, Vionnet, Nathalie, Froguel, Philippe, Thorens, Bernard. Cloning, functional expression, and chromosomal localization of the human pancreatic islet glucose-dependent insulinotropic polypeptide receptor. Diabetes. (1995), 44 (10): 1202-1208.
Kobayashi, K., Kobayashi, N., Okitsu, T., Yong, C., Fukazawa, T., Ikeda, H., Kosaka, Y., Narushima, M., Arata, T. and Tanaka, N. Development of a Porcine Model of Type 1 Diabetes by Total Pancreatectomy and Establishment of a Glucose Tolerance Evaluation Method. Artificial Organs. (2004), 28 (11): 1035–1042.
Lopes, G S et al. Effect of unilateral nephrectomy on renal function of diabetic rats. Histology and Histopathology. (2004), 19 (4), p. 1085.
Lynn, Francis, Pamir, N, EH, Ng, McIntosh, CH, Kieffer, TJ, Pederson, RA. Defective glucose-dependent insulinotropic polypeptide receptor expression in diabetic fatty zucker rats. Diabetes. (2001), 50 (5): 1004-1011.
Meda, P., & Schuit, F. Glucose-stimulated insulin secretion: the heirarchy of its multiple cellular and subcellular mechanisms. Diabetologia. (2013), 56 (12): 2552-2555.
Nirenberg, Melissa, Chan, J, Liu, Edwards, RH, Pickel, VM. Vesicular monoamine
transporter 2: immunogold localization in striatal axons and terminals. Synapse. (1997), 26 (2): 194-198.
22 Reaven, Gerald. Role of insulin resistance in human disease. Diabetes. (1988), 37 (12): 1595-1607.
Safina, Ali, Drucker, Daniel. Benefits and limitations of reducing glucagon action for the treatment of type 2 diabetes. American Journal of Physiology. (2009), 296 (3): 415-421. Shepherd, Peter, Kahn, Barbara. Glucose transporters and insulin action – implications for insulin resistance and diabetes mellitus. The New England Journal of Medicine. (1999), 341 (4): 248-257.
Szkudelski, T. The Mechanism of Alloxan and Streptozotocin Action in the B Cells of the Rat Pancreas. Physiological Research. (2001), 50 (6): 536-546.
Von Wilmowsky, C., Stockmann, P., Metzler, P., Harsch, I. A., Amann, K. and Schlegel, K. A. Establishment of a streptozotocin-induced diabetic domestic pig model and a systematic evaluation of pathological changes in the hard and soft tissue over a 12-month period. Clinical Oral Implants Research. (2010), 21 (7): 709–717.
Wang, Yan-Min, Gainetdinov, RR, Fumagalli, F, Xu, F, Jones, SR, Bock, CB, Miller, GW, Wightman, RM, Caron, MG. Knockout of the vesicular monoamine transporter 2 gene results in neonatal death and supersensitivity to cocaine and amphetamine. Neuron. (1997), 19 (6): 1285-1296.
Wolf, Eckhard, Christina Braun-Reichhart, Elisabeth Streckel, and Simone Renner.
Genetically engineered pig models for diabetes research. Transgenic Research. (2013), 23 (1): 27-38.
23 INTRODUCTION
Diabetes is a growing epidemic as is believed to increase from 346 million affected to over 400 million over the next few years (Wolf et al. 2013). As with any chronic disease it is important for research efforts to continue in order for new drugs and treatments to be
developed. In the past rodents have been used as the primary model for many different diseases, especially diabetes. However, the use of pigs is growing in the field of biomedical research as they are physiologically similar to humans and can even be genetically
engineered to resemble humans even more closely (Aigner et al. 2009). As Aigner et al. (2009) states “appropriate animal models for the evaluation of efficacy and safety of new drugs or therapeutic concepts are critical for the success of translational research”.
Pigs are being used more frequently in diabetic research because of the many similarities of their pancreas and endocrine system to that of humans. Although rodent models have been used for this purpose for many years it is important for large animal models to bridge the gap between rodents and humans (Wolf et al. 2013). Humans and pigs are similar in pancreatic size, shape, position, and even blood supply (Wolf et al. 2013). However, the cost, labor, and facilities need to house pigs are higher than that of rodent models so pigs are primarily used in research for disease areas where rodent models are not adequate (Aigner et al. 2009).
24 desired range for blood glucose concentrations for diabetic pigs was between 250 and 400 mg/dL. Blood glucose levels above this range can result in detrimental health effects; therefore, it is important to determine the best way to balance high blood sugar and keeping the pigs alive and healthy. If a particular method proves to be extremely beneficial, then this would facilitate use of the diabetic pig model in long-term studies.
25 MATERIALS AND METHODS
Animals
Two studies were conducted in the Swine Nutrition Research Complex at the North Carolina State University Swine Educational Unit located at 3901 Inwood Road, Raleigh, N.C. The first study was conducted from April to October, 2011 and used 24 boars. The second study was conducted between April, 2012 and January, 2013 and used 32 barrows. All pigs used in both studies were half siblings and were produced by breeding Yorkshire x Landrace x Large White sows to the same Duroc x Hampshire x Pietran boar.
Facilities
26 consisted of a series of galvanized metal strips that were 2 cm wide with 1.2 cm of open space in between each strip (TriBar®). Pens were equipped with a nipple waterer and a stainless steel feeder with a 0.45 x 0.30 x 0.20 bowl and a curved bottom. The feeders were located at the front of the pens and adjacent to the central alley way of each room. The waterers were located at the rear of the pens on the gate opposite to those with the feeders. Pen design and materials including the flooring, waterers and feeders were provided by Hog Slats, Inc. (Newton Grove, NC).
All pigs in both studies were housed in a single room in individual pens that were 0.91 x 1.82 m when they were between 25 and 68 kg. Each pen had one feeder and l nipple waterer. Once pigs reached 68 kg they were housed individually in two separate rooms in pens that were 1.82 by 1.82 m. Each of these pens had 1 feeder and 2 nipple waterers. A floor plan is shown for each pen arrangement in Figure 1.
General Experimental Procedures
27 At 3 weeks post infusion all the diabetic pigs and one-half of their non-diabetic
contemporaries (n=2 for study 1 and n=4 for study 2) were transitioned onto a high fat diet (5% added beef tallow) over a 2 week period. At 5 weeks post infusion, diabetic pigs within each study (n=16 in the first study and n=20 in the second study) were randomly assigned to receive weekly injections of a proprietary experimental treatment (Vascular Pharmaceuticals, Inc., Chapel Hill, NC) designed to reverse and prevent plaque formation in arteries and other vascular changes commonly observed when high fat diets are consumed in conjunction with a diabetic physiology (Griggs et al., 1986). The proprietary experimental treatment was designed to prevent cardiovascular changes that result from chronic exposure to high glucose levels and did not influence the diabetic physiology. Pigs were maintained on their respective diets, insulin regimens, and treatments for 107 + 3 and 207 + 4 days in the first and second study, respectively.
Induction of Diabetes
Diabetes was induced via intravenous infusions of 50 mg /kg body weight of streptozotocin (Zanosar; Teva Parental Medicines, Inc., Irvine, CA) according to the
28 drawn through the infusion set into an empty syringe. The syringe containing the STZ was then attached and a small amount of blood was pulled into the STZ in order to verify the correct location in the needle. One half of the STZ volume was administered slowly into the vein at which point the location of the needle was verified a second time as described
previously and the rest of the STZ was injected. An equal volume of physiological saline was used to flush the infusion set after all the STZ was administered. The infusion set was then removed and gentle pressure was placed over the injection site. The entire process typically took less than 1 minute from the time the pig was placed into and removed from the V-trough. The total volume of STZ infused varied between 7 and 20 mL depending on the size of the pig. Infusion sites were switched daily - if a vein on the right side was infused on the first day, then one on the left was infused the next day and so forth.
Each pig was infused twice over consecutive days with STZ. Some pigs received a third day of STZ depending on their glucose levels 10 and 12 hours after the second infusion. In general, if glucose was less than 250 mg/dL, then a third dose was administered. In both studies, induction of diabetes took place over a 4-week period with 5 and 6 pigs, respectively, being infused each week. During the week for diabetes induction each pig was chosen
randomly before the first pig was infused.
Feeding Program
29 composed of mainly of corn and soybean meal. It contained 15% crude protein and was formulated to meet or exceed all nutritional requirements for growing pigs (NRC, 1998). All pigs received this feed for the first three weeks after the induction of diabetes. During the next two weeks the amount of beef tallow was gradually increased, so that by 5 weeks pigs were consuming the basal diet with 5% added beef tallow. In order to compensate for the slight reduction in the nutrient composition caused by the addition of tallow, pigs were fed an additional 0.23 kg of feed in the morning which raised their AM feeding level to 1.81 kg. Pigs were between 91 and 105 days of age at this time and estimated daily intakes of all nutrients still met or exceeded NRC recommendations. Non-diabetic pigs in the first (n=2) and second (n=4) study, respectively, were not switched to the high fat diet and remained on the basal diet for the duration of their respective studies.
Body Weights and Metabolic Profiles
In both studies, body weights were recorded weekly for all pigs. In addition, blood samples were obtained monthly via jugular venipuncture from all pigs for determination of their complete metabolic profile. Appropriate samples (plasma, serum, etc.) were obtained; frozen; and then sent to the UNC School of Medicine Metabolism Laboratory (Chapel Hill, NC) for subsequent analyses. Standard and validated analytical procedures according to GLP guideline for Clinical Studies were used for all the metabolic assays (World Health
30 Glucose Monitoring and Insulin Treatments
Glucose was monitored by pricking a marginal ear vein with a 0.63 cm, 25 gauge lancet. The drop of blood originating from this small wound was sampled with a glucometer (Precision Xtra and glucose test strips; Abbott Laboratories, Abbott Park, IL). During the first study, glucose in the diabetic pigs was monitored twice per day at 0600 and 1400. During the second study, glucose in the diabetic pigs was monitored twice per day for the first 65 days and then once per day at 0600 thereafter. During both studies, glucose was monitored once per week in the non-diabetic pigs at 0600 on a Monday or Tuesday. All pigs including the non-diabetic controls were trained to have their ears pricked by allowing them to lick a small amount of strawberry-flavored syrup (Food Lion, Salisbury, NC) placed on the boots of the person obtaining the sample. The glucometers used in both studies reported actual blood glucose levels between 0 and 500 mg/dL. When readings above 500 mg/dL occurred the glucometers reported them as “HIGH”. Consequently, whenever a “HIGH”
31 1) – If the pig’s glucose reading was below 350 mg/dL, then no insulin was given.
2) – If the pig’s glucose reading was above 350 mg/dL, then a dose of 5 IU was given. a) If the subsequent glucose level remained within the desired range, then the dose of
5 IU was continued.
b) If the subsequent glucose level increased above 400 mg/dL, then the insulin dose was increased in increments of 5 IU until glucose returned to levels within the desired range.
c) If the subsequent glucose level decreased below the desired range, then the insulin dose was decreased by 2 IU until glucose levels returned to within the desired range.
3) – If the pig’s glucose reading was above 400 mg/dL, then a dose of 10 IU was given. a) If the subsequent glucose level returned to within the desired range, then the dose
of 10 IU was continued.
b) If the subsequent glucose level remained above 400 mg/dL, then the insulin dose was increased in increments of 10 IU until glucose returned to levels within the desired range.
c) If the subsequent glucose level decreased below the desired range, then the insulin dose was decreased by 4 IU until glucose levels returned to within the desired range.
During the first study, AM glucose levels were used to determine AM insulin doses and the PM glucose levels were used to determine the PM insulin doses throughout the entire study. In the second study, after the first 65 days, both the AM and PM insulin doses were based on each AM glucose levels and adjusted further slightly based on the pig’s behavior as
32 Behavioral Observations
During the second study, daily behavioral observations were made on each pig. Pigs were evaluated just prior to and during their morning feeding sessions and given a score of 1 to 3 for three separate behaviors based on the following criteria:
General Activity – This behavior was based on how pigs reacted when technicians first enter the
room in morning.
3 – Pig acknowledges presence of the person. If pig is sitting or lying down, then he may stand up and make vocalizations directed at the person. The pig is alert and active in its pen.
2 – Pig is alert and acknowledges person, but doesn’t change his position or vocalize. 1 – Pig is lying down on side and doesn’t acknowledge presence of the person.
Sampling Activity – This behavior was based on how the pigs reacted while their ears were being pricked to get the blood sample for glucose monitoring.
3 – Pig gets up and moves around. He tries to lick boots; runs away when pricked; or shakes head.
2 – Pig doesn’t move around much or remains lying down when licking syrup off boots. However, he doesn’t really like to have ear pricked and shakes his head or tries to hide his ears.
1 – Pig is lying down the entire time and doesn’t resist when ear is pricked.
33 3 – Pig waits impatiently for feed (vocalizes and/or tries to climb up on the front gate by the
feeder). He goes to feeder immediately when fed and eats continuously until feed is gone. 2 – Pig waits for feed by feeder but doesn’t vocalize or try to climb up on front gate. He goes
to feeder initially and begins to eat, but only eats a portion of his feed.
1 – Pig doesn’t seem to be interested in eating. He doesn’t go to feeder or goes and only eats a few mouthfuls of feed.
In the second study, 65 days after diabetes was induced (125 days of age) behaviors were used in conjunction with morning glucose levels to determine AM and PM insulin doses. In general, pigs that received a behavior score of 1 in any of the categories were given an additional 5 IU of insulin regardless of their AM glucose levels. This continued daily until their behavior score increased.
Body Dimension Measurements
Body dimension measurements of each pig’s mid-section were taken every 4 to 5
34 Statistical Analyses
Evaluation of factors associated with the induction and maintenance of chronic diabetes in pigs was the primary focus of this thesis. Due to procedural differences between the two studies (Figure 2), four different analyses were conducted. All statistical analyses were conducted using analysis of various procedures for mixed models (Proc Mixed) or multiple regression techniques (Proc Reg) using version 9.4 of SAS (SAS, Inc., Cary, NC).
Comparison of Diabetes in Boars and Barrows
To determine whether there were any differences between boars and barrows in the induction and maintenance of diabetes, data from the first 5 days prior to insulin
administration and between days 6 and 65 post STZ (66 to 125 days of age) were used (Figure 2). The latter was the period in both studies during which insulin regimens were adjusted based on both AM and PM glucose readings. For the induction of diabetes, analysis of variance for repeated measures using mixed models procedures was used to determine the main effects of time; study (boars versus barrows); and number of STZ doses (2 versus >3) on glucose concentrations during the first 5 days after initiation of STZ treatments. The statistical model consisted of sampling time, study, number of STZ doses, and all two- and three-way interactions. Pig nested within each combination of study and STZ dose was considered a random effect and used to test for main effects of study (boar versus barrows); STZ dose; and their interaction.
35 variance in daily glucose (arbitrary units); daily insulin administered (IU); variance in daily insulin administered (arbitrary units); total insulin administered during the entire period (IU); percentage of days daily glucose was below (< 250 mg/dL), within (250 to 400 mg/dL0, and above (> 400 mg/dL) the target range; mean and variance in glucose for all days it was below, within, and above the target range; and the diabetic condition score. The diabetic condition score was calculated by assigning numerical values of 1, 2 or 3 to each glucose sample that was below, within, or above the desired range of 250 to 400 mg/dL. These individual means were then analyzed with analysis of variance for a factorial arrangement of treatments using mixed model procedures. The statistical model for this analysis consisted of study (boars versus barrows); number of STZ doses (2 versus >3); and their interaction.
Results from these analyses are shown in Appendix A. There were no differences in glucose or insulin characteristics between boars and barrows or due to the number of doses of STZ used to induce diabetes (p > 0.14). Consequently, using data from the two different studies (Figure 2) for comparison of the two strategies for determining daily insulin dosing described subsequently was considered valid statistically.
Comparison of Strategies for Insulin Dosing to Maintain Diabetes
36 levels and the behavior scores (AM+Activity) . In addition, daily mean glucose values and their corresponding variance for each of the non-diabetic pigs were determined from the weekly samples collected over the same time period. Analysis of variance procedures for mixed models were used to determine effects of the two diabetic maintenance strategies on the same dependent variables described previously and average daily gain of the pigs during this 70-day period. For average daily gain, mean glucose and its associated variance the statistical model included two levels for the main effect of maintenance strategy (AM+PM and AM+Activity) while the non-diabetic pigs served as untreated controls. When a
significant effect of maintenance strategy was observed the Student-Newman-Keuls multiple range test (Snedecor and Cochran, 1989) was used to determine differences among the two different approaches and the non-daibetic controls. For all other dependent variables a similar statistical model was used with the exception that there were only two levels of maintenance strategies, AM+PM and AM+Activity. Body weight of the pigs at the beginning of the 70-day period was used as a covariate in both analyses.
Efficiency of Induction of Diabetes
37 subdivide pigs in each study into three groups based on their individual mean diabetic score as follows:
Low pigs had means greater that one standard deviation below the study mean (< mean – s.d.);
Medium pigs had means within one standard deviation of the study mean (mean + s.d.; and High pigs had means greater than one standard deviation above the mean (> mean + s.d.).
Analysis of variance procedures for mixed models were used to determine whether there were differences in glucose characteristics during the first 5 days after the first day of STZ treatment and the diabetic score groups (Low, Medium, and High). Dependent variables included the following: weight of pigs prior to first treatment; change in glucose during the first 24 h; change in glucose between 24 and 48 h; and mean, maximum, minimum, and variance in glucose during the first 5 days after the first STZ treatment. When a significant effect of diabetic score group was observed the Student-Newman-Keuls multiple range test (Snedecor and Cochran, 1989) was used to determine differences.
Multiple regression analyses were also performed in order to determine the relative contribution of the dependent variables listed previously to the overall variation observed in the diabetic score. Data were pooled across both studies for this analysis.
Behaviors and Body Dimensions in Diabetic Pigs
39 RESULTS
Comparison of Strategies for Insulin Dosing to Maintain Diabetes
Effects of the two different strategies for determining daily insulin doses on dependent variables associated with maintenance of the desired diabetic physiology are shown in Tables 1 through 18. The strategy that involved using both the morning and afternoon glucose levels of each pig to determine the appropriate insulin doses will be referred to as AM+PM. The strategy that involved using only the morning glucose levels and each pig’s behavioral responses during the morning sampling and feeding to determine the
appropriate insulin doses will be referred to as AM+Activity.
Overall Average Glucose
The average glucose mean was determined for the three different groups: AM+PM, AM+Activity, and the non-diabetic control group (Table 1). The mean glucose readings for
40 Insulin Administered
The amount of insulin administered for AM+PM was twice that of AM+Activity (10.5 ± 1.5 versus 5.3 ± 1.4; p = 0.017; Table 3) and more variable (60.5 ± 11.7 versus 19.2 ± 5.5; p = 0.0016; Table 4). This resulted in approximately 250% more insulin being used in the AM+PM strategy (8637.9 ± 2589.6) compared with the AM+Activity regimen (3090.1 ± 785.2; p = 0.0326; Table 5).
Diabetic Condition Score
The glucose levels for the diabetic pigs were considered to be within the target range if they were from 250 – 400 mg/dL. As mentioned previously, daily glucose levels below, within, and above this range were assigned a score of 1, 2, and 3, respectively. Therefore, the
41 Daily Glucose relative to the Target Range
Pigs dosed with the AM+PM regimen spent about 33% fewer days with glucose levels below (12.8 ± 3.2%) and about 50% more days with glucose levels above (60.4 + 4.7%) the desired range compared with their counterparts under the AM+Activity regimen (39.3 + 6.3%, p = 0.0011, Table 8; 26.5 + 2.6%, p < 0.0001, Table 10). The proportion of days with glucose levels within the desired range was not different (p = 0.1495) between the two insulin dosing strategies (Table 8). For the days that glucose was below the desired range of 250 to 400 mg/dL mean concentrations were not different (p = 0.6671; Table 11) among treatments, but varied to a greater extent (p = 0.0231; Table 14) in AM+PM than
AM+Activity pigs. In contrast, when glucose was within the desired range, levels were higher (p < 0.0001; Table 12) in AM+PM than AM+Activity pigs, but their variances were not different (p = 0.4486; Table 15). Finally, for the days during which glucose was greater than the desired range, mean levels tended to be higher (p = 0.0671; Table 13) and exhibited greater variation (p = 0.0267; Table 16) in the AM+Activity pigs compared with those under the AM+PM regimen.
42 The glucose levels were considered above the target range when the glucose reading was above 400 mg/dL. The mean value of the glucose when it was above the range for AM+PM was not significantly different than for the group AM+Activity as seen in Table 13. However, when comparing the variance there was a difference between the AM+PM (2687.2 ± 115.5) and the AM+Activity (2361.2 ± 70.1; Table 16). The variation in glucose
concentration increases in the AM+Activity when the glucose level was above the target range; however it was not significant (p = 0.0267; Table 16).
Average Daily Weight Gain
Average daily gain was calculated for diabetic and non-diabetic pigs during the 70-day period that the insulin dosing treatments were being compared. Average daily weight gain for the pigs in AM+PM regimen (0.65 ± 0.02 kg/day) was similar to that of
AM+Activity pigs (0.60 ± 0.02 kg/day), but significantly less (p < 0.05) than the level observed in the non-diabetic controls (0.85 ± 0.02; Table 17).
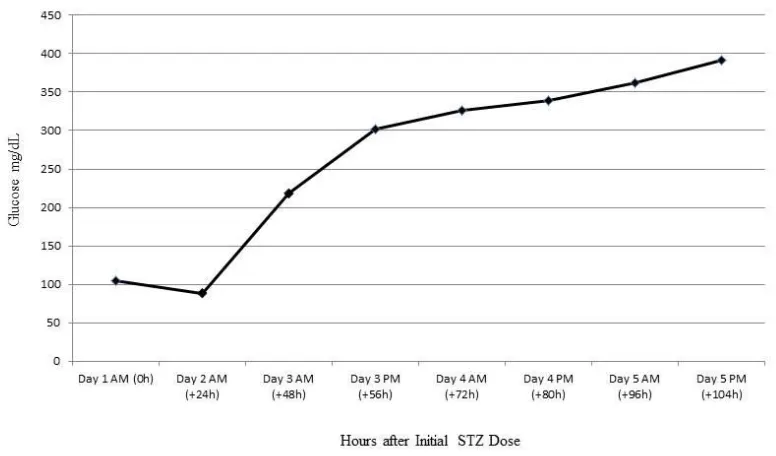
Efficiency of Diabetes Induction
43 (p < 0.05) to 218.4 ± 14.6 mg/dL and continued to increase reaching levels just under 400 mg/dL during the fifth day after STZ. It is important to recognize that these changes occurred prior to any insulin being administered.
In order to determine whether glucose after STZ and prior to insulin administration was correlated to the development of diabetes, pigs were divided into the low, medium, and high based on their diabetic condition score (Table 18) and differences among various
44 Tables 26, 27 and 28 contain growth, glucose and insulin characteristics for pigs in each diabetic severity group after administration of insulin began in an attempt to maintain glucose within the desired range of 250 to 400 mg/dL therapies were administered. These data are included for descriptive purposes. In general, glucose levels and insulin usage increased (p < 0.05) as the diabetic severity group increased while average daily gain decreased (p < 0.05).
Results from the multiple regression analyses (Table 29) indicated that the
combination of weight at the onset of diabetes induction and glucose changes during the first 5 days post STZ explained about 45% of the variation observed subsequently in the diabetic condition scores. Of the factors examined weight (partial R2=0.2285; p = 0.0105) and
minimum glucose levels (partial R2=0.1304; p = 0.0105) were the most important accounting for 40% of 45% that was attributed to the statistical model.
Changes in Body Conformation and Pig Behaviors associated with Diabetes
Behaviors during sampling and feeding and changes in body conformation in relation to the severity of diabetes were evaluated during the second study. The 24 diabetic pigs that were placed into low, medium, or high diabetic severity groups based on their diabetic condition scores (Table 30). Mean glucose levels, insulin usage, and average daily gain of pigs in these three groups are shown for descriptive purposes in Table 31. In general, pigs grew proportionately in terms of the dimensions of their mid-section and the main
46 DISCUSSION
As research into new treatments expands, pigs are becoming an integral part of clinical research. In the past, rodents have been used to model different diseases in order to monitor the progression, or to see the effectiveness of a drug. However, pigs have the ability to bridge the current gap between mouse models and human patients (Wolf et al. 2013). Pigs are the closest to humans both in physiology and pathophysiology; such as, gastrointestinal function, pancreas location and functionality, and metabolic regulation (Aigner et al. 2009). The use of pigs is especially important when studying diabetes, as this disease is considered a growing epidemic. Pigs have a pancreas that resembles the human pancreas in many
different ways; for example, in exocrine and endocrine function, size, shape, position, and even blood supply (Wolf et al. 2013). Due to these many factors, it is evident that the use of pigs in clinical research is growing; therefore, the ability to maintain chronically diseased pigs is of vital importance.
47 pig behaviors were associated with the severity of the diabetic condition.
With regards to the first objective, using only the morning glucose reading to
determine insulin doses for the entire day with subtle adjustments based on the pig’s behavior
was more effective at maintaining glucose concentrations within the target range of 250 to 400 mg/dL compared with using both morning and evening concentrations. Over a three-month period, pigs whose daily insulin regimen was adjusted once versus twice daily spent more days slightly below or within and less days above the target range for daily glucose. This resulted in an overall diabetic condition score that was closer to desired value of 2 (1.9 versus 2.5). In addition, they required less insulin over the same time period and the variation associated with daily insulin administered was considerably reduced which would be
indicative of a more consistent insulin dosing regimen for each pig.
48 decreased sensitivity most likely to receptor down regulation. This is the most plausible physiological explanation for the observed difference in the responsiveness between the two treatments.
The main reason that adjusting insulin doses based only on glucose concentrations in the morning rather than those for both the morning and evening most likely is due to the fact that the morning concentrations probably are more representative of a “fasting level”. It was observed that many of the pigs did not always eat all of their morning feed during the day; however, by the next morning the feeders were always empty. Consequently, pigs obviously had different patterns of feed intake and depending on whether they were “slow” or “fast” eaters during the day, their afternoon glucose concentrations were affected by how much and the timing of their last eating period relative to when the sample was taken. It is reasonable to speculate that a high glucose reading in the afternoon for these pigs was due in part to their diabetic condition and in part to their eating patterns. However, the appropriate insulin doses were determined based on the glucose levels being due solely to their diabetic condition. Therefore, it would be fairly easy to over- or under- dose the pigs in this situation. In
49 not change, then there was sufficient time for them to consume their meal prior to the
morning sampling and create at least a few hours or more of fasting prior to when their glucose readings were taken. Consequently, in future studies using pigs with chronic diabetes, it would be beneficial to only monitor glucose concentrations in the morning and use this concentration to determine current and subsequent insulin doses for the entire day.
Pigs can each have a different sensitivity to glucose concentrations, for some pigs being in the target range was too high and they would refuse to eat. Therefore, these pigs were maintained to be below the target range, which ensured they survived for the entire length of the study. By observing behavior, a slight change in the activity level of certain pigs was quickly acknowledged, allowing us to lower their glucose. This is important when maintaining pigs for a long term study as it is vital to keep the pigs alive throughout the length of the study. It has been determined that the best way to ensure the pigs survive long term is to err on the side of caution with their glucose concentration by keeping at a lower concentration. Interestingly, when comparing the variation in glucose concentration above the target range the AM+PM group was more consistent than AM+Activity; essentially, this demonstrates that when the second treatment was above the target range their glucose
50 healthier for a longer period of time if they do not have a glucose concentration above 400 mg/dL. This is of vital importance because if a pig is lost during a long term study it cannot be replaced.
The second objective of this study was to determine whether early changes in glucose concentrations during induction of diabetes with streptozotocin could be used to predict or estimate the severity of the subsequent diabetic condition that develops. This would be extremely beneficial to future diabetic studies because if a pig was deemed to be a bad fit for the study early, then it could be removed and replaced at the beginning rather than having its data excluded at the end after a significant amount of time and expense has already been invested in its collection. After administering the initial dose of streptozotocin the drug causes the death of a certain percentage of beta cells in the pancreas. This results in less insulin produced, which, in turn causes glucose to increase. In response to this, the remaining beta cells hyper-secrete insulin in an attempt to return the body to homeostasis. This causes a transient decrease in glucose after which glucose begins to increase and eventually reaches a new homeostatic concentration based on how many beta cells were destroyed by the
streptozotocin (Strauss et al. 2012). Consequently, it might be possible to use the initial changes in glucose as a bioassay for number and functionality of the remaining beta cells and the subsequent diabetic condition that develops.
51 the study mean. Several characteristics associated with the changes in glucose concentration during treatment with streptozotocin were examined to determine whether there were differences among the Low, Medium, and High pigs. The idea being that anything that was significantly different in the Medium group might be useful as a prospective screening criterion for the “ideal” diabetic condition.
The two most distinguishing characteristics of subsequent diabetic condition in were the change in glucose concentrations between 24 and 48 hours after the first stretozotocin treatment and the weight of the pigs when diabetic induction began. Pigs that were classified as having the desired diabetic physiology for this study, as mentioned earlier, were the ones in the Medium diabetic severity group. They exhibited significantly larger increases in glucose between 24 and 48 hours compared with the Low and High groups. This observation is somewhat surprising based on the subsequent description of what happens to glucose concentrations following streptozotocin treatment as one would expect the increase after 24 hours in the Medium group to be intermediate of the Low and High groups. The
52 24, but before 48 hours post treatment. Using the same logic, the largest difference could conceivably occur in the Medium group if the 24 hour sampling period was very close to the lowest concentrations that glucose reached following streptozotocin. It is not possible to determine if this occurred without a more frequent sampling regimen during the first 48 hours after streptozotocin which probably should be a consideration for subsequent studies. Regardless of how it occurred, changes in glucose concentrations between 24 and 48 hours after the initial treatment with streptozotocin appear to have promise as a prospective screening tool for the severity of the diabetic condition that develops when streptozotocin is used.
53 compared with the large pigs. Obviously, this speculation requires additional studies to
confirm.
Collectively, it seems reasonable that weight would be an easy criterion to use as a screening tool to eliminate pigs that are likely to develop a very severe diabetic condition: one in which glucose is consistently higher than 400 mg/dL and large amounts of insulin are needed to maintain them at this level. After this, then it appears there are number of
differences in glucose characteristics between the pigs that were classified as Low and Medium including the aforementioned change in glucose between 24 and 48 hours post streptozotocin and the maximum glucose concentrations during the first 5 days post
induction. Therefore, could envision a sequential process in terms of screening pigs for their subsequent diabetic fitness which would include body weight limits prior to treatment
followed by monitoring changes between 24 and 48 hours post treatment and eventually ending up with determining the maximum glucose concentrations reached during the first 5 days. Based on the regression analyses, this approach would explain 45% of the total variation observed in final diabetic condition that is achieved.
Body measurement and daily behaviors associated with glucose sampling and feeding were quantified for all pigs in the second study. This was done to determine whether any unique patterns in growth and behaviors developed in diabetic pigs. A common, though unconfirmed, observation is that pigs that become severely diabetic develop what is referred to as “pot bellies”. From a physiological perspective, this would occur when the depth of the
54 addition, it has also been stated, but not objectively evaluated that pigs with very high
glucose concentrations are more lethargic and have more feed refusals compared with pigs with reduced concentrations. This observation is consistent with the diabetic condition in other animals. If either of these relationships is correct, then they would provide additional measurements that could be used to manage diabetic pigs in long term studies.
A similar approach was taken for this analysis as was used for the one that was used to evaluate early changes in glucose and their usefulness in predicting the subsequent severity of the diabetic condition that develops. Pigs were placed into diabetic severity groups based their diabetic condition scores and then differences among these groups in their behaviors and body proportions were evaluated. The pigs with the most severe diabetic condition (High group) were considerably smaller than the pigs in the other two groups. However, there were not significant differences in the relative proportions of their mid-sections: heart, mid-, and rear girths and body lengths. In other words, these pigs were small but they all grew proportionally. Similarly, there were no significant differences in the overall mean behavior scores among treatments. In fact, mean values were quite high and close to “normal” in all three groups. This probably is why when, on an individual basis, pigs did occasionally go “off feed” and act lethargic it was so noticeable and an easy criterion to
use for adjusting daily insulin doses as described earlier.
In summary, using streptozotocin to induce diabetes in pigs is a very successful