ISSN(Online): 2320-9801
ISSN (Print) : 2320-9798
I
nternational
J
ournal of
I
nnovative
R
esearch in
C
omputer
and
C
ommunication
E
ngineering
(An ISO 3297: 2007 Certified Organization)
Vol. 4, Issue 10, October 2016
Planning and Optimization of
HSPA RF Network in BSNL Service Area
Smt. I. Kullayamma1, V.Sravya Rao2
Asst. Professor, Department of E.C.E, S.V.U College of Engineering, Tirupati, Andhra Pradesh, India1
M. Tech, Department of E.C.E, S.V.U College of Engineering, Tirupati, Andhra Pradesh, India2
ABSTRACT: By ensuring that the RF coverage is sufficient within the network will have to start naturally by a good RF network plan. 3G HSPA, is the combination of two technologies, downlink and the uplink that can be built onto the existing 3G UMTS or W-CDMA technology to provided to increase the data transfer speeds and is designed after system level simulations in coverage planning and code and parameter definitions like Ec/Io, Pilot pollution. And this paper requires us to work on various tools such as planning tool like Atoll, JDSU 16.3 Drive test tool, ACTIX Post processing tool. The phases of planning are verification, monitoring and optimization when the radio network is implemented. Optimization is a very critical set of activity in the life cycle of any wireless network. Drive-test tool system is used to solve network problems, with the goal of collecting data as a function of location. By using collected data, post processing software tools were used to identify the causes of problems and to determine how these can be solved effectively and efficiently.
KEYWORDS: Benchmarking; Drive-Testing; High Speed Packet Access (HSPA); Optimization; Planning; Post-Processing.
I. INTRODUCTION
3GPP is a special international committee which working on development of 3G/LTE/ 4G mobile technologies. In their releases R7 is providing Higher Data rates i.e., more is the main part of investment for operators. Hence one of the key issues for the operator is to propose a cost-effective RAN solution. Network planning is, may be even more for existing operator, an area that is too often overseen. A good network plan should address the coverage and capacity requirement of the area considered, but also be flexible enough to allow network expansion without any major changes in the existing sites. In WCDMA, the coverage and capacity requirement are dependent. In detailed planning, a more advanced planning tool based on highly accurate digital maps is required to get reliable coverage predictions. The main tool used in planning is the power budget, which links the selected base station configuration to the maximum allowed attenuation of the radio signal in the radio path, i.e., maximum path loss. The maximum cell size can be calculated from the maximum path loss with propagation prediction models. The planning threshold (and maximum path loss) is service-specific and it depends on the service-quality targets, e.g., data rate, BER target, coverage probability, etc. Firstly, Verification of the radio network is mainly carried out with the use of a radio interface field measurement tool like Drive test tool and Analyzer. Monitoring contains Key Performance Indicator (KPI) values that are related to coverage, capacity and QoS. Optimization contains different kinds of planning-related actions to solve problems found in the verification and monitoring phases. The primary tool used by most of the service providers is a Drive-test tool and to collect the data. Once the data has been collected, post processing is processed. RF performance parameters such as the received signal strength, Ec/Io, Throughput, Channel quality indicator (CQI), pilot pollution etc., are defined as the efficient and effective functioning of the RF network. If the planning and optimization is successfully performed, then the Quality of Service, availability, reliability of RF Coverage area will be highly improved. This will be resulting in more customers and also more profits to the mobile telecom service providers.
II. LITERATURE REVIEW
ISSN(Online): 2320-9801
ISSN (Print) : 2320-9798
I
nternational
J
ournal of
I
nnovative
R
esearch in
C
omputer
and
C
ommunication
E
ngineering
(An ISO 3297: 2007 Certified Organization)
Vol. 4, Issue 10, October 2016
studied. The success depends on Coverage, Capacity and Quality. Capacity depends on assessment of dropped calls and congestion which can be removed by optimizing properly. Quality improves by eliminating interference from both internal and external sources. To assess coverage and capacity drive test is performed. The Quality of a Radio Network not only depends on these factors but also on frequency allocation. The most severe problems in a radio network can be recognized as signal interference, dropped calls and the amount of congestion that optimization has removed. The criteria that are discussed in radio planning procedure were met and on completion of the process, the needed KPI values were attained. As a result, dropped calls, handover, interference and RX levels were all improved. After that, the frequency planning of LTE is also studied. Finally after taking the required data drive tests has been conducted. By evaluating the drive test data post-processing is executed such that to solve the problems that arise during a drive-test.
III.METHODOLOGY &RADIO NETWORK PLANNING
Dimensioning is the first phase of network planning. It not only estimates the count but also checks the capacity of radio network elements. This tool should be accurate to provide results of accuracy at an acceptable level, when loaded with traffic profile and subscriber base. Dimensioning is divided into two phases i.e., coverage and capacity planning phases. The two phases are independent from each other. In this paper using Atoll radio planning and optimization software to provide required number of sites for the capacity planning phase.
Planning an immature network with limited number of subscribers is not actually a problem, but the network planning target is to define the network design that can be built as a cellular network. This design can be extension of an existing network or can be a new network. In future network structure it will save money for an operator by reusing the site location.
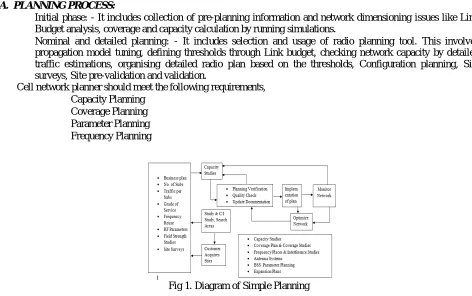
A. PLANNING PROCESS:
Initial phase: - It includes collection of pre-planning information and network dimensioning issues like Link
Budget analysis, coverage and capacity calculation by running simulations.
Nominal and detailed planning: - It includes selection and usage of radio planning tool. This involves propagation model tuning, defining thresholds through Link budget, checking network capacity by detailed traffic estimations, organising detailed radio plan based on the thresholds, Configuration planning, Site surveys, Site pre-validation and validation.
Cell network planner should meet the following requirements,
Capacity Planning
Coverage Planning
Parameter Planning
Frequency Planning
Fig 1. Diagram of Simple Planning
Planning can be simplified and structured in certain steps as shown above.
ISSN(Online): 2320-9801
ISSN (Print) : 2320-9798
I
nternational
J
ournal of
I
nnovative
R
esearch in
C
omputer
and
C
ommunication
E
ngineering
(An ISO 3297: 2007 Certified Organization)
Vol. 4, Issue 10, October 2016
operators requirement dimensioning can be done through the configurations and the amount of network equipment can also be estimated.
Coverage:
Coverage regions
Area type information
Propagation conditions.
Capacity:
Spectrum available;
Subscriber growth forecast;
Traffic density information. Quality of Service:
Area location Probability
Blocking probability;
End user throughput.
B. ATOLL PLANNING TOOL:
The tool used here which is open, scalable, flexible multi- technology and also an optimization platform that supports throughout the network lifecycle.
Its general features are shown below: 1. Multi technology tool
a. Dedicated Project Templates & Propagation Models for all supported technology
2. User friendly GUI
a. Windows based tools
b. Easy to export/ import all required data
c. Simply support copy/paste all data
3. Flexibility in data management
a. Display, Sorts & Filter
4. Working systems
a. Stand alone .atl documents.
After the detailed coverage planning and capacity analysis, simple coverage optimization is needed. The tool helps the planner to optimize the configurations of base station, the antenna selection, directions and the site locations, to meet the quality of service and the capacity, service requirements at lowest amount.
Fig.2 Pilot Quality Analysis in Selected Region
IV.RADIO NETWORK OPTIMIZATION
To improve the performance every network needs to be under continues control. The only way to keep track of the network and to look deep into statistics, also analyzing drive test data is Optimization. For the future capacity
enhancements it is keeping an eye on its growth and is modifying. It also helps in operating andmaintenance of the
ISSN(Online): 2320-9801
ISSN (Print) : 2320-9798
I
nternational
J
ournal of
I
nnovative
R
esearch in
C
omputer
and
C
ommunication
E
ngineering
(An ISO 3297: 2007 Certified Organization)
Vol. 4, Issue 10, October 2016
A Successful Optimization requires:
• Identifying and understanding the common reasons for failure of a call • Capturing of the RF and digital parameters for call prior to drop
• Analysing the call flow, checking messages for both forward and reverse links to establish what, where and why it has happened.
A. PURPOSE AND SCOPE OF OPTIMIZATION:
The optimization aim is to provide the best network quality using an available spectrum as efficiently as possible. The possibility will consist all below:
• To find and correct the existing problems after site is implemented. • Meeting the network quality criteria.
• Optimization is a constant and replication process of improving overall network quality. • Optimization cannot decrease the performance of the rest in a network.
• It is divided into minor areas called clusters for optimization and follow up processes easier to handle.
B. OPTIMIZATION PROCESS:
In optimization we need to perform problem analysis, drive testing, investigating drive test and also observing other interference sources.
1. Problem Analysis
a. Analyzing performance statistics for the worst performing BSCs and Sites
b. Viewing ARQ Reports for BSC/Site performance trends
c. To Examine the Planning tool predictions for Coverage
d. Analyzing the data of previous drive test
e. Consulting local engineers to prioritize problems
f. Read-through Customer Complaints reported to local engineers
2. Checks Prior to Action
a. Investigating BSC, main cities, freeways, Major roads. b. Looking into trouble ticket history for previous problems c. Checking customer distribution and habits (voice/data usage)
d. Examine reports which are fault to limit hardware problems.
e. Operating correct traces on Network to solve problems
V. DRIVE TESTING
The drive testing is fundamentally collecting the data with a phone, but analysis and evaluation part that is done after completion of the test is the main part. In which kind of vehicle you are taking a drive test really does not matter but the hardware and software used in the test are important. Data from every unit in drive test are collected and stored in output files.
Drive testing is the most frequent way to study network performance by means of coverage evaluation, system availability, capacity of a network, and retain ability and call quality in real time (Live) during the test on the field. It provides a huge outlook to the service provider about what is happening with a subscriber point of view.
A drive test needs following:
A notebook - or other similar device,
With Software installed,
A Security Key - Dongle - given to the related software,
Mobile Phone,
One GPS,
A Scanner – optional.
ISSN(Online): 2320-9801
ISSN (Print) : 2320-9798
I
nternational
J
ournal of
I
nnovative
R
esearch in
C
omputer
and
C
ommunication
E
ngineering
(An ISO 3297: 2007 Certified Organization)
Vol. 4, Issue 10, October 2016
Fig.3: Schematic diagram of drive test
GPS: collection of data for latitude and longitude at each point, measurement data, time, speed, etc. It is useful as shows the correct routes.
MS: mobile data collection, such as signal strength, finest server, and more.
SCANNER: collecting data all over the network, since the mobile radio is a limited and all the necessary data
does not handle for more complete analysis.
At present, there are cell phones that do everything. They not only have GPS, but also the collection of specific software. They are extremely practical, but are still quite valuable.
Types of Drive Test
Performance Analysis
Adding of New Sites and modifying parameters of Existing Sites
Marketing
Benchmarking
Tests for Analysis of a Performance is the most common, and generally made into clusters i.e., an area with some site of interest. To answer a customer complaint, they can also be performed in such situations.
In integration testing of new sites, it is suggested to perform two tests: first is with a site without handover permission i.e., not able to handover to another site. As a result total representation of the coverage area is obtained. The other is normal handover which is a site final state. Based on type of alteration of a site both tests are also recommended. Otherwise, a normal test is enough.
Marketing tests are generally requested by a marketing area of the company, for case in point showing the coverage along a highway, or at a particular region or location.
A test of Benchmarking leads to compare the competing networks. If the result is better, it can be used as an argument for new sales. If worse, it shows where the network has to be improved.
A. DRIVE TEST PRE REQUIREMENTS:
Before drive testing we need to gather the required information for a group of sites like:
Site Database, which has parameters of Antenna like Azimuth, antenna tilts, Antenna Type, Height, Tilt, Azimuth(Verification and Optimization)
Digital Maps for Drive Test
Detection of Frequency Optimization and Interference
Neighbor List to compare who is missing for a count or unnecessarily defined for removal ( Neighbor Optimization)
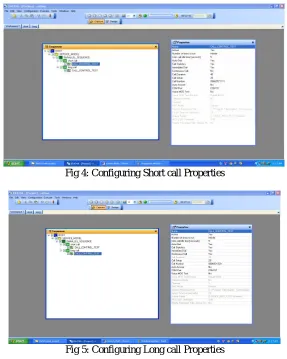
B. DRIVE TEST PROCEDURE:
After collecting the necessary information, the drive test will be started. The equipment is placed in a vehicle and then long calls as well as short calls are generated. A long call is generated as well as terminated by the user himself whereas a short call is a preprogrammed call and generated by a system for a small duration of 10 seconds or more. A long call is used to measure the success rate of handover as well as the Rx quality, while on a short call CSR and Rx level are measured.
ISSN(Online): 2320-9801
ISSN (Print) : 2320-9798
I
nternational
J
ournal of
I
nnovative
R
esearch in
C
omputer
and
C
ommunication
E
ngineering
(An ISO 3297: 2007 Certified Organization)
Vol. 4, Issue 10, October 2016
observed and stored during the drive test.
The drive test procedure is as follows:
• Tool is setup for two mobiles – One for Long calls another for short calls (2 minutes). In the route map the following are enabled for Analysis:
• Rx Level & RX Quality
• Survey Markers (like H/O, DCR )
• Cell site Database.
• Statistics of a Call for the Calls in the Point -1 to be enabled.
Conducting a Drive Test for all sectors by observing the Parameters like Received Signal Code Power, Ec/Io & Eb/No, Handovers & Drop Calls, Throughput and observe whether the nearest sector is serving or not.
As per the requirements data is observed and recorded. The recorded data is analyzed for performance.
Fig 4: Configuring Short call Properties
Fig 5: Configuring Long call Properties
C. DRIVE TEST ANALYSIS:
In the market every leading network service provider should follow the Benchmarks of TRAI. A network is supposed to be fine if it satisfies the benchmarks of TRAI.
D. POWER ANALYSIS:
ISSN(Online): 2320-9801
ISSN (Print) : 2320-9798
I
nternational
J
ournal of
I
nnovative
R
esearch in
C
omputer
and
C
ommunication
E
ngineering
(An ISO 3297: 2007 Certified Organization)
Vol. 4, Issue 10, October 2016
call was approximately 40 seconds, by assuming 7 seconds of connection time. The whole benchmark runs for 77 seconds. The power clearly dominates in this benchmark at 832.4 ± 99.0 mW ~ 901.4mW (generally accepted).
Now, if we ignore the power that is being utilized by the phone, i.e, Backlight and Keypad which consumes around 99% of the consumption (some of the power is used to maintain the call strength of the mobile which is being ignored, as the power obtained is compared to that of the transmitting tower), the power utilized by calls is 0.168 mW +/- 10% (can also be found in certain specifications of mobiles)
Let us assume the power to be 0.17mW (for easier calculation). The number of users (Peak time for the assumed tower) is 250. Then, power transferred is PtGtGrf2 / (4*pi*R2).
Let Gain = 2 (3dB) in the direction of a receiving antenna with a gain of 1.6 (=2dB). Distance = 25km (Coverage of a tower)(assumed).
Power Utilized for transmission of signal = 250W WCDMA Frequency = 5Mhz.
Power = 10 * 2 * 2 * 5 *106 / 4 * 3.14 * 25000 * 25000 = 2 * 108 / 785 * 107 = 25mW From conversion of dBm to watt, we find that 25mW corresponds to 14 dBm
The following variations are to be accounted for accurate Readings. Gain of the sending antenna varies from 1-5 dB and is company specified.
Receiving antenna gain (Mobile) : Currently we are using monolithic embedded RF antenna so gain is approximated to 1.6. Generally it is lower or higher. Distance to be covered is done in the planning stage, and some try directing their antennas to cover a lower range (Urban Locations), while some might be concentrating on far places (Rural Locations).
I. Subjects to Investigate
Non–working sectors or Transmitters
Drop Calls
Frequency hopping
Overshooting sites - coverage overlaps, Coverage holes
Analysis of C/I, C/A
High Interference Spots
Disabled GPRS
Capacity Problems
II. Other Interference Sources
One–way and missing neighbours
Handovers
Retain ability and Accessibility of the Network
Equipment Performance
VI.POST PROCESSING
Actix analyzer is one of the post-processing software applications that provide a series of analysis tools for cellular network data.
This tool is designed to address the applications such as: • Network performance and optimization
• Testing of its features • Validation of a Service
• Diagnosis and analysis of a Problem. • Network Benchmarking
ISSN(Online): 2320-9801
ISSN (Print) : 2320-9798
I
nternational
J
ournal of
I
nnovative
R
esearch in
C
omputer
and
C
ommunication
E
ngineering
(An ISO 3297: 2007 Certified Organization)
Vol. 4, Issue 10, October 2016
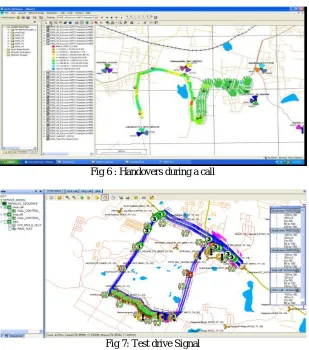
Fig 6 : Handovers during a call
Fig 7: Test drive Signal
In the above figure we can clearly see a drive test area of both short call and a long call. From the results that are obtained from post-processing of the drive-test we can have a graph that are related to eachother like distributions in Ec/No as shown below.
ISSN(Online): 2320-9801
ISSN (Print) : 2320-9798
I
nternational
J
ournal of
I
nnovative
R
esearch in
C
omputer
and
C
ommunication
E
ngineering
(An ISO 3297: 2007 Certified Organization)
Vol. 4, Issue 10, October 2016
VII. RESULT
Call Analysis:
(i) Call Setup Success Rate:
Rate of calls which are successfully established. CSSR= No. of calls successfully setup * 100 Total no. of calls attempted
(ii) Drop Call Rate:
DCR= No. of Dropped calls * 100 Total no. of calls Established
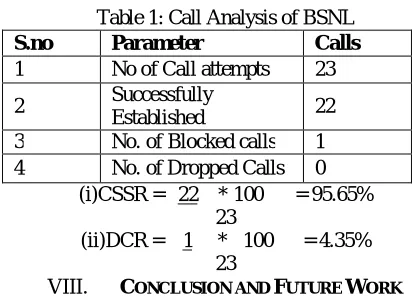
Table 1: Call Analysis of BSNL
S.no Parameter Calls
1 No of Call attempts 23
2 Successfully
Established 22
3 No. of Blocked calls 1
4 No. of Dropped Calls 0
(i)CSSR = 22 * 100 = 95.65%
23
(ii)DCR = 1 * 100 = 4.35% 23
VIII. CONCLUSION AND FUTURE WORK
The overall objective of any RF design depends on number of factors determined by requests of customer. Through radio network optimization the Quality of service and usage of resources of a network are greatly improved and the balance between coverage capacity and quality is achieved and performed in selected service area.
The project mainly focuses on the signal strength that the user receives for his utilization. This procedure is being undertaken since a few decades, and will also be continued for another few decades. This is due to use of wireless technologies for the application. But during the planning and initialization, and a lot of factors have to be considered like the number of users, the number of adjacent serving towers, the pilot pollution, near-far effect, handovers, etc.,
The project has to be implemented along in the future also as to ascertain whether the benchmarks that have been set prior are being executed as per the guidelines. If it fails to happen then the cause of such is ascertained and the steps that have to be undertaken are analyzed and implemented.
REFERENCES
1. R. S. Kshetrimayum. - EC635 Advanced Topics in Communication Systems
2. E. Benner and A. B. Sesay- Effects of antenna height, antenna gain, and pattern downtilting for cellular mobile radio. IEEE Transactions on Vehicular Technology, 45(2), May 1996.
3. F. Gunnarsson, M. Johansson, A. Furuska¨r, M. Lundevall, A. Simonsson, C. Tidestav, and M. Blomgren. Downtilted Base Station Antennas–A Simulation Model Proposal and Impact on HSPA and LTE Performance. In IEEE 68th Vehicular Technology Conference, 2008. VTC 2008-Fall, pages 1–5, 2008.
4. Erik Dahlman, Stephan Parkvall - 3G Evolution HSPA and LTE for Mobile Broadband.
5. John Wiley and Sons -WCDMA for UMTS: Radio Access for Third Generation Mobile Communications. 6. Juha korhonen. - Introduction to 3G mobile Communications .
7. Peter Wong and David Britland. - Mobile Data Communications Systems.
8. Moe Rahnema - UMTS Network Planning and Optimization and Inter-Operation with GSM.
9. N. Chandran and M. C. Valenti. Three generations of cellular wireless systems. IEEE Spectrum, pages 32–35, Jan/Feb 2001.
10. A. Goldsmith. Wireless communications. Cambridge University Press, 2005.
11. V. Tarokh, H. Jafarkhani, and A. Calderbank. Space-time block codes from orthogonal designs. IEEE Transactions on Information Theory, 45(5):1456–1467, 1999.